Services · NSE: ADANIPORTS · BSE: 532921
Adani Ports: how the business works
Adani Ports has 16 ports and terminals in India by its own count (Sep 2026, including two Paradip berths awarded that month) and 4 abroad, and earned ₹38,736 crore of revenue in FY26.
Follow Adani Ports
Email me when Adani Ports's page is updated after results.
We store your email address with Kit, our email provider, which also records when you sign up and whether you open or click our emails. We send a confirmation email first. See our privacy policy.
Adani Ports and Special Economic Zone Ltd · Ahmedabad, Gujarat · Founded 1998
Updated for Q2 FY27 · checked
- Revenue, FY26
- ₹38,736 cr
- Profit to shareholders, FY26
- ₹12,806 cr
- Cargo handled at its ports, FY26
- 500.8 million tonnes
- Share of all cargo at Indian ports, FY26 (company figure)
- 27.1%
- Promoter holding, Sep 2026 (none pledged)
- 66.03%
The short version
Adani Ports in 5 points
1 · What it sells
Adani Ports has 16 ports and terminals in India by its own count (Sep 2026, including two Paradip berths awarded that month) and 4 abroad, where it loads, unloads and stores cargo; it also runs trains, trucks, warehouses and service vessels, and its FY26 revenue was ₹38,736 crore.
2 · Who pays it
Shipping lines, importers, exporters and industrial companies pay Adani Ports; it does not split revenue by type of customer, and no single customer brought in 10% or more of FY26 revenue.
3 · What it keeps from ₹100
Of every ₹100 that came in during FY26, including other income, Adani Ports kept ₹31.1 as profit for shareholders, and its operating profit before interest, tax and wear and tear (EBITDA) was ₹59.0 per ₹100 of revenue.
4 · Where the operating profit comes from
In the audited accounts, the Port and SEZ segment earned ₹16,942 crore of the ₹17,592 crore FY26 segment result (profit before interest and tax), or 96.3%, and the Others segment, mainly logistics, ₹649 crore.
5 · The one thing to watch
Adani Ports agreed on 5 Nov 2026 to buy Evos at an enterprise value of €2.56 billion, funded with debt, and puts pro forma net debt at 2.76 times EBITDA; its stated policy is up to 2.5 times.
Sources: From Adani Ports' FY26 annual report, its Q4 FY26 and Q2 FY27 results and presentations, and its 5 Nov 2026 Evos filing · checked
Sources (7)
- Media release and results presentation Q2 and H1 FY27
- Reg 30 disclosure: Letter of Award for two dry bulk berths at Paradip Port
- Integrated Annual Report FY26 (2025-26), incl. consolidated financial statements
- Business Responsibility and Sustainability Report FY26
- Audited financial results Q4 FY26 and FY26 (to 31 Mar 2026), with board outcome (dividend, director, internal auditor)
- Reg 30 disclosure, media release and presentation: agreement to acquire 100% of Evos B.V.
- Media release and results presentation Q4 FY26 and FY26
01Where the money goes · FY26
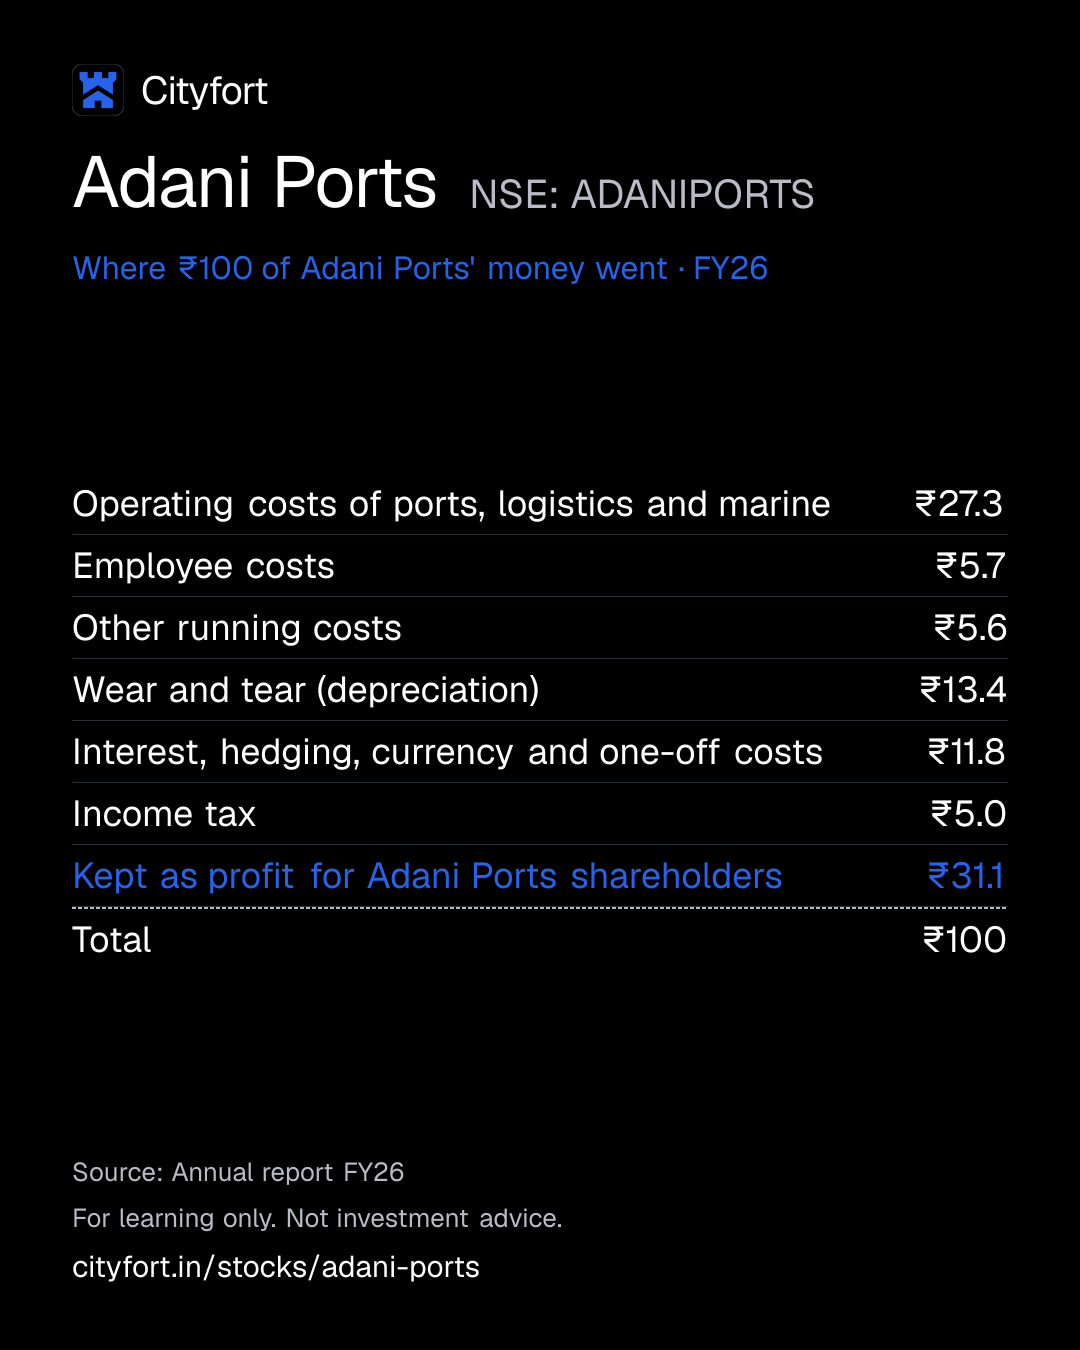
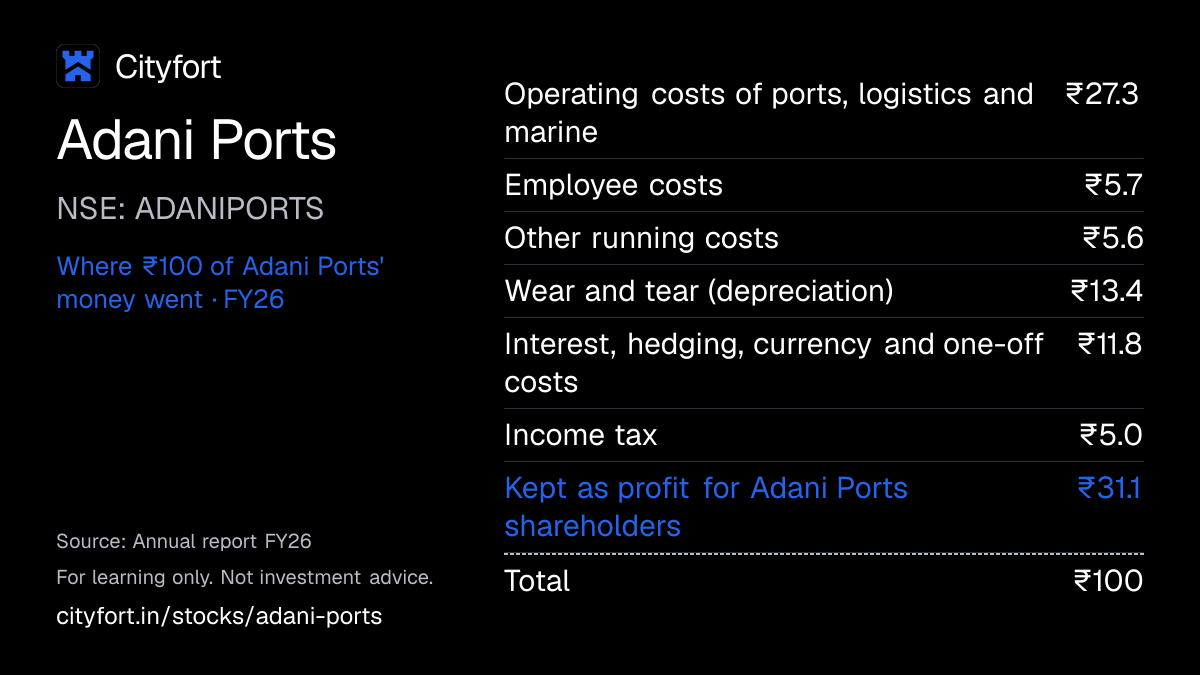
Where does ₹100 of Adani Ports' money go?
Adani Ports · FY26
Receipt for every ₹100
| Operating costs of ports, logistics and marine | ₹27.3 |
|---|---|
| Employee costs | ₹5.7 |
| Other running costs | ₹5.6 |
| Wear and tear (depreciation) | ₹13.4 |
| Interest, hedging, currency and one-off costs | ₹11.8 |
| Income tax | ₹5.0 |
| Kept as profit for Adani Ports shareholders | ₹31.1 |
| Total | ₹100 |
Each line = amount ÷ total money in × 100. Lines may not add to exactly ₹100 because of rounding.
How this is worked out
Of every ₹100 that came in during FY26: revenue (₹38,736 crore), other income (₹2,119 crore) and the share of part-owned companies' profit (₹258 crore). The interest line includes ₹3,833 crore of interest, an ₹812 crore loss on hedging contracts and ₹208 crore of one-off charges. Minority partners in subsidiaries bore ₹24 crore of losses, which adds to shareholders' profit.
Save this receipt as an image
Embed this receipt or the key numbers
Paste this code into a blog or website to show the card you choose, with a link back to this page.
Each week: the next company due to report results, explained in 5 points.
We'll email you once a week with what changed on Cityfort. Facts only, no tips. Unsubscribe any time.
We store your email address with Kit, our email provider, which also records when you sign up and whether you open or click our emails. We send a confirmation email first. See our privacy policy.
02The business in one line
What does Adani Ports do?
Shipping lines and cargo owners pay Adani Ports to load, unload, store and move their goods; most of the money goes on running costs, wear and tear of assets and interest, and what's left is profit.
- By the company's own split, ports in India brought in ₹25,755 crore, or 66.5%, of FY26 revenue of ₹38,736 crore.
- Of every ₹100 that came in during FY26, ₹27.3 went on operating costs, ₹13.4 on wear and tear and ₹11.8 on interest and related costs; ₹31.1 was left as profit.
03Who pays it
Who pays Adani Ports?
Adani Ports does not disclose how much each type of customer pays.
Shipping lines and container operators
Pay to berth ships and load and unload containers. Containers were about 45% of FY26 cargo, CARE says.
Bulk cargo owners
Industrial, manufacturing and farm businesses moving coal, minerals, fertiliser and grain. CARE puts coal at about 32% of FY26 cargo and crude and liquids at about 5%.
Importers, exporters and freight forwarders
Pay for rail, trucking, warehouses and logistics parks that move goods between ports and inland cities.
Port operators and energy companies
Hire its tugs and other service vessels; ICRA names port operators, LNG terminal operators and oil and gas companies.
Industries in its SEZs
Lease land in the special economic zones beside its ports.
Where its revenue came from · FY26
- India83.2%
- Outside India16.8%
How spread out the customers are
Adani Ports does not split revenue by type of customer. No single customer was 10% or more of FY26 revenue. ICRA says about 53% of its cargo is sticky, tied to long-term customer arrangements.
Sources (6)
- Business Responsibility and Sustainability Report FY26
- CARE Ratings press release: ratings reaffirmed (CARE AAA; Stable / CARE A1+)
- Media release and results presentation Q2 and H1 FY27
- ICRA rating rationale: ratings reaffirmed ([ICRA]AAA (Stable) / [ICRA]A1+)
- Media release and results presentation Q4 FY26 and FY26
- Integrated Annual Report FY26 (2025-26), incl. consolidated financial statements
04How it makes money
How does Adani Ports make money?
Ports in India keep most of their revenue as operating profit; the newer businesses keep less.
In FY26 ports in India kept ₹73.2 of every ₹100 of revenue as EBITDA, by the company's own split. EBITDA is profit before interest, tax and wear and tear. Logistics kept ₹19.3 and ports abroad ₹28.6. So Indian ports, with 66.5% of revenue, earned 82.5% of EBITDA.
Cargo handled at its ports, million tonnes
450.2500.8
FY25 to FY26
- Ports cost a lot to build: capex was ₹15,320 crore in FY26.
- Ships and cargo owners pay charges on cargo: 500.8 million tonnes in FY26.
- Ports in India kept ₹73.2 of every ₹100 of FY26 revenue as EBITDA.
- Trains, trucks and warehouses bring inland cargo to its ports; ICRA calls about 53% of cargo sticky.
- Operating cash flow of ₹20,356 crore covered FY26 capex.
- New capacity, 653 to 671 million tonnes between Mar and Sep 2026, lets it handle more cargo.
↺ Step 6 feeds back into step 1.
05Business segments · FY26
Which businesses make up Adani Ports?
Port and SEZ
86%Ports in India and abroad, marine services and SEZ land. It earned 96.3% of the ₹17,592 crore FY26 segment result. Shares are before ₹235 crore of sales between segments is removed.
Revenue ₹33,532 cr · Operating profit ₹16,942 cr
Others
14%Mainly logistics and transport: container trains, trucking, warehouses and logistics parks.
Revenue ₹5,439 cr · Operating profit ₹649 cr
How the mix changed
- Port and SEZ
- Others
Revenue by segment, FY25 to FY26.
₹ crore
See the numbers
06The numbers · Consolidated · ₹ crore
How has Adani Ports done?
Revenue
₹38,736 crFY26
Revenue grew every year, from ₹17,119 crore in FY22 to ₹38,736 crore in FY26; NQXT in Australia is included from Q4 FY26.
₹ crore
See the numbers
Net profit
₹12,806 crFY26
Profit for shareholders rose from ₹4,886 crore in FY22 to ₹12,806 crore in FY26; FY25 and Q1 FY25 include a one-off ₹603 crore gain from selling 49% of the Ennore container terminal.
₹ crore
See the numbers
Net profit for every ₹100 of revenue
₹33.1FY26
EBITDA stayed between ₹59.0 and ₹61.5 of every ₹100 of revenue from FY22 to FY26, leaving out FY25's ₹603 crore stake-sale gain.
Net margin: ₹ of net profit per ₹100 of revenue
See the numbers
Free cash flow
₹5,036 crFY26
Free cash flow was positive every year from FY22 to FY26, but fell to ₹5,036 crore in FY26 as capex rose to ₹15,320 crore.
₹ crore · cash from operations minus spending on plants and equipment
See the numbers
See all yearly numbers
EBITDA = profit before interest, tax and wear-and-tear of assets. Financial year runs April to March (March year end). Net profit is the share belonging to the company's owners.
Sources (18)
- Integrated Annual Report FY23 (2022-23), incl. consolidated financial statements
- Media release and results presentation Q2 and H1 FY27
- Integrated Annual Report FY24 (2023-24), incl. consolidated financial statements
- Integrated Annual Report FY26 (2025-26), incl. consolidated financial statements
- Integrated Annual Report FY25 (2024-25), incl. consolidated financial statements
- Audited financial results Q4 FY26 and FY26 (to 31 Mar 2026), with board outcome (dividend, director, internal auditor)
- Consolidated results XBRL Q1 FY25
- Unaudited financial results Q1 FY26 (quarter to 30 Jun 2025), consolidated
- Consolidated results XBRL Q2 FY25
- Consolidated results XBRL Q3 FY25
- Consolidated results XBRL Q4 FY25 (integrated filing)
- Consolidated results XBRL Q1 FY26 (integrated filing)
- Consolidated results XBRL Q2 FY26 (integrated filing)
- Unaudited financial results Q2 FY27 (quarter and half year to 30 Sep 2026), standalone and consolidated
- Consolidated results XBRL Q3 FY26 (integrated filing)
- Consolidated results XBRL Q4 FY26 (integrated filing)
- Consolidated results XBRL Q1 FY27 (integrated filing, revision)
- Consolidated results XBRL Q2 FY27 (integrated filing)
07Who runs it
Who runs Adani Ports, and did they deliver?
Gautam S. Adani
Chairman
Karan Adani
Managing Director
Ashwani Gupta
Whole-time Director and CEO
Sreedhar Krishna Menon
Chief Financial Officer · since 2026
CFO from 1 Mar 2026, after D. Muthukumaran moved to another group role.
Kamlesh Bhagia
Company Secretary
What they said, and what happened
2 delivered · 3 too early to tell
Said on 3 Feb 2026
FY26 EBITDA of ₹22,800 crore, after raising the guidance by ₹800 crore on the Q3 FY26 call.
DeliveredWhat happened
FY26 EBITDA was ₹22,851 crore.
Said on 30 Apr 2026
Keep net debt at up to 2.5 times EBITDA (the company's stated policy).
DeliveredWhat happened
The company reported 1.9 times for FY26 and 1.8 times in H1 FY27. For the Evos deal it gives a pro forma 2.76 times, which it expects to be about 2.5 times by FY27.
Said on 28 Oct 2026
FY27 revenue of ₹44,000–46,000 crore and EBITDA of ₹26,000–27,000 crore, raised from ₹43,000–45,000 crore and ₹25,000–26,000 crore given on 30 Apr 2026.
Too early to tellWhat happened
H1 FY27 revenue was ₹22,161 crore and EBITDA ₹13,347 crore.
Said on 17 Apr 2025
NQXT in Australia to reach EBITDA of A$400 million within 4 years.
Too early to tellWhat happened
NQXT has been in the accounts since Q4 FY26. Ports abroad, including NQXT, had EBITDA of ₹878 crore in Q2 FY27.
Said on 28 Oct 2026
Reach 1 billion tonnes of domestic port capacity by FY31.
Too early to tellWhat happened
Domestic capacity was 671 million tonnes in Sep 2026, up from 653 in Mar 2026.
Sources (9)
- Integrated Annual Report FY26 (2025-26), incl. consolidated financial statements
- Board outcome 3 Feb 2026: Q3 FY26 results and change of CFO
- Q3 FY26 earnings call transcript (call 3 Feb 2026; link filed with NSE 9 Feb 2026)
- Media release and results presentation Q4 FY26 and FY26
- Media release and results presentation Q2 and H1 FY27
- Reg 30 disclosure, media release and presentation: agreement to acquire 100% of Evos B.V.
- Unaudited financial results Q2 FY27 (quarter and half year to 30 Sep 2026), standalone and consolidated
- Media release: APSEZ acquires NQXT Australia (50 MTPA) via share issue to a related party
- Q2 FY27 earnings call transcript (call 28 Oct 2026; link filed with NSE 2 Nov 2026)
08What could go wrong
What could go wrong for Adani Ports?
- Debt
Debt for the Evos deal
The €2.56 billion Evos deal is to be funded with debt. The company puts pro forma net debt at 2.76 times EBITDA, and expects about 2.5 times by FY27. Its stated policy is up to 2.5 times.
Watch Company-reported net debt to EBITDA each quarter (1.8 times in H1 FY27).
- Currency
Foreign-currency borrowing
About 79% of debt in Mar 2026 was in foreign currency, CARE says. Currency losses were ₹1,886 crore in FY23; FY26 had an ₹812 crore loss on hedging contracts.
Watch Hedging and currency lines in finance costs each quarter.
- Demand
Trade disruptions
Management said the West Asia crisis hurt container and rail volumes in Q1 FY27. ICRA says Mundra volumes were disrupted in Q1 FY26. FY26 cargo of 500.8 million tonnes was below the 505–515 guided.
Watch Monthly cargo updates (51 million tonnes in Oct 2026, up 27% from a year earlier).
- Raw-material prices
Reliance on coal cargo
Coal was about 32% of FY26 cargo, CARE says. ICRA lists the shift away from carbon, and its effect on coal cargo, as a medium-to-long-term risk.
Watch Coal's share of cargo in rating reports and results slides.
- Governance
Deals with promoter-group companies
NQXT was bought from a promoter-group company for new shares. On 2 Feb 2026 shareholders voted on large related-party deals of the NQXT and Vizhinjam subsidiaries, including loans with related parties.
Watch Related-party resolutions at shareholder meetings and in the annual report.
- Execution
Large building programme
FY26 capex was ₹15,320 crore against guidance of ₹11,000–12,000 crore. On 28 Oct 2026 the company raised its FY27 capex guidance to ₹15,000–17,000 crore. ICRA lists project execution risk.
Watch Capex against guidance (₹10,521 crore in H1 FY27).
- Regulation
Vizhinjam stake sale approvals
TiL agreed on 29 Jun 2026 to invest US$1.397 billion for 49% of the Vizhinjam port company, subject to approvals. ICRA notes Kerala's government said its permission as concessionaire was not sought.
Watch Approval and completion of the Vizhinjam deal.
Risks that were resolved (2)
- US case against a non-executive director · resolved 10 Aug 2026: The SEC case ended in a final judgement by consent, without admitting the allegations, and a penalty was paid. The DOJ indictment was dismissed with prejudice. The company says the matter is concluded.
- SEBI show cause notices · resolved 18 Sep 2025: SEBI's order of 18 Sep 2025 found no non-compliance and closed the proceedings with no penalty or further directions, the company says.
Sources (14)
- Reg 30 disclosure, media release and presentation: agreement to acquire 100% of Evos B.V.
- Media release and results presentation Q4 FY26 and FY26
- Media release and results presentation Q2 and H1 FY27
- CARE Ratings press release: ratings reaffirmed (CARE AAA; Stable / CARE A1+)
- Integrated Annual Report FY24 (2023-24), incl. consolidated financial statements
- Integrated Annual Report FY26 (2025-26), incl. consolidated financial statements
- Q1 FY27 earnings call transcript (call 29 Jul 2026; link filed with NSE 3 Aug 2026)
- Q2 FY27 earnings call transcript (call 28 Oct 2026; link filed with NSE 2 Nov 2026)
- ICRA rating rationale: ratings reaffirmed ([ICRA]AAA (Stable) / [ICRA]A1+)
- Operational performance update for October 2026
- Media release: APSEZ acquires NQXT Australia (50 MTPA) via share issue to a related party
- Notice of EGM (2 Feb 2026): material related party transactions of Abbot Point Port Holdings and Adani Vizhinjam Port
- Unaudited financial results Q2 FY27 (quarter and half year to 30 Sep 2026), standalone and consolidated
- Reg 30 disclosure: share purchase and subscription agreement with Mundi (TiL) for 49% of Adani Vizhinjam Port
09Supporters and critics
What do supporters and critics point to?
What supporters point to
- Revenue grew every year from FY22 to FY26, from ₹17,119 crore to ₹38,736 crore; profit for shareholders rose from ₹4,886 crore to ₹12,806 crore.
- The company puts its FY26 share at 27.1% of all cargo and 45.5% of containers at Indian ports.
- Operating cash flow of ₹20,356 crore covered FY26 capex of ₹15,320 crore; free cash flow was positive every year from FY22 to FY26.
- ICRA and CARE reaffirmed AAA ratings in Jul 2026, and Fitch affirmed BBB- in Oct 2026.
- ICRA says Mundra's share of cargo fell to about 38% in FY2026 from 62% in FY2020.
What critics point to
- FY26 capex of ₹15,320 crore was above the company's ₹11,000–12,000 crore guidance.
- The €2.56 billion Evos deal is debt-funded; the company puts pro forma net debt at 2.76 times EBITDA, against a policy of up to 2.5 times.
- NQXT was bought from a promoter-group company for new shares, which lifted promoter holding to 68.02%.
- Free cash flow fell from ₹9,177 crore in FY25 to ₹5,036 crore in FY26.
- FY26 cargo of 500.8 million tonnes was below the company's 505–515 million tonne guidance.
10What to watch next
What should you watch next at Adani Ports?
Next event
Q3 FY27 results (date not announced; Q3 FY26 results came on 3 Feb 2026)
Date not announced yet.
Evos approvals
The €2.56 billion Evos deal needs regulatory approvals and a works council consultation. The company indicated completion within 15 months of 5 Nov 2026.
FY27 against guidance
Management guided FY27 revenue of ₹44,000–46,000 crore on 28 Oct 2026. H1 FY27 revenue was ₹22,161 crore.
Vizhinjam stake sale
TiL's US$1.397 billion investment for 49% of the Vizhinjam port awaits approvals. ICRA notes Kerala's government said its permission was not sought.
11Key facts
Key facts about Adani Ports
- What does Adani Ports do?
- Adani Ports and Special Economic Zone (APSEZ) has 16 ports and terminals in India by its own count (Sep 2026, including two Paradip berths awarded that month) and 4 abroad. It also runs container trains, trucking, warehouses, service vessels and port-side industrial land.
- How does Adani Ports make money?
- Adani Ports earns fees for handling cargo at its ports. By the company's own split, Indian ports brought in ₹25,755 crore of its ₹38,736 crore FY26 revenue and ₹18,849 crore of its ₹22,851 crore EBITDA.
- Who are Adani Ports' customers?
- Adani Ports serves shipping lines, freight forwarders and industrial, manufacturing and farm-produce businesses. No single customer brought in 10% or more of Adani Ports' FY26 revenue.
- How big is Adani Ports?
- In FY26 Adani Ports had revenue of ₹38,736 crore and profit for shareholders of ₹12,806 crore. Its ports handled 500.8 million tonnes of cargo, which the company puts at 27.1% of all cargo at Indian ports.
- Who owns Adani Ports?
- On 30 Sep 2026 the Adani family and promoter-group companies held 66.03% of Adani Ports, with none of those shares pledged. Foreign investors held 15.95%, Indian institutions 13.25% and other shareholders 4.77%. LIC held 6.43%.
- How much did Adani Ports earn in Q2 FY27?
- In Q2 FY27 (Jul–Sep 2026) Adani Ports had revenue of ₹11,340 crore, up 23.7% from a year earlier. Its profit for shareholders was ₹3,622 crore, up 16.5%.
- How much debt does Adani Ports have?
- On 30 Sep 2026 Adani Ports had borrowings of ₹57,717 crore, not counting lease liabilities, and ₹12,502 crore of cash and liquid investments. Net debt was ₹45,214 crore.
- Where does Adani Ports operate outside India?
- Adani Ports runs ports in Australia (NQXT), Sri Lanka (Colombo), Israel (Haifa) and Tanzania (Dar es Salaam). Revenue from outside India was 16.8% of Adani Ports' FY26 revenue.
- Does Adani Ports pay a dividend?
- Adani Ports' board recommended a dividend of ₹7.50 a share for FY26, up from ₹7 for FY25 and ₹6 for FY24.
Sources (11)
- Media release and results presentation Q2 and H1 FY27
- Reg 30 disclosure: Letter of Award for two dry bulk berths at Paradip Port
- Media release and results presentation Q4 FY26 and FY26
- Business Responsibility and Sustainability Report FY26
- Integrated Annual Report FY26 (2025-26), incl. consolidated financial statements
- Shareholding pattern Sep 2026 (XBRL)
- Unaudited financial results Q2 FY27 (quarter and half year to 30 Sep 2026), standalone and consolidated
- Consolidated results XBRL Q2 FY27 (integrated filing)
- Audited financial results Q4 FY26 and FY26 (to 31 Mar 2026), with board outcome (dividend, director, internal auditor)
- Integrated Annual Report FY25 (2024-25), incl. consolidated financial statements
- Integrated Annual Report FY24 (2023-24), incl. consolidated financial statements
Terms on this page
- Capital expenditure (capex)
- Credit rating
- EBITDA
- FII and DII holding
- Free cash flow
- Market capitalisation
- Net debt
- Net profit
- Operating margin
- Promoter holding
Each explains the term in plain English, with the same number from other companies on Cityfort.
Go deeper
More detail from the same filings. Open any section.
12What it sells
12What it sells
What does Adani Ports sell?
Ports in India
16 ports and terminals by the company's count, with 671 million tonnes a year of capacity (Sep 2026, including two Paradip berths of 18 million tonnes awarded that month); Mundra in Gujarat is the largest at 274. FY26 revenue ₹25,755 crore.
Ports abroad
NQXT in Australia, Colombo in Sri Lanka, Haifa in Israel and Dar es Salaam in Tanzania: 144 million tonnes of capacity. FY26 revenue ₹4,539 crore.
Logistics
Container trains, a trucking platform with over 40,000 trucks, 12 logistics parks and 3.1 million sq ft of warehouses. FY26 revenue ₹4,478 crore.
Marine services
138 vessels such as tugs and anchor-handling and supply vessels, serving other port operators, LNG terminals and oil and gas companies (Q2 FY27). FY26 revenue ₹2,681 crore.
Port land (SEZ)
Leases land in special economic zones next to its ports to industries. FY26 revenue ₹1,219 crore; the company calls this income episodic.
Think of it like this
A port works a bit like a toll road for ships: the company earns a charge on the cargo that passes through.
What it does
- Does: Loads, unloads and stores cargo such as containers, coal, fertiliser and crude oil
- Does: Runs container trains and trucks between its ports and inland hubs
- Does: Rents out warehouse and logistics-park space
- Does: Provides tugs and offshore supply vessels to other port operators
- Does: Leases land in special economic zones beside its ports
What it does not do
- Does not: It does not handle all of India's sea cargo: its share was 27.1% in FY26, by the company's count.
- Does not: It cannot set its own prices everywhere: CARE says three domestic terminals lack that freedom.
- Does not: It does not own the goods it handles; they belong to its customers.
- Does not: It is not the whole Adani Group: Adani Enterprises, for example, is a separate company.
13How the money flows
13How the money flows · FY26
How does money flow through Adani Ports?
Money in
- Revenue from operations₹38,736 cr
- Share of profit from part-owned companies (joint ventures)₹258 cr
- Other income (mostly interest and investment income)₹2,119 cr
The company
Adani Ports
₹41,113 cr came in
Money out
- Operating costs of ports, logistics and marine₹11,234 cr
- Employee costs₹2,354 cr
- Other running costs₹2,296 cr
- Depreciation and amortisation (wear and tear)₹5,517 cr
- Interest, hedging and currency costs, and one-off charges₹4,862 cr
- Income tax₹2,067 cr
- Net profit for Adani Ports shareholders₹12,806 cr
- In FY26 Adani Ports' businesses brought in ₹38,736 crore of revenue, plus ₹2,119 crore of other income.
- Part-owned companies added ₹258 crore as Adani Ports' share of their profit.
- Operating costs took ₹11,234 crore. Employees took ₹2,354 crore and other running costs ₹2,296 crore.
- Wear and tear of ports and vessels took ₹5,517 crore. Interest, hedging, currency and one-off costs took ₹4,862 crore, and income tax ₹2,067 crore.
- What was left for Adani Ports' shareholders was ₹12,806 crore of profit.
14What it needs to run
14What it needs to run
What does Adani Ports need to run?
Concessions to run ports
Ports run under long agreements with port owners. In Sep 2026 it won a 30-year concession for two Paradip berths; NQXT's lease runs to 2110.
Port capacity
671 million tonnes a year in India in Sep 2026: 355 on the west coast, 158 in the south and 158 on the east coast.
Trains, parks and vessels
132 trains and 12 logistics parks on 31 Mar 2026, CARE says, and 138 vessels in the marine business in Q2 FY27.
People
Its FY26 sustainability report counts 2,587 employees and 48,235 workers; only 882 of the workers are permanent.
Capital and borrowing
It spent ₹15,320 crore on new assets in FY26. About 79% of its debt in Mar 2026 was in foreign currency, CARE says.
Sources (6)
- Reg 30 disclosure: Letter of Award for two dry bulk berths at Paradip Port
- Media release: APSEZ acquires NQXT Australia (50 MTPA) via share issue to a related party
- Media release and results presentation Q2 and H1 FY27
- CARE Ratings press release: ratings reaffirmed (CARE AAA; Stable / CARE A1+)
- Business Responsibility and Sustainability Report FY26
- Integrated Annual Report FY26 (2025-26), incl. consolidated financial statements
15Where it sells
15Where it sells · FY26
Where does Adani Ports sell?
- India83.2%
- Outside India16.8%
16Where growth could come from
16Where growth could come from
Where could Adani Ports' growth come from?
Management said on 28 Oct 2026 that it expects FY27 revenue of ₹44,000–46,000 crore and EBITDA of ₹26,000–27,000 crore. On 30 Apr 2026 it had guided ₹43,000–45,000 crore and ₹25,000–26,000 crore. The company also targets 1 billion tonnes of domestic port capacity by FY31.
Ports abroad
WorkingRevenue +71%, Q2 FY27
Revenue from ports abroad rose from ₹1,077 crore in Q2 FY26 to ₹1,839 crore in Q2 FY27; EBITDA rose from ₹261 crore to ₹878 crore. NQXT has been included since Q4 FY26.
Status: Working, on track against what the company said.
Marine services
WorkingFY26 revenue ₹2,681 crore, +134%
Marine revenue rose from ₹1,144 crore in FY25. The fleet grew from 127 vessels in Q2 FY26 to 138 in Q2 FY27.
Status: Working, on track against what the company said.
Logistics
MixedFY26 revenue +55%, EBITDA margin 19.3%
Logistics revenue rose from ₹2,881 crore in FY25 to ₹4,478 crore in FY26. In Q2 FY27 revenue rose 21% but EBITDA only 8%.
Status: Mixed, partly on track.
More capacity in India
Early671 of 1,000 million tonnes, Sep 2026
The company targets 1 billion tonnes of domestic capacity by FY31. It won two Paradip berths (+18 million tonnes) in Sep 2026; CARE says Vizhinjam phase 2 is due by Dec 2028.
Status: Early, too early to judge.
Evos liquid storage in Europe
NewEnterprise value €2.56 billion, agreed 5 Nov 2026
Evos runs 8 storage terminals in 5 countries. It had CY25 revenue of €392 million and EBITDA of €219 million, the company said. The deal awaits approvals.
Status: New, recently announced.
Status compares progress with what the company itself said it would do: Working = on track against what the company said; Mixed = partly on track; Behind = behind the company's own plan; New = recently announced; Early = too early to judge.
Sources (7)
- Media release and results presentation Q2 and H1 FY27
- Media release and results presentation Q4 FY26 and FY26
- Q2 FY27 earnings call transcript (call 28 Oct 2026; link filed with NSE 2 Nov 2026)
- Unaudited financial results Q2 FY27 (quarter and half year to 30 Sep 2026), standalone and consolidated
- Reg 30 disclosure: Letter of Award for two dry bulk berths at Paradip Port
- CARE Ratings press release: ratings reaffirmed (CARE AAA; Stable / CARE A1+)
- Reg 30 disclosure, media release and presentation: agreement to acquire 100% of Evos B.V.
17Financial strength and debt
17Financial strength · 30 Sep 2026
How much debt does Adani Ports have?
- Total debt₹57,717 cr
- Cash and investments₹12,502 cr
- Net debt (debt minus cash)₹45,214 cr
- Net worth (shareholders' money)₹102,240 cr
- Debt to equity
- 0.56×
- ₹ of debt for every ₹1 of shareholders' money
- Interest cover
- 6×
- how many times operating profit covers interest
- Borrowings leave out lease liabilities of ₹8,282 crore, as the company's own 'gross debt' does. ICRA, which counts leases, put gross debt at ₹63,399 crore on 31 Mar 2026.
- Borrowings rose from ₹45,810 crore in Mar 2025 to ₹55,103 crore in Mar 2026; ICRA says mainly because NQXT's debt was added.
- Cash and investments = cash, other bank balances, current investments and bank deposits longer than 12 months.
- The company reported net debt of 1.8 times its last 12 months' EBITDA in H1 FY27. Its stated policy is up to 2.5 times.
- Interest coverage = FY26 EBITDA ÷ interest and bank charges of ₹3,833 crore, about 6 times; CARE also puts it at about 6 times.
- About 79% of debt was in foreign currency and about 72% at fixed rates in Mar 2026, CARE says. Average maturity was 5.4 years, the company says.
- Net worth is equity of Adani Ports' shareholders. It rose by ₹21,481 crore in FY26 from the shares issued to buy NQXT.
Sources (7)
- Unaudited financial results Q2 FY27 (quarter and half year to 30 Sep 2026), standalone and consolidated
- Integrated Annual Report FY26 (2025-26), incl. consolidated financial statements
- Audited financial results Q4 FY26 and FY26 (to 31 Mar 2026), with board outcome (dividend, director, internal auditor)
- Media release and results presentation Q2 and H1 FY27
- Media release and results presentation Q4 FY26 and FY26
- ICRA rating rationale: ratings reaffirmed ([ICRA]AAA (Stable) / [ICRA]A1+)
- CARE Ratings press release: ratings reaffirmed (CARE AAA; Stable / CARE A1+)
18Who owns it
18Who owns it · Q2 FY27
Who owns Adani Ports?
- Promoters (founders or parent company)66.0%
- Foreign institutions (FII)16.0%
- Indian institutions (DII)13.3%
- Public and others4.8%
Promoter pledge
No promoter shares were pledged in Q2 FY27.
How ownership changed
* Pledged = share of the promoters' own holding reported as pledged. In older filings this can include shares “otherwise encumbered”; the governance flags say when.
Sources (13)
- Shareholding pattern Sep 2026 (XBRL)
- Shareholding pattern Jun 2026 (XBRL)
- Shareholding pattern Mar 2026 (XBRL)
- Shareholding pattern Dec 2025 (XBRL)
- Shareholding pattern 23 Dec 2025 (after NQXT share allotment) (XBRL)
- Shareholding pattern Sep 2025 (XBRL)
- Shareholding pattern Jun 2025 (XBRL)
- Shareholding pattern Mar 2025 (XBRL)
- Shareholding pattern Dec 2024 (XBRL)
- Shareholding pattern Sep 2024 (XBRL)
- Shareholding pattern Jun 2024 (XBRL)
- Shareholding pattern Mar 2024 (XBRL)
- Shareholding pattern Dec 2023 (XBRL)
19What it does with profit
19What it does with profit
What does Adani Ports do with its profit?
Dividend per share
₹7.50FY26
Dividend paid for each share, by financial year.
₹ per share
See the numbers
Money raised · 23 Dec 2025
Issued 14.38 crore new shares to Carmichael Rail and Port Singapore Holdings, a promoter-group company, as payment for NQXT in Australia. Shareholders' equity rose by ₹21,481 crore.
₹21,481 cr
Sources (7)
- Integrated Annual Report FY24 (2023-24), incl. consolidated financial statements
- Integrated Annual Report FY25 (2024-25), incl. consolidated financial statements
- Audited financial results Q4 FY26 and FY26 (to 31 Mar 2026), with board outcome (dividend, director, internal auditor)
- Media release and results presentation Q4 FY26 and FY26
- Unaudited financial results Q2 FY27 (quarter and half year to 30 Sep 2026), standalone and consolidated
- Integrated Annual Report FY26 (2025-26), incl. consolidated financial statements
- Shareholding pattern 23 Dec 2025 (after NQXT share allotment) (XBRL)
20Governance signals
20Governance signals
What do Adani Ports' governance filings show?
- Auditor
- M S K A & Associates LLP, since 2023
- Auditor changes
- 12 Aug 2023: Deloitte Haskins & Sells LLP → M S K A & Associates LLP (Deloitte resigned, causing a casual vacancy, the FY24 annual report says; the report gives no reason.)
- Audit qualifications
- None reported
- Related-party dealings
- Adani Ports bought NQXT from Carmichael Rail and Port Singapore Holdings, a promoter-group company it calls a related party. It paid in 14.38 crore new shares, at an enterprise value of A$3,975 million. On 2 Feb 2026 an EGM voted on large related-party deals of the NQXT and Vizhinjam subsidiaries. The Jaypee Fertilizers purchase, under Adani Enterprises' resolution plan, was filed as not a related-party transaction.
- Credit rating
- ICRA [ICRA]AAA (long term), [ICRA]A1+ (short term) (outlook Stable), 15 Jul 2026
A credit rating describes the company's ability to repay debt. It is not a rating of the share.
Flags to know about
auditor · 12 Aug 2023
Auditor resigned in 2023
Deloitte Haskins & Sells LLP resigned as statutory auditor with effect from 12 Aug 2023. M S K A & Associates was appointed; its first five-year term runs to the 2029 AGM.
regulatory · 18 Sep 2025
SEBI closed two show cause notices
A 2023 short-seller report made allegations about Adani Group companies, including Adani Ports. SEBI ruled on two show cause notices on 18 Sep 2025. It found no non-compliance on related-party rules and closed the proceedings with no penalty, the company says.
regulatory · 10 Aug 2026
US case against a non-executive director
The US DOJ and SEC filed cases against a non-executive director; the company was not named. On 10 Aug 2026 the SEC case ended in a consent judgement, without admitting the allegations, and a penalty was paid. The DOJ indictment was dismissed with prejudice.
related party · 23 Dec 2025
Australian port bought from the promoter group
NQXT was bought from a promoter-group company for 14.38 crore new shares, allotted on 23 Dec 2025. Promoter holding rose from 65.89% to 68.02%.
disclosure · 30 Jun 2026
Promoter-group holding fell by 1.99% of shares
Worldwide Emerging Market Holding, a promoter-group company, held 86,092,798 shares in Mar 2026 and 40,234,093 in Jun 2026. The filings collected do not give a reason.
Sources (12)
- Integrated Annual Report FY24 (2023-24), incl. consolidated financial statements
- Integrated Annual Report FY26 (2025-26), incl. consolidated financial statements
- Media release: APSEZ acquires NQXT Australia (50 MTPA) via share issue to a related party
- Unaudited financial results Q2 FY27 (quarter and half year to 30 Sep 2026), standalone and consolidated
- Notice of EGM (2 Feb 2026): material related party transactions of Abbot Point Port Holdings and Adani Vizhinjam Port
- Reg 30 disclosure: acquisition of Jaypee Fertilizers & Industries Ltd
- ICRA rating rationale: ratings reaffirmed ([ICRA]AAA (Stable) / [ICRA]A1+)
- Intimation of receipt of SEBI order dated 18 Sep 2025 (show cause notices disposed)
- Audited financial results Q4 FY26 and FY26 (to 31 Mar 2026), with board outcome (dividend, director, internal auditor)
- Shareholding pattern 23 Dec 2025 (after NQXT share allotment) (XBRL)
- Shareholding pattern Mar 2026 (XBRL)
- Shareholding pattern Jun 2026 (XBRL)
21What the market paid
21What the market paid · price as of 11 Nov 2026
What did the market pay for Adani Ports on 11 Nov 2026?
Price as of 11 Nov 2026 (shown for education; prices change daily).
Price as of 11 Nov 2026: ₹1,907.00, the NSE closing price. Market value = that price × 230.40 crore shares = ₹439,365 crore. P/E of 32.2 divides market value by profit for shareholders in the four quarters to Sep 2026 (₹13,625 crore). P/B of 4.30 divides it by shareholders' equity of ₹102,240 crore on 30 Sep 2026. The FY26 dividend of ₹7.50 a share was 0.39% of that price.
- Share price
- ₹1,907.00
- Market value (market cap)
- ₹439,365 cr
- P/E
- 32.2×
- P/B
- 4.3×
Source: NSE historical price data, ADANIPORTS (EQ), 2-11 Nov 2026; Shareholding pattern Sep 2026 (XBRL); Unaudited financial results Q2 FY27 (quarter and half year to 30 Sep 2026), standalone and consolidated and 1 more
Sources (4)
- NSE historical price data, ADANIPORTS (EQ), 2-11 Nov 2026
- Shareholding pattern Sep 2026 (XBRL)
- Unaudited financial results Q2 FY27 (quarter and half year to 30 Sep 2026), standalone and consolidated
- Audited financial results Q4 FY26 and FY26 (to 31 Mar 2026), with board outcome (dividend, director, internal auditor)
22How it got here
22How it got here
How did Adani Ports get here?
1998
Milestone
Incorporated in Gujarat
The company was incorporated in 1998 and is registered in Ahmedabad; Mundra is its largest port.
2022
Milestone
Gangavaram Port scheme approved
The NCLT approved a scheme for Gangavaram Port in Sep–Oct 2022, the FY23 annual report says. That report also restated FY22 figures.
2023
Crisis
Short-seller report and auditor change
A short-seller report made allegations about Adani Group companies. Deloitte resigned as auditor in Aug 2023.
2024
Milestone
Sold 49% of Ennore terminal
It sold 49% of the Ennore container terminal to Mundi, a TiL group company, booking a ₹603 crore gain in Q1 FY25.
2025
Business-model change
Bought NQXT in Australia
It bought the 50 million-tonne NQXT terminal from a promoter-group company, paying in new shares issued on 23 Dec 2025.
2026
Milestone
Bought Jaypee Fertilizers
It paid ₹1,500 crore in cash on 21 May 2026, gaining about 243 acres in Kanpur for a logistics park.
2026
Milestone
TiL to take 49% of Vizhinjam
TiL agreed on 29 Jun 2026 to invest US$1.397 billion for 49% of the Vizhinjam port; approvals pending.
2026
Business-model change
Agreed to buy Evos
On 5 Nov 2026 it agreed to buy Evos, with 8 liquid-storage terminals in Europe, for an enterprise value of €2.56 billion.
Sources (12)
- Business Responsibility and Sustainability Report FY26
- Media release and results presentation Q2 and H1 FY27
- Integrated Annual Report FY23 (2022-23), incl. consolidated financial statements
- Integrated Annual Report FY24 (2023-24), incl. consolidated financial statements
- Audited financial results Q4 FY26 and FY26 (to 31 Mar 2026), with board outcome (dividend, director, internal auditor)
- Integrated Annual Report FY25 (2024-25), incl. consolidated financial statements
- Unaudited financial results Q1 FY26 (quarter to 30 Jun 2025), consolidated
- Media release: APSEZ acquires NQXT Australia (50 MTPA) via share issue to a related party
- Unaudited financial results Q2 FY27 (quarter and half year to 30 Sep 2026), standalone and consolidated
- Reg 30 disclosure: acquisition of Jaypee Fertilizers & Industries Ltd
- Reg 30 disclosure: share purchase and subscription agreement with Mundi (TiL) for 49% of Adani Vizhinjam Port
- Reg 30 disclosure, media release and presentation: agreement to acquire 100% of Evos B.V.
23Sources and changes
Where every number on this page comes from
Sources (48 documents)
- S1Integrated Annual Report FY26 (2025-26), incl. consolidated financial statements · NSE (company filing, nsearchives.nseindia.com) · Tier 1: company or exchange filing · 29 May 2026
- S2Integrated Annual Report FY25 (2024-25), incl. consolidated financial statements · NSE (company filing, nsearchives.nseindia.com) · Tier 1: company or exchange filing · 30 May 2025
- S3Integrated Annual Report FY24 (2023-24), incl. consolidated financial statements · NSE (company filing, nsearchives.nseindia.com) · Tier 1: company or exchange filing · 28 May 2024
- S4Integrated Annual Report FY23 (2022-23), incl. consolidated financial statements · NSE (company filing, nsearchives.nseindia.com) · Tier 1: company or exchange filing · 17 Jul 2023
- S5Unaudited financial results Q2 FY27 (quarter and half year to 30 Sep 2026), standalone and consolidated · NSE (company filing, nsearchives.nseindia.com) · Tier 1: company or exchange filing · 28 Oct 2026
- S6Audited financial results Q4 FY26 and FY26 (to 31 Mar 2026), with board outcome (dividend, director, internal auditor) · NSE (company filing, nsearchives.nseindia.com) · Tier 1: company or exchange filing · 30 Apr 2026
- S7Unaudited financial results Q1 FY26 (quarter to 30 Jun 2025), consolidated · NSE (company filing, nsearchives.nseindia.com) · Tier 1: company or exchange filing · 5 Aug 2025
- S8Consolidated results XBRL Q2 FY27 (integrated filing) · NSE (XBRL) · Tier 1: company or exchange filing · 28 Oct 2026
- S9Consolidated results XBRL Q1 FY27 (integrated filing, revision) · NSE (XBRL) · Tier 1: company or exchange filing · 29 Jul 2026
- S10Consolidated results XBRL Q4 FY26 (integrated filing) · NSE (XBRL) · Tier 1: company or exchange filing · 30 Apr 2026
- S11Consolidated results XBRL Q3 FY26 (integrated filing) · NSE (XBRL) · Tier 1: company or exchange filing · 3 Feb 2026
- S12Consolidated results XBRL Q2 FY26 (integrated filing) · NSE (XBRL) · Tier 1: company or exchange filing · 4 Nov 2025
- S13Consolidated results XBRL Q1 FY26 (integrated filing) · NSE (XBRL) · Tier 1: company or exchange filing · 5 Aug 2025
- S14Consolidated results XBRL Q4 FY25 (integrated filing) · NSE (XBRL) · Tier 1: company or exchange filing · 1 May 2025
- S15Consolidated results XBRL Q3 FY25 · NSE (XBRL) · Tier 1: company or exchange filing · 30 Jan 2025
- S16Consolidated results XBRL Q2 FY25 · NSE (XBRL) · Tier 1: company or exchange filing · 29 Oct 2024
- S17Consolidated results XBRL Q1 FY25 · NSE (XBRL) · Tier 1: company or exchange filing · 1 Aug 2024
- S19Media release and results presentation Q2 and H1 FY27 · NSE (company filing, nsearchives.nseindia.com) · Tier 1: company or exchange filing · 28 Oct 2026
- S21Media release and results presentation Q4 FY26 and FY26 · NSE (company filing, nsearchives.nseindia.com) · Tier 1: company or exchange filing · 30 Apr 2026
- S22Q2 FY27 earnings call transcript (call 28 Oct 2026; link filed with NSE 2 Nov 2026) · Adani Ports (company website) · Tier 1: company or exchange filing · 2 Nov 2026
- S23Q1 FY27 earnings call transcript (call 29 Jul 2026; link filed with NSE 3 Aug 2026) · Adani Ports (company website) · Tier 1: company or exchange filing · 3 Aug 2026
- S25Q3 FY26 earnings call transcript (call 3 Feb 2026; link filed with NSE 9 Feb 2026) · Adani Ports (company website) · Tier 1: company or exchange filing · 9 Feb 2026
- S26Shareholding pattern Sep 2026 (XBRL) · NSE (XBRL) · Tier 1: company or exchange filing · 10 Oct 2026
- S27Shareholding pattern Jun 2026 (XBRL) · NSE (XBRL) · Tier 1: company or exchange filing · 10 Jul 2026
- S28Shareholding pattern Mar 2026 (XBRL) · NSE (XBRL) · Tier 1: company or exchange filing · 10 Apr 2026
- S29Shareholding pattern Dec 2025 (XBRL) · NSE (XBRL) · Tier 1: company or exchange filing · 11 Jan 2026
- S30Shareholding pattern 23 Dec 2025 (after NQXT share allotment) (XBRL) · NSE (XBRL) · Tier 1: company or exchange filing · 24 Dec 2025
- S31Shareholding pattern Sep 2025 (XBRL) · NSE (XBRL) · Tier 1: company or exchange filing · 10 Oct 2025
- S32Shareholding pattern Jun 2025 (XBRL) · NSE (XBRL) · Tier 1: company or exchange filing · 21 Jul 2025
- S33Shareholding pattern Mar 2025 (XBRL) · NSE (XBRL) · Tier 1: company or exchange filing · 10 Apr 2025
- S34Shareholding pattern Dec 2024 (XBRL) · NSE (XBRL) · Tier 1: company or exchange filing · 10 Jan 2025
- S35Shareholding pattern Sep 2024 (XBRL) · NSE (XBRL) · Tier 1: company or exchange filing · 10 Oct 2024
- S36Shareholding pattern Jun 2024 (XBRL) · NSE (XBRL) · Tier 1: company or exchange filing · 13 Jul 2024
- S37Shareholding pattern Mar 2024 (XBRL) · NSE (XBRL) · Tier 1: company or exchange filing · 11 Apr 2024
- S38Shareholding pattern Dec 2023 (XBRL) · NSE (XBRL) · Tier 1: company or exchange filing · 9 Jan 2024
- S39ICRA rating rationale: ratings reaffirmed ([ICRA]AAA (Stable) / [ICRA]A1+) · ICRA Limited · Tier 2: rating agency or regulator · 15 Jul 2026
- S40CARE Ratings press release: ratings reaffirmed (CARE AAA; Stable / CARE A1+) · CARE Ratings Limited · Tier 2: rating agency or regulator · 3 Jul 2026
- S42Business Responsibility and Sustainability Report FY26 · NSE (company filing, nsearchives.nseindia.com) · Tier 1: company or exchange filing · 29 May 2026
- S43Reg 30 disclosure, media release and presentation: agreement to acquire 100% of Evos B.V. · NSE (company filing, nsearchives.nseindia.com) · Tier 1: company or exchange filing · 5 Nov 2026
- S44Media release: APSEZ acquires NQXT Australia (50 MTPA) via share issue to a related party · NSE (company filing, nsearchives.nseindia.com) · Tier 1: company or exchange filing · 17 Apr 2025
- S45Reg 30 disclosure: acquisition of Jaypee Fertilizers & Industries Ltd · NSE (company filing, nsearchives.nseindia.com) · Tier 1: company or exchange filing · 21 May 2026
- S46Reg 30 disclosure: share purchase and subscription agreement with Mundi (TiL) for 49% of Adani Vizhinjam Port · NSE (company filing, nsearchives.nseindia.com) · Tier 1: company or exchange filing · 30 Jun 2026
- S47Intimation of receipt of SEBI order dated 18 Sep 2025 (show cause notices disposed) · NSE (company filing, nsearchives.nseindia.com) · Tier 1: company or exchange filing · 19 Sep 2025
- S48Board outcome 3 Feb 2026: Q3 FY26 results and change of CFO · NSE (company filing, nsearchives.nseindia.com) · Tier 1: company or exchange filing · 3 Feb 2026
- S49Reg 30 disclosure: Letter of Award for two dry bulk berths at Paradip Port · NSE (company filing, nsearchives.nseindia.com) · Tier 1: company or exchange filing · 9 Sep 2026
- S50Notice of EGM (2 Feb 2026): material related party transactions of Abbot Point Port Holdings and Adani Vizhinjam Port · NSE (company filing, nsearchives.nseindia.com) · Tier 1: company or exchange filing · 10 Jan 2026
- S51Operational performance update for October 2026 · NSE (company filing, nsearchives.nseindia.com) · Tier 1: company or exchange filing · 2 Nov 2026
- S52NSE historical price data, ADANIPORTS (EQ), 2-11 Nov 2026 · NSE · Tier 1: company or exchange filing · 11 Nov 2026
Changes to this page (v1 · 11 Nov 2026)
- v1 · 11 Nov 2026First version. (first version)
Numbers come only from tier 1 and tier 2 sources. Read how we research.
Disclaimer
For learning only. Cityfort is not a SEBI-registered adviser and does not recommend buying or selling any security. Prices shown are dated and may be out of date.
Investing in securities involves risk, including loss of capital. Before making any investment decision, do your own research and consider consulting a SEBI-registered investment adviser.
Cityfort, its owners and contributors may or may not hold securities of companies covered. Content is not an offer or solicitation to buy or sell any security.
Read the full disclaimerHide the full disclaimer
Cityfort publishes educational content that explains how listed companies work. Cityfort is not registered with the Securities and Exchange Board of India (SEBI) as an Investment Adviser or Research Analyst and does not provide investment advice, recommendations, ratings, price targets or any opinion on whether to buy, sell or hold any security.
All information is taken from publicly available sources, mainly company filings on BSE and NSE, which are listed on each page with dates. We work to keep it accurate and correct errors publicly, but we do not guarantee that it is complete, accurate or up to date. Any market price or price-based ratio shown is dated, may be out of date by the time you read it, and is included only to explain concepts.
Statements by company management are reported as statements, with their date and source; they are not our forecasts.