Financial Services · NSE: HDBFS · BSE: 544429
HDB Financial Services: how the business works
HDB Financial Services, a non-bank lender 74.08% owned by HDFC Bank, lends to small businesses, vehicle buyers and households through 1,701 branches, and earned ₹2,544 crore of profit in FY26.
Follow HDB Financial Services
Email me when HDB Financial Services's page is updated after results.
We store your email address with Kit, our email provider, which also records when you sign up and whether you open or click our emails. We send a confirmation email first. See our privacy policy.
HDB Financial Services Limited · Mumbai, Maharashtra (registered office in Ahmedabad, Gujarat) · Founded 2007
Updated for Q2 FY27 · checked
- Total income, FY26
- ₹18,430 cr
- Profit, FY26
- ₹2,544 cr
- Gross loans, 30 Sep 2026
- ₹124,469 cr
- Customers, 30 Sep 2026
- 24.8 million
- Promoter (HDFC Bank) holding, Sep 2026
- 74.08%
The short version
HDB Financial Services in 5 points
1 · What it sells
HDB Financial Services lends to small businesses, buyers of vehicles and equipment, and households, and its gross loans were ₹124,469 crore at 30 Sep 2026.
2 · Who pays it
Borrowers pay HDB Financial Services interest, and at 30 Sep 2026 enterprise loans were 37.6% of its gross loans, asset finance 36.6% and consumer finance 25.8%, while HDFC Bank paid it ₹1,224 crore in FY26 for BPO work.
3 · What it keeps from ₹100
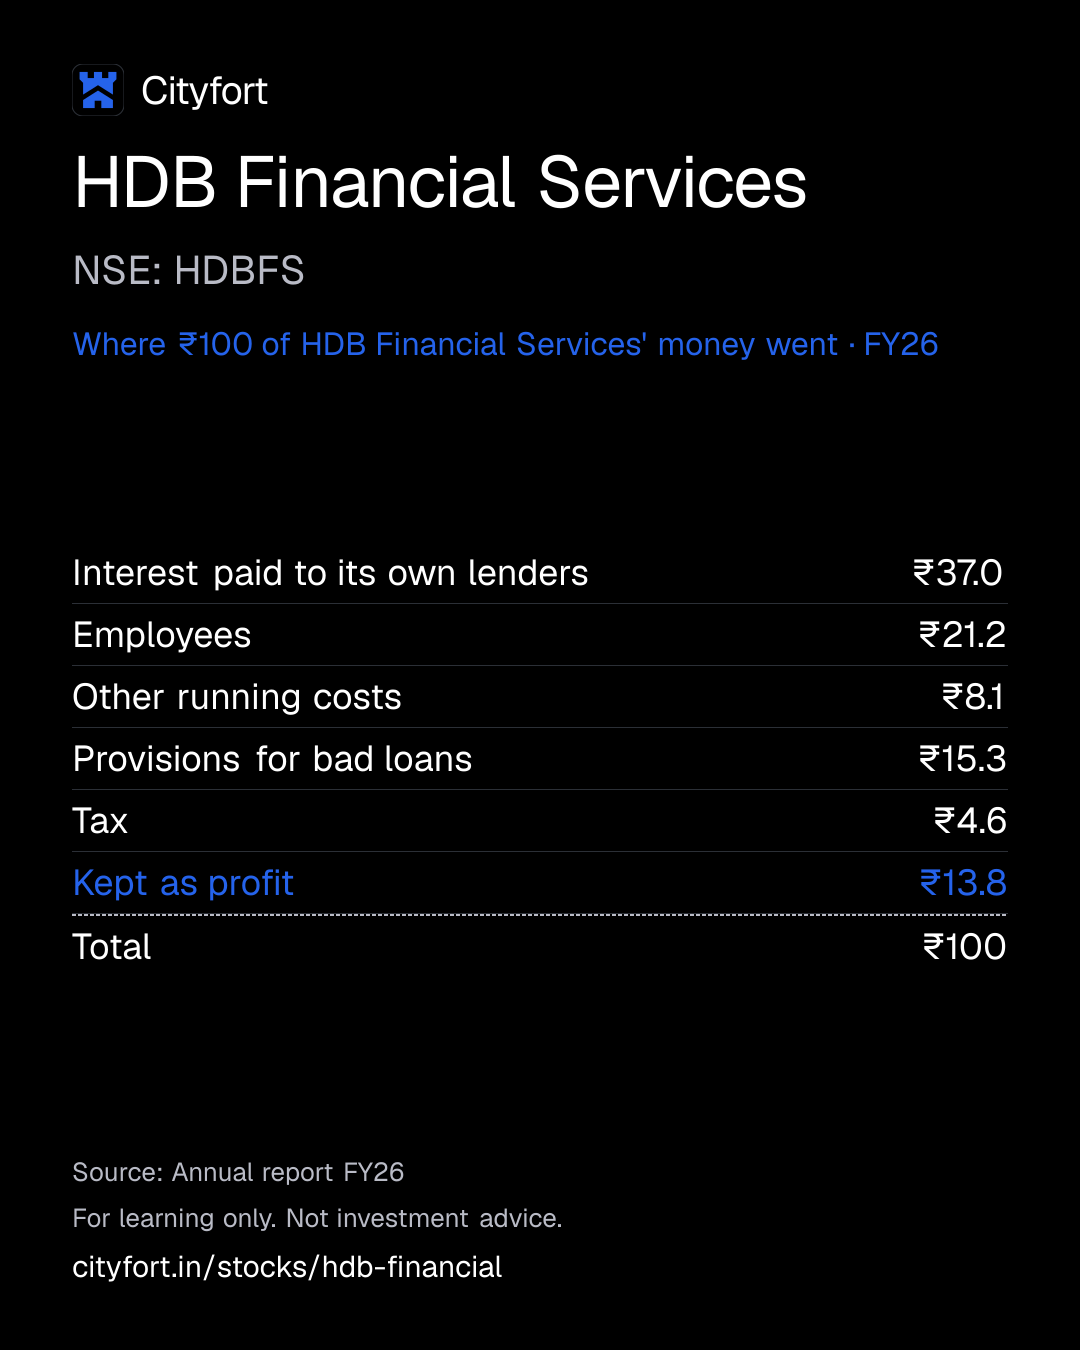
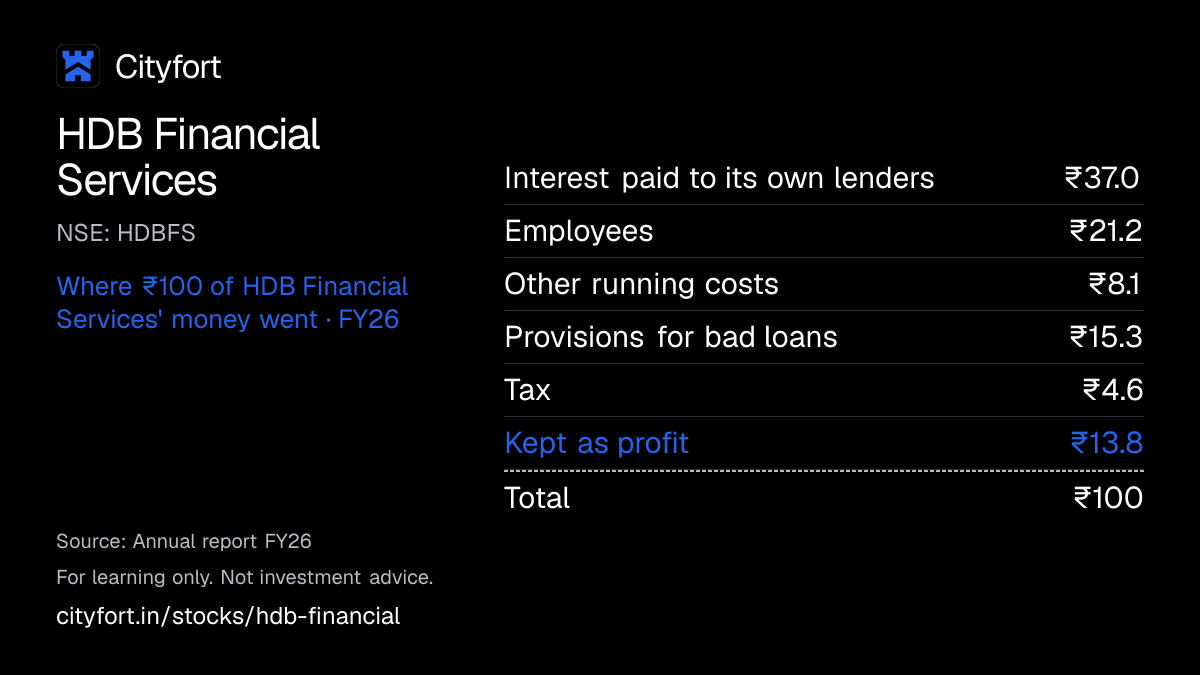
Of every ₹100 that came in to HDB Financial Services during FY26, it kept ₹13.8 as profit after ₹37 of interest to its own lenders and ₹15.3 set aside for bad loans, and the year included a one-time ₹61 crore labour-code charge.
4 · Where the operating profit comes from
HDB Financial Services' profit comes mainly from lending, which made ₹3,364 crore of profit before tax in FY26, against ₹81 crore from its BPO work for HDFC Bank and ₹59 crore of costs not allocated to either.
5 · The one thing to watch
HDB Financial Services' credit cost was 2.37% of average loans in Q2 FY27, and CFO Jaykumar Shah said on 14 Oct 2026 that the company wants to manage it "in the range of 2.3% +/-" in the medium term.
Sources: From HDB Financial Services' FY26 annual report, its Q4 FY26 and Q2 FY27 investor presentations and the Q2 FY27 earnings call · checked
01Where the money goes · FY26
Where does ₹100 of HDB Financial Services' money go?
HDB Financial Services · FY26
Receipt for every ₹100
| Interest paid to its own lenders | ₹37.0 |
|---|---|
| Employees | ₹21.2 |
| Other running costs | ₹8.1 |
| Provisions for bad loans | ₹15.3 |
| Tax | ₹4.6 |
| Kept as profit | ₹13.8 |
| Total | ₹100 |
Each line = amount ÷ total money in × 100. Lines may not add to exactly ₹100 because of rounding.
How this is worked out
Of every ₹100 that came in to HDB Financial Services in FY26. Cityfort calculation from the FY26 annual report (S1): each line ÷ revenue from operations of ₹18,430 crore × 100 (there was no other income). Lines add to ₹100.
Save this receipt as an image
Embed this receipt or the key numbers
Paste this code into a blog or website to show the card you choose, with a link back to this page.
Each week: the next company due to report results, explained in 5 points.
We'll email you once a week with what changed on Cityfort. Facts only, no tips. Unsubscribe any time.
We store your email address with Kit, our email provider, which also records when you sign up and whether you open or click our emails. We send a confirmation email first. See our privacy policy.
02The business in one line
What does HDB Financial Services do?
Borrowers pay HDB Financial Services interest on small loans and HDFC Bank pays it for back-office and collection work; most of that money goes on interest to its own lenders, staff and provisions for bad loans, and what's left is profit.
- In FY26 borrowers paid ₹15,788 crore of interest and ₹1,417 crore of fees and charges. HDFC Bank paid ₹1,224 crore for BPO work.
- Interest paid to its own lenders took ₹6,820 crore and provisions for bad loans ₹2,815 crore. ₹2,544 crore was left as profit.
03Who pays it
Who pays HDB Financial Services?
Self-employed people, small businesses and salaried borrowers
Share of revenue not disclosed
Pay interest on loans against property, business loans, salaried personal loans and gold loans: 37.6% of gross loans at 30 Sep 2026.
Vehicle and equipment buyers
Share of revenue not disclosed
Pay interest on commercial vehicle, construction equipment and tractor loans: 36.6% of gross loans, down from 38.0% at 31 Mar 2025.
Households
Share of revenue not disclosed
Pay interest on car, two-wheeler, appliance and personal loans: 25.8% of gross loans, up from 22.7% at 31 Mar 2025.
HDFC Bank
6.6%
of revenue
Pays fees for sales-support, collection and back-office work: ₹1,224 crore in FY26, 6.6% of revenue, as the annual report states.
How spread out the customers are
HDB Financial Services does not disclose income by borrower. Its top 20 borrowers were about 0.33% of loans at 30 Sep 2026. The borrower shares above are of gross loans, not of income.
04How it makes money
How does HDB Financial Services make money?
A lender earns the gap between the interest it charges and the interest it pays, less bad loans
HDB borrows from banks and bond markets and lends in small amounts at higher rates; its net interest margin was 7.96% of average loans in FY26. Staff and bad loans take most of that gap. When credit cost rose from 1.3% of average loans in FY24 to 2.1% in FY25, profit fell from ₹2,461 crore to ₹2,176 crore.
Provisions for bad loans per ₹100 of average loans (credit cost)
₹1.3₹2.5
FY24 to FY26
- Branches and dealer counters in small towns bring in borrowers
- Loans are small, about ₹160,000 on average, and the top 20 borrowers were about 0.33% of loans
- An AAA rating lets it borrow from banks and bond markets
- The gap between interest earned and paid covers staff and bad loans
- Existing customers are offered more loans, such as personal loans
- Profit adds to capital, which supports more lending
↺ Step 6 feeds back into step 1.
05Business segments · FY26
Which businesses make up HDB Financial Services?
Lending
93.4%Interest, fees, charges and insurance commission from its loans. Its profit before tax was ₹3,364 crore in FY26; ₹59 crore of costs was not allocated to either segment.
Revenue ₹17,206 cr · Operating profit ₹3,364 cr
BPO services
6.6%Sales-support, collection and back-office work, all for HDFC Bank. It made ₹81 crore of profit before tax on ₹1,224 crore of revenue in FY26.
Revenue ₹1,224 cr · Operating profit ₹81.2 cr
How the mix changed
- Lending
- BPO services
Revenue by segment, FY22 to FY26.
₹ crore
See the numbers
06The numbers · Standalone · ₹ crore
How has HDB Financial Services done?
Net interest income
₹8,968 crFY26
Net interest income (interest earned minus interest paid) rose every year, from ₹5,037 crore in FY22 to ₹8,968 crore in FY26.
₹ crore · interest earned minus interest paid
See the yearly numbers
See the quarterly numbers
Net profit
₹2,544 crFY26
Profit rose from ₹1,011 crore in FY22, when provisions took 4.0% of average loans, to ₹2,461 crore in FY24, fell to ₹2,176 crore in FY25 and was ₹2,544 crore in FY26.
₹ crore
See the yearly numbers
See the quarterly numbers
Net interest margin
7.96%FY26
Net interest margin (NIM: lending NII as a share of average gross loans, as the company reports it) was 8.25% in FY23, 7.56% in FY25 and 7.96% in FY26; FY22 is not disclosed.
% · as reported by the company
See the numbers
Bad loans (gross NPA)
2.44%FY26
Gross stage 3 loans (loans in default, which the company says are the same as its gross NPA) were 4.99% of gross loans in FY22, 1.90% in FY24 and 2.43% at 30 Sep 2026.
% of loans · gross and net (after provisions) non-performing assets
See the yearly numbers
See the quarterly numbers
See all yearly numbers
EPS is basic EPS as reported, per ₹10 share. Q2 FY26 EPS (₹7.01) is below Q1 FY26 (₹7.13) on higher profit because the IPO added 33,783,782 new shares.
Net interest income = interest earned on loans and investments minus interest paid on deposits and borrowings. Provisions = money set aside for loans that may not be repaid. Financial year runs April to March.
- Figures are for HDB Financial Services alone (standalone); it has no subsidiaries. The RHP calls its restated figures consolidated because they include structured entities it used to control; for FY23–FY25 they match the audited annual reports.
- Interest earned, interest paid and provisions are from the profit and loss account. Other income is all revenue other than interest: fees, charges, insurance commission, gains and BPO fees from HDFC Bank (₹2,641 crore in FY26). Operating expenses include BPO staff and costs (₹5,408 crore in FY26). This is the basis of the 'Total' column in the FY26 segment profit and loss table of the company's Q4 FY26 presentation, and operating profit minus provisions equals profit before tax (₹3,386 crore in FY26).
- Cost-to-income is a Cityfort calculation from the annual reports: operating expenses ÷ (net interest income + other income), BPO included. The company reports a lending-only figure: 42.84% for FY25 and 41.1% for FY26.
- NIM is the company's lending net interest income ÷ average gross loans. FY22 NIM is not disclosed in any document collected for this page, so none is shown.
- FY22 gross NPA (4.99%), net NPA (2.29%), ROA (1.62%) and ROE (11.25%) are as the company states them in the FY26 annual report. FY22 provision cover (54.13%) is a Cityfort calculation from stage 3 figures in the FY22 annual report; the company's presentation rounds it to 54.1%.
- NBFCs report no CET1 ratio. Tier I capital was 15.22% in FY22, 15.91% in FY23, 14.12% in FY24, 14.67% in FY25, 17.06% in FY26 and 17.36% at 30 Sep 2026.
- HDB does not take deposits, so deposits and CASA do not apply. Loans are net loans on the balance sheet; gross loans were ₹118,493 crore at 31 Mar 2026 and ₹124,469 crore at 30 Sep 2026.
- Quarterly NII is a Cityfort calculation from each quarter's results: interest income − finance cost. Q3 FY25 and Q4 FY25 come from results filed before the shares listed, when only the company's bonds were listed.
- One-off item: Q3 FY26 includes a one-time ₹61 crore charge for the new labour codes (₹56 crore lending, ₹5 crore BPO). The company says profit excluding it was ₹686 crore, against ₹644 crore reported.
- Borrowings at 31 Mar 2025 (₹89,682 crore) are as restated in the FY26 annual report, which adds accrued interest to each borrowing line; the FY25 annual report showed ₹87,398 crore.
Sources (20)
- Annual Report FY22 (15th, 2021-22)
- Annual Report FY26 (19th, 2025-26), incl. standalone financial statements and BRSR
- Q2 FY27 earnings presentation (14 Oct 2026)
- Red Herring Prospectus dated 19 Jun 2025 (IPO), incl. Restated Financial Information FY23-FY25
- Q4 FY26 earnings presentation (15 Apr 2026)
- Audited results Q4 FY26 and FY26, revised filing 15 Apr 2026 (cash-flow footnote correction only)
- Audited results Q4 FY25 and FY25 (Reg 52 filing as a debt-listed company, before the IPO)
- Unaudited results Q3 FY25 (Reg 52 filing as a debt-listed company, before the IPO)
- Q3 FY26 earnings presentation (14 Jan 2026)
- Integrated filing (financials) XBRL Q1 FY26
- Q1 FY27 earnings presentation (15 Jul 2026)
- Unaudited results Q1 FY26 (quarter to 30 Jun 2025), first results after listing
- Q1 FY26 earnings presentation (15 Jul 2025)
- Integrated filing (financials) XBRL Q2 FY26
- Q2 FY26 earnings presentation (15 Oct 2025)
- Integrated filing (financials) XBRL Q3 FY26
- Integrated filing (financials) XBRL Q4 FY26 and FY26
- Integrated filing (financials) XBRL Q1 FY27
- Unaudited results Q1 FY27 (quarter to 30 Jun 2026)
- Integrated filing (financials) XBRL Q2 FY27
07Who runs it
Who runs HDB Financial Services, and did they deliver?
G. Ramesh
Managing Director and CEO
Jaykumar P. Shah
Chief Financial Officer
Speaks on the company's earnings calls about margins, credit cost and growth.
Natarajan Srinivasan
Non-Executive Chairman and Additional Independent Director · since 2026
Appointed from 14 May 2026 to 13 May 2029, after Arijit Basu resigned as chairman on 23 Jan 2026.
Jimmy Tata
Non-Executive Director (HDFC Bank nominee) · since 2026
His earlier term ended on 14 Jul 2026; re-appointed on 22 Oct 2026 as an additional director until 31 Jul 2028.
Vinod Koyande
Company Secretary · since 2026
From 31 Oct 2026, after Dipti Khandelwal.
What they said, and what happened
1 delivered · 4 too early to tell
Said on 19 Jun 2025
Use the ₹2,500 crore of new capital from the IPO to add to Tier I capital for future needs, including onward lending (RHP objects of the offer).
DeliveredWhat happened
The company reported that net proceeds of ₹2,456.6 crore were fully used by 30 Sep 2026.
Said on 15 Apr 2026
CFO Jaykumar Shah said the company wanted credit cost to moderate to about 2.3% of average loans, plus or minus, and could work with that number for the medium term.
Too early to tellWhat happened
Credit cost was 2.32% in Q1 FY27 and 2.37% in Q2 FY27 (annualised), against 2.5% for FY26. On 15 Jul 2026 he said nothing had changed in that view.
Said on 15 Apr 2026
Jaykumar Shah said the company would stay consistent at a net interest margin of 8% or more.
Too early to tellWhat happened
NIM was 8.35% in Q1 FY27 and 8.23% in Q2 FY27.
Said on 15 Apr 2026
Asked about FY27, Jaykumar Shah said operating costs would range around 3.7% of gross loans.
Too early to tellWhat happened
Operating costs were 3.8% of gross loans in Q1 FY27 and 3.7% in Q2 FY27.
Said on 15 Apr 2026
Jaykumar Shah said that over its three-year agenda the company looks at growth of nominal GDP plus 6% to 7%; he had given the same range on 14 Jan 2026.
Too early to tellWhat happened
Gross loans were 11.7% higher at 30 Sep 2026 than a year earlier.
Sources (12)
- Annual Report FY26 (19th, 2025-26), incl. standalone financial statements and BRSR
- Q2 FY27 earnings call transcript (call 14 Oct 2026)
- Board outcome 14 May 2026: Natarajan Srinivasan appointed Non-Executive Chairman and Independent Director; FY26 final dividend record date
- Resignation of Chairman and Independent Director Arijit Basu (23 Jan 2026), with his letter
- Jimmy Tata ceased as Non-Executive Director on completion of his term (14 Jul 2026)
- Board outcome 22 Oct 2026: Jimmy Tata appointed Additional Director (HDFC Bank nominee); two independent directors re-appointed
- Unaudited results Q2 FY27 (quarter and half year to 30 Sep 2026), with Reg 52(4) ratios and IPO-proceeds statement
- Red Herring Prospectus dated 19 Jun 2025 (IPO), incl. Restated Financial Information FY23-FY25
- Q4 FY26 earnings call transcript (call 15 Apr 2026)
- Q2 FY27 earnings presentation (14 Oct 2026)
- Q1 FY27 earnings call transcript (call 15 Jul 2026)
- Q3 FY26 earnings call transcript (call 14 Jan 2026)
08What could go wrong
What could go wrong for HDB Financial Services?
- Execution
More loans in default than in FY24
Gross stage 3 loans were 2.43% of gross loans at 30 Sep 2026, against 1.90% at 31 Mar 2024. Crisil linked the rise to 2.8% at Dec 2025 mainly to more late payments on vehicle loans and unsecured business loans.
Watch Gross stage 3 and credit cost each quarter: 2.43% and 2.37% in Q2 FY27.
- Concentration
About a quarter of loans have no collateral
The RHP put unsecured loans at 26.99% of gross loans at 31 Mar 2025. At 30 Sep 2026 the company said 74% of gross loans were secured. Unsecured business loans were ₹11,558 crore and personal loans to existing customers ₹9,973 crore.
Watch The secured share of loans, and gross stage 3 in enterprise lending (₹761 crore at 30 Sep 2026).
- Concentration
The BPO business has one client, HDFC Bank
All BPO revenue comes from HDFC Bank. The RHP says either side may end the service agreement under a change-of-control clause. BPO revenue fell from ₹2,634 crore in FY23 to ₹1,224 crore in FY26. CareEdge (9 Apr 2026) says "reduced reliance on a single vendor for BPO services (offered by HDBFS)" led to lower operating costs and other income in FY25.
Watch BPO revenue each quarter (₹297 crore in Q2 FY27) and any change to the agreement.
- Debt
Funded only by borrowing
HDB takes no deposits. Its borrowings were ₹104,441 crore at 30 Sep 2026, 4.9 times its equity, as the company reports it. The RHP says changes in interest rates can squeeze its net interest income and margin.
Watch Cost of borrowings (7.04% in Q2 FY27) and net interest margin (8.23%).
- Governance
The parent sells the same products
The RHP says HDFC Bank and some of its group companies offer the same products as HDB, which may lead to conflicts of interest, and that HDB relies on HDFC Bank's name through a logo licence.
Watch Payments to HDFC Bank in the annual related-party note (₹38.81 crore logo fee in FY26) and any change to the licence.
Sources (6)
- Q2 FY27 earnings presentation (14 Oct 2026)
- Red Herring Prospectus dated 19 Jun 2025 (IPO), incl. Restated Financial Information FY23-FY25
- Crisil Ratings rationale, 28 Sep 2026 (Crisil AAA/Stable and Crisil A1+ reaffirmed), as filed by the company
- Annual Report FY26 (19th, 2025-26), incl. standalone financial statements and BRSR
- CareEdge Ratings press release, 9 Apr 2026 (revised; CARE AAA; Stable and CARE A1+ reaffirmed)
- Integrated filing (financials) XBRL Q2 FY27
09Supporters and critics
What do supporters and critics point to?
What supporters point to
- HDFC Bank owned 74.08% at 30 Sep 2026, and Crisil names its ownership and HDB's importance to the bank as rating strengths.
- Profit was ₹780 crore in Q2 FY27, up 34.2% from ₹581 crore a year earlier.
- Net interest margin rose from 7.56% in FY25 to 7.96% in FY26, and was 8.23% in Q2 FY27.
- The top 20 borrowers were about 0.33% of loans at 30 Sep 2026; the average loan was about ₹160,000.
- Capital adequacy was 21.37% at 30 Sep 2026, up from 19.22% at 31 Mar 2025.
What critics point to
- Gross stage 3 loans were 2.43% at 30 Sep 2026, against 1.90% at 31 Mar 2024.
- Return on equity was 13.94% in FY26, against 19.55% in FY24.
- Credit cost was 2.5% of average loans in FY26, against 1.3% in FY24.
- BPO revenue, all from HDFC Bank, fell from ₹2,634 crore in FY23 to ₹1,224 crore in FY26.
- The RHP put unsecured loans at 26.99% of gross loans at 31 Mar 2025.
10What to watch next
What should you watch next at HDB Financial Services?
Next event
Q3 FY27 results (date not announced)
Date not announced yet.
Credit cost
Credit cost was 2.37% of average loans in Q2 FY27. CFO Jaykumar Shah said on 14 Oct 2026 that the company wants to manage it at about 2.3%, plus or minus, in the medium term.
Net interest margin
NIM was 8.23% in Q2 FY27. On 14 Oct 2026 the CFO said the company wants 8% or more in the long term, and 8.2% or more at least in the near term.
BPO revenue from HDFC Bank
BPO revenue, all from HDFC Bank, was ₹297 crore in Q2 FY27, against ₹320 crore in Q2 FY26. The RHP says either side may end the service agreement under a change-of-control clause.
11Key facts
Key facts about HDB Financial Services
- What does HDB Financial Services do?
- HDB Financial Services is a non-bank lender (NBFC) set up in 2007 as a subsidiary of HDFC Bank. It gives loans against property, business loans, vehicle and equipment loans, and consumer loans in India. Its gross loans were ₹124,469 crore at 30 Sep 2026.
- How does HDB Financial Services make money?
- HDB Financial Services earns mostly interest on loans: ₹15,788 crore of its ₹18,430 crore revenue in FY26. Fees, charges and insurance commission added ₹1,417 crore, and back-office, sales and collection work for HDFC Bank ₹1,224 crore.
- Who are HDB Financial Services' customers?
- HDB Financial Services had 24.8 million customers at 30 Sep 2026. Enterprise loans (to self-employed individuals, small businesses and salaried customers) were 37.6% of its gross loans, asset finance (commercial vehicles, construction equipment and tractors) 36.6% and consumer finance 25.8%.
- How big is HDB Financial Services?
- HDB Financial Services' revenue was ₹18,430 crore in FY26, up from ₹16,300 crore in FY25. Its profit was ₹2,544 crore in FY26, up from ₹2,176 crore in FY25.
- Who owns HDB Financial Services?
- HDFC Bank, the promoter, owned 74.08% of HDB Financial Services at 30 Sep 2026, with none of those shares pledged. Domestic institutions held 11.95%, foreign portfolio investors 4.04%, individuals and other public holders 9.70%, and an employee trust 0.23%.
- Where does HDB Financial Services get the money it lends?
- HDB Financial Services does not take deposits. Its borrowings were ₹104,441 crore at 30 Sep 2026: bank loans were 43.4%, bonds (NCDs) 28.5% and foreign loans (ECB) 12.1%, with securitisation, subordinated debt, commercial paper and perpetual debt making up the rest.
- How many of HDB Financial Services' loans are not being repaid?
- HDB Financial Services' gross stage 3 loans (loans in default, which it says are the same as its gross NPA) were 2.43% of gross loans at 30 Sep 2026, and 1.09% after provisions (net).
- What is HDB Financial Services' BPO business?
- HDB Financial Services also does back-office, sales-support and collection work for HDFC Bank, its parent. All of that revenue comes from HDFC Bank: ₹1,224 crore in FY26, or 6.6% of revenue, down from ₹2,634 crore in FY23.
- When did HDB Financial Services list on the stock exchanges?
- HDB Financial Services' shares listed on NSE and BSE on 2 Jul 2025 after a ₹12,500 crore IPO. HDFC Bank sold ₹10,000 crore of shares in it, and the company raised ₹2,500 crore of new capital.
Sources (5)
- Annual Report FY26 (19th, 2025-26), incl. standalone financial statements and BRSR
- Q2 FY27 earnings presentation (14 Oct 2026)
- Shareholding pattern 30 Sep 2026
- Q2 FY27 earnings call transcript (call 14 Oct 2026)
- Red Herring Prospectus dated 19 Jun 2025 (IPO), incl. Restated Financial Information FY23-FY25
Terms on this page
- Credit rating
- FII and DII holding
- Gross and net NPA
- Market capitalisation
- Net interest margin (NIM)
- Net profit
- Promoter holding
- Provision coverage ratio (PCR)
- Public shareholding
- Return on equity (ROE)
Each explains the term in plain English, with the same number from other companies on Cityfort.
Go deeper
More detail from the same filings. Open any section.
12What it sells
12What it sells
What does HDB Financial Services sell?
Enterprise lending
Loans to self-employed individuals, small and medium businesses and salaried customers: loans against property (₹27,195 crore), unsecured business loans (₹11,558 crore), salaried personal loans (₹3,547 crore), enterprise business loans and gold loans. ₹46,832 crore in all at 30 Sep 2026.
Asset finance
Loans to buy commercial vehicles (₹29,750 crore), construction equipment (₹12,641 crore) and tractors (₹3,174 crore). ₹45,565 crore in all at 30 Sep 2026.
Consumer finance
Car loans (₹11,070 crore), personal loans to existing customers (₹9,973 crore), loans for phones and appliances (₹6,869 crore), two-wheeler loans and small micro loans. ₹32,071 crore in all at 30 Sep 2026.
BPO services for HDFC Bank
Sales-support, collection call-centre and back-office work for HDFC Bank. Revenue was ₹1,224 crore in FY26, of which sales support was ₹737 crore.
Insurance sold to borrowers
As a registered insurance agent it sells policies to its customers. Commission from HDFC Life was ₹78 crore and from HDFC Ergo ₹20 crore in FY26.
What it does
- Does: Lends from 1,701 branches in 1,156 cities and towns (30 Sep 2026); 71% of the branches are in what it calls Tier 4 towns and smaller
- Does: Takes collateral on most loans: 74% of gross loans were secured at 30 Sep 2026
- Does: Finds borrowers at more than 165,000 retailer and dealer touchpoints
- Does: Does sales, back-office and collection work for HDFC Bank
What it does not do
- Does not: It is not a bank and does not take deposits from the public; RBI registers it as an NBFC that does not accept deposits
- Does not: It is not HDFC Bank: HDFC Bank is its parent and owned 74.08% at 30 Sep 2026
- Does not: Its BPO arm has no outside clients: all of that revenue comes from HDFC Bank
13How the money flows
13How the money flows · FY26
How does money flow through HDB Financial Services?
Money in
- Interest on loans₹15,788 cr
- Fees, charges, insurance commission and gains₹1,417 cr
- BPO fees from HDFC Bank₹1,224 cr
The company
HDB Financial Services
₹18,430 cr came in
Money out
- Interest paid to lenders (banks, bondholders and others)₹6,820 cr
- Employees (incl. ₹1,091 crore for BPO staff and a one-time ₹61 crore labour-code charge)₹3,914 cr
- Other running costs (incl. depreciation)₹1,495 cr
- Provisions for bad loans₹2,815 cr
- Tax₹842 cr
- Net profit₹2,544 cr
- These are HDB Financial Services' own (standalone) FY26 accounts; it has no subsidiaries.
- Borrowers paid ₹15,788 crore of interest and ₹1,417 crore of fees and charges. HDFC Bank paid ₹1,224 crore for BPO work.
- HDB paid ₹6,820 crore of interest to the banks, bondholders and other lenders whose money it lends on.
- Staff cost ₹3,914 crore, of which ₹1,091 crore was for BPO staff, and other running costs ₹1,495 crore. ₹2,815 crore was set aside for loans that may not be repaid.
- After ₹842 crore of tax, ₹2,544 crore was profit.
14What it needs to run
14What it needs to run
What does HDB Financial Services need to run?
Borrowed money
Borrowings were ₹104,441 crore at 30 Sep 2026, up from ₹89,682 crore at 31 Mar 2025. The annualised cost of borrowings was 7.04% in Q2 FY27.
Credit ratings
AAA (Stable) from Crisil, reaffirmed on 28 Sep 2026, and from CareEdge, reaffirmed on 9 Apr 2026. A high rating lets it borrow from banks and bond markets.
Capital
Capital adequacy (CRAR: own money as a share of risk-weighted loans) was 21.37% at 30 Sep 2026, with Tier I capital at 17.36%.
Branches and dealers
1,701 branches in 1,156 cities and towns across 31 states and union territories, and more than 165,000 retailer and dealer touchpoints, at 30 Sep 2026.
People
88,162 full-time employees at 31 Mar 2026, including BPO staff. The lending business had 61,522 at 30 Sep 2026.
HDFC Bank's logo
A trademark licence lets it use the HDFC Bank logo. It paid HDFC Bank ₹38.81 crore for the licence in FY26.
RBI registration
RBI registered it in Dec 2007 as an NBFC that does not take deposits, and places it in the NBFC 'upper layer'.
Sources (6)
- Q2 FY27 earnings presentation (14 Oct 2026)
- Q4 FY26 earnings presentation (15 Apr 2026)
- Crisil Ratings rationale, 28 Sep 2026 (Crisil AAA/Stable and Crisil A1+ reaffirmed), as filed by the company
- CareEdge Ratings press release, 9 Apr 2026 (revised; CARE AAA; Stable and CARE A1+ reaffirmed)
- Annual Report FY26 (19th, 2025-26), incl. standalone financial statements and BRSR
- Red Herring Prospectus dated 19 Jun 2025 (IPO), incl. Restated Financial Information FY23-FY25
15Competitors and what protects it
15Competitors and what protects it
Who does HDB Financial Services compete with?
Bajaj Finance
NSE: BAJFINANCE
A retail NBFC the RHP (19 Jun 2025) lists as a peer. Its FY25 debt-to-equity was 3.2 in the RHP's table, against HDB's 5.9.
Shriram Finance
NSE: SHRIRAMFIN
A vehicle-focused NBFC the RHP lists as a peer. Its FY25 debt-to-equity was 4.5 in the RHP's table.
Cholamandalam Investment and Finance Company
An NBFC the RHP lists as a peer. Its FY25 debt-to-equity was 7.7 in the RHP's table, the highest of the peers shown.
Mahindra & Mahindra Financial Services
An NBFC the RHP lists as a peer. Its FY25 debt-to-equity was 5.9 in the RHP's table, the same as HDB's.
L&T Finance
An NBFC the RHP lists as a peer. Its FY25 debt-to-equity was 3.9 in the RHP's table.
What protects the business
Each strength is scored 1 (weak) to 5 (strong) for the business, with the reason. It is not a rating of the share.
- Parent's backing4 of 5
HDFC Bank owned 74.08% at 30 Sep 2026 and licenses its logo to HDB. Crisil names the bank's ownership and HDB's strategic importance to it as rating strengths.
- Distribution3 of 5
1,701 branches, 71% of them in Tier 4 towns and smaller, and more than 165,000 retailer and dealer touchpoints at 30 Sep 2026.
- Spread of loans4 of 5
The average loan was about ₹160,000, and the top 20 borrowers were about 0.33% of loans at 30 Sep 2026.
- Cost of borrowing3 of 5
AAA (Stable) from Crisil and CareEdge; the cost of borrowings was 7.04% in Q2 FY27. Its FY25 debt-to-equity of 5.9 compares with 3.2 to 7.7 for the eight peers in the RHP's table.
Weak spot
Asset quality
Crisil calls its asset quality "moderate, though stable" (28 Sep 2026). Gross stage 3 loans were 2.43% at 30 Sep 2026, against 1.90% at 31 Mar 2024.
Sources (6)
- Red Herring Prospectus dated 19 Jun 2025 (IPO), incl. Restated Financial Information FY23-FY25
- Shareholding pattern 30 Sep 2026
- Annual Report FY26 (19th, 2025-26), incl. standalone financial statements and BRSR
- Crisil Ratings rationale, 28 Sep 2026 (Crisil AAA/Stable and Crisil A1+ reaffirmed), as filed by the company
- Q2 FY27 earnings presentation (14 Oct 2026)
- CareEdge Ratings press release, 9 Apr 2026 (revised; CARE AAA; Stable and CARE A1+ reaffirmed)
16Where growth could come from
16Where growth could come from
Where could HDB Financial Services' growth come from?
CFO Jaykumar Shah said on the Q4 FY26 call (15 Apr 2026) that over its three-year agenda the company looks at "a Nominal GDP + 6% to 7% growth". He also said it does not give guidance on specific numbers. On the Q2 FY27 call (14 Oct 2026) he said that in the long term it wants a net interest margin of 8% or more.
Consumer finance
Working25.8% of loans (Sep 2026), from 22.7% (Mar 2025)
MD G. Ramesh said on 14 Oct 2026 that the consumer finance book grew 22% in a year, with appliance and phone loans up 49% and car loans up 22%.
Status: Working, on track against what the company said.
Gold loans
Working₹2,007 cr (Sep 2026), from ₹990 cr a year earlier
Gold loans roughly doubled in a year (Cityfort calculation: +103%) and were 1.6% of gross loans at 30 Sep 2026.
Status: Working, on track against what the company said.
Loans against property
Working₹27,195 cr, +13% in a year (Sep 2026)
The largest single product, 21.8% of gross loans, up from ₹24,033 crore at 30 Sep 2025 (Cityfort calculation of the growth).
Status: Working, on track against what the company said.
Unsecured business loans
Mixed₹11,558 cr, −5% in a year (Sep 2026)
The FY26 annual report says the company took "a calibrated approach" to unsecured business lending, putting asset quality first. The book was ₹12,181 crore a year earlier.
Status: Mixed, partly on track.
New loans (disbursements)
Working₹18,522 cr in Q2 FY27, +18.7% year on year
New loans were ₹15,599 crore in Q2 FY26. Gross loans were 11.7% higher at 30 Sep 2026 than a year earlier.
Status: Working, on track against what the company said.
Status compares progress with what the company itself said it would do: Working = on track against what the company said; Mixed = partly on track; Behind = behind the company's own plan; New = recently announced; Early = too early to judge.
17Financial strength: capital, bad loans, deposits
17Financial strength · FY26
How strong is HDB Financial Services' balance sheet?
- Loans given (advances)₹1.15 lakh cr
- Capital adequacy (CRAR)
- 21.4%
- capital as a share of risk-weighted loans; regulators set a minimum
- Gross NPA
- 2.44%
- loans not being repaid, as % of all loans
- Net NPA
- 1.09%
- the same, after money already set aside
- Provision cover
- 55.53%
- share of bad loans already provided for
- Cost to income
- 46.6%
- ₹ of running costs per ₹100 of income after interest paid
- Return on assets
- 2.19%
- profit as % of everything the lender owns
- Return on equity
- 13.94%
- profit as % of shareholders' money
Figures as on FY26 year end (standalone, as banks report these ratios). Reported by the company; see the dates on each source.
18Who owns it
18Who owns it · Q2 FY27
Who owns HDB Financial Services?
- Promoters (founders or parent company)74.1%
- Foreign institutions (FII)4.0%
- Indian institutions (DII)12.0%
- Public and others9.9%
Promoter pledge
No promoter shares were pledged in Q2 FY27.
How ownership changed
* Pledged = share of the promoters' own holding reported as pledged. In older filings this can include shares “otherwise encumbered”; the governance flags say when.
† Others = Employee trust (neither promoter nor public).
19What it does with profit
19What it does with profit
What does HDB Financial Services do with its profit?
Dividend per share
₹4.00FY26
Dividend paid for each share, by financial year.
₹ per share
See the numbers
Money raised · 2 Jul 2025
IPO of ₹12,500 crore at ₹740 a share (bids 25–27 Jun 2025): ₹2,500 crore of new shares to add to Tier I capital, and ₹10,000 crore of shares sold by HDFC Bank. The company reported that the net proceeds of ₹2,456.6 crore were fully used by 30 Sep 2026.
₹2,500 cr
Sources (5)
- Red Herring Prospectus dated 19 Jun 2025 (IPO), incl. Restated Financial Information FY23-FY25
- Annual Report FY26 (19th, 2025-26), incl. standalone financial statements and BRSR
- Board outcome 14 May 2026: Natarajan Srinivasan appointed Non-Executive Chairman and Independent Director; FY26 final dividend record date
- NSE IPO issue information for HDB Financial Services (issue period, price band, bid lot, listing date)
- Unaudited results Q2 FY27 (quarter and half year to 30 Sep 2026), with Reg 52(4) ratios and IPO-proceeds statement
20Governance signals
20Governance signals
What do HDB Financial Services' governance filings show?
- Auditor
- G D Apte & Co and Kalyaniwalla & Mistry LLP (joint statutory auditors, appointed at the 17th AGM until the 20th AGM), since 2024
- Auditor changes
- None in the period covered
- Audit qualifications
- None reported
- Related-party dealings
- HDFC Bank, the promoter, owned 74.08% at 30 Sep 2026. In FY26 it paid HDB ₹1,223.91 crore for BPO services. HDB paid HDFC Bank ₹567.96 crore of interest on loans and overdrafts, ₹38.81 crore for the logo licence and ₹198.15 crore of dividends; the bank's term loans to HDB were ₹8,767.38 crore at 31 Mar 2026. HDB earned ₹78.08 crore of commission from HDFC Life and ₹19.63 crore from HDFC Ergo, and gave no loans to related parties.
- Credit rating
- CRISIL AAA (outlook Stable), 28 Sep 2026
A credit rating describes the company's ability to repay debt. It is not a rating of the share.
Flags to know about
regulatory · 1 Oct 2025
RBI penalty of ₹420,000
RBI's order of 1 Oct 2025 imposed a penalty of ₹420,000 for non-compliance with its Know Your Customer Directions, 2016, in FY24: failure to obtain PAN, an equivalent e-document or Form 60 for certain loan accounts. The company said there was no material financial implication and that it has taken corrective action.
other · 23 Jan 2026
Chairman resigned in Jan 2026
Independent director and chairman Arijit Basu resigned on 23 Jan 2026. His letter says he had been approached to chair a bank and received regulatory approval, and: "In view of conflict of interest, I need to step down". Natarajan Srinivasan became chairman from 14 May 2026.
related party · 31 Mar 2026
The parent is also a client, a lender and a licensor
HDFC Bank is HDB's only BPO client, lends to it (₹8,767.38 crore of term loans at 31 Mar 2026) and licenses it the HDFC Bank logo. The RHP says HDFC Bank group companies sell the same products, which may lead to conflicts of interest.
Sources (7)
- Annual Report FY26 (19th, 2025-26), incl. standalone financial statements and BRSR
- Shareholding pattern 30 Sep 2026
- Crisil Ratings rationale, 28 Sep 2026 (Crisil AAA/Stable and Crisil A1+ reaffirmed), as filed by the company
- Reg 30 disclosure: RBI penalty of Rs 4.2 lakh for KYC Directions non-compliance in FY24 (order dated 1 Oct 2025)
- Resignation of Chairman and Independent Director Arijit Basu (23 Jan 2026), with his letter
- Board outcome 14 May 2026: Natarajan Srinivasan appointed Non-Executive Chairman and Independent Director; FY26 final dividend record date
- Red Herring Prospectus dated 19 Jun 2025 (IPO), incl. Restated Financial Information FY23-FY25
21What the market paid
21What the market paid · price as of 11 Nov 2026
What did the market pay for HDB Financial Services on 11 Nov 2026?
Price as of 11 Nov 2026 (shown for education; prices change daily).
Price as of 11 Nov 2026: ₹563.60, the NSE closing price. Market value: ₹46,824 crore, a Cityfort calculation from the 11 Nov 2026 NSE closing price and 830,794,415 shares in the Sep 2026 shareholding pattern. P/E is the share price divided by one year's profit per share: here basic EPS of the four quarters to 30 Sep 2026, ₹35.65 (Cityfort calculation from the Q3 FY26 to Q2 FY27 results), giving 15.8. P/B divides the price by book value (shareholders' money) per share, ₹266.7 at 30 Sep 2026 as the company reports it, giving 2.11. EV/EBITDA is not shown, because interest is a lender's main cost.
- Share price
- ₹563.60
- Market value (market cap)
- ₹46,824 cr
- P/E
- 15.8×
- P/B
- 2.1×
Source: NSE CM bhavcopy, 11 Nov 2026 (HDBFS EQ closing price); Shareholding pattern 30 Sep 2026; Integrated filing (financials) XBRL Q3 FY26 and 4 more
Sources (7)
- NSE CM bhavcopy, 11 Nov 2026 (HDBFS EQ closing price)
- Shareholding pattern 30 Sep 2026
- Integrated filing (financials) XBRL Q3 FY26
- Integrated filing (financials) XBRL Q4 FY26 and FY26
- Integrated filing (financials) XBRL Q1 FY27
- Integrated filing (financials) XBRL Q2 FY27
- Q2 FY27 earnings presentation (14 Oct 2026)
22How it got here
22How it got here
How did HDB Financial Services get here?
2007
Milestone
Set up by HDFC Bank
Incorporated on 4 Jun 2007 as a subsidiary of HDFC Bank; RBI registered it as an NBFC in Dec 2007.
2021
Crisis
COVID-period loan losses
Profit fell to ₹391 crore in FY21 from ₹1,005 crore in FY20, and gross NPA reached 5.0% in FY22, the company's presentation shows.
2023
Business-model change
BPO revenue peaks, then shrinks
BPO revenue from HDFC Bank was ₹2,634 crore in FY23, 21.2% of revenue, and fell to ₹1,217 crore in FY25.
2025
Milestone
RBI's listing rule for large NBFCs
The FY26 annual report says it raised equity through an IPO pursuant to RBI's circular of 16 Jan 2025, which placed it in the NBFC upper layer.
2025
Milestone
Shares listed on NSE and BSE
Listed on 2 Jul 2025 after a ₹12,500 crore IPO at ₹740 a share. HDFC Bank's holding fell from 94.09% (fully diluted, 31 Mar 2025) to 74.19%.
2026
Milestone
New chairman
Arijit Basu resigned as chairman on 23 Jan 2026 to avoid a conflict of interest; Natarajan Srinivasan took over from 14 May 2026.
2026
Milestone
24.8 million customers
Customers rose from 19.2 million at 31 Mar 2025 to 24.8 million at 30 Sep 2026, while branches fell from 1,771 to 1,701.
Sources (7)
- Annual Report FY26 (19th, 2025-26), incl. standalone financial statements and BRSR
- Q2 FY27 earnings presentation (14 Oct 2026)
- Annual Report FY22 (15th, 2021-22)
- Red Herring Prospectus dated 19 Jun 2025 (IPO), incl. Restated Financial Information FY23-FY25
- Shareholding pattern at listing (as of 1 Jul 2025)
- Resignation of Chairman and Independent Director Arijit Basu (23 Jan 2026), with his letter
- Board outcome 14 May 2026: Natarajan Srinivasan appointed Non-Executive Chairman and Independent Director; FY26 final dividend record date
Used in a free classroom lesson: Project: an IPO filing profile from one RHP.
23Sources and changes
Where every number on this page comes from
Sources (45 documents)
- S1Annual Report FY26 (19th, 2025-26), incl. standalone financial statements and BRSR · NSE (company filing, nsearchives.nseindia.com) · Tier 1: company or exchange filing · 1 Jun 2026
- S2Annual Report FY25 (18th, 2024-25), as filed before listing · Company website (hdbfs.com) · Tier 1: company or exchange filing · 15 May 2025
- S3Annual Report FY24 (17th, 2023-24) · Company website (hdbfs.com) · Tier 1: company or exchange filing · 17 May 2024
- S4Annual Report FY23 (16th, 2022-23) · Company website (hdbfs.com) · Tier 1: company or exchange filing · 31 May 2023
- S5Annual Report FY22 (15th, 2021-22) · Company website (hdbfs.com) · Tier 1: company or exchange filing · 18 May 2022
- S6Red Herring Prospectus dated 19 Jun 2025 (IPO), incl. Restated Financial Information FY23-FY25 · NSE (IPO offer document) · Tier 1: company or exchange filing · 19 Jun 2025
- S7Unaudited results Q2 FY27 (quarter and half year to 30 Sep 2026), with Reg 52(4) ratios and IPO-proceeds statement · NSE (company filing, nsearchives.nseindia.com) · Tier 1: company or exchange filing · 14 Oct 2026
- S8Integrated filing (financials) XBRL Q2 FY27 · NSE (company filing, nsearchives.nseindia.com) · Tier 1: company or exchange filing · 14 Oct 2026
- S9Q2 FY27 earnings presentation (14 Oct 2026) · NSE (company filing, nsearchives.nseindia.com) · Tier 1: company or exchange filing · 14 Oct 2026
- S10Q2 FY27 earnings call transcript (call 14 Oct 2026) · NSE (company filing, nsearchives.nseindia.com) · Tier 1: company or exchange filing · 20 Oct 2026
- S11Unaudited results Q1 FY27 (quarter to 30 Jun 2026) · NSE (company filing, nsearchives.nseindia.com) · Tier 1: company or exchange filing · 15 Jul 2026
- S12Integrated filing (financials) XBRL Q1 FY27 · NSE (company filing, nsearchives.nseindia.com) · Tier 1: company or exchange filing · 15 Jul 2026
- S13Q1 FY27 earnings presentation (15 Jul 2026) · NSE (company filing, nsearchives.nseindia.com) · Tier 1: company or exchange filing · 15 Jul 2026
- S14Q1 FY27 earnings call transcript (call 15 Jul 2026) · NSE (company filing, nsearchives.nseindia.com) · Tier 1: company or exchange filing · 20 Jul 2026
- S16Audited results Q4 FY26 and FY26, revised filing 15 Apr 2026 (cash-flow footnote correction only) · NSE (company filing, nsearchives.nseindia.com) · Tier 1: company or exchange filing · 15 Apr 2026
- S17Integrated filing (financials) XBRL Q4 FY26 and FY26 · NSE (company filing, nsearchives.nseindia.com) · Tier 1: company or exchange filing · 15 Apr 2026
- S18Q4 FY26 earnings presentation (15 Apr 2026) · NSE (company filing, nsearchives.nseindia.com) · Tier 1: company or exchange filing · 15 Apr 2026
- S19Q4 FY26 earnings call transcript (call 15 Apr 2026) · NSE (company filing, nsearchives.nseindia.com) · Tier 1: company or exchange filing · 21 Apr 2026
- S20Unaudited results Q3 FY26 (quarter to 31 Dec 2025) · NSE (company filing, nsearchives.nseindia.com) · Tier 1: company or exchange filing · 14 Jan 2026
- S21Integrated filing (financials) XBRL Q3 FY26 · NSE (company filing, nsearchives.nseindia.com) · Tier 1: company or exchange filing · 14 Jan 2026
- S22Q3 FY26 earnings presentation (14 Jan 2026) · NSE (company filing, nsearchives.nseindia.com) · Tier 1: company or exchange filing · 14 Jan 2026
- S23Q3 FY26 earnings call transcript (call 14 Jan 2026) · NSE (company filing, nsearchives.nseindia.com) · Tier 1: company or exchange filing · 20 Jan 2026
- S24Unaudited results Q2 FY26 (quarter to 30 Sep 2025) · NSE (company filing, nsearchives.nseindia.com) · Tier 1: company or exchange filing · 15 Oct 2025
- S25Integrated filing (financials) XBRL Q2 FY26 · NSE (company filing, nsearchives.nseindia.com) · Tier 1: company or exchange filing · 15 Oct 2025
- S26Q2 FY26 earnings presentation (15 Oct 2025) · NSE (company filing, nsearchives.nseindia.com) · Tier 1: company or exchange filing · 15 Oct 2025
- S27Unaudited results Q1 FY26 (quarter to 30 Jun 2025), first results after listing · NSE (company filing, nsearchives.nseindia.com) · Tier 1: company or exchange filing · 15 Jul 2025
- S28Integrated filing (financials) XBRL Q1 FY26 · NSE (company filing, nsearchives.nseindia.com) · Tier 1: company or exchange filing · 15 Jul 2025
- S29Q1 FY26 earnings presentation (15 Jul 2025) · NSE (company filing, nsearchives.nseindia.com) · Tier 1: company or exchange filing · 15 Jul 2025
- S30Audited results Q4 FY25 and FY25 (Reg 52 filing as a debt-listed company, before the IPO) · Company website (hdbfs.com) · Tier 1: company or exchange filing · 16 Apr 2025
- S31Unaudited results Q3 FY25 (Reg 52 filing as a debt-listed company, before the IPO) · Company website (hdbfs.com) · Tier 1: company or exchange filing · 14 Jan 2025
- S32Shareholding pattern at listing (as of 1 Jul 2025) · NSE (company filing, nsearchives.nseindia.com) · Tier 1: company or exchange filing · 2 Jul 2025
- S33Shareholding pattern 30 Sep 2025 · NSE (company filing, nsearchives.nseindia.com) · Tier 1: company or exchange filing · 16 Oct 2025
- S34Shareholding pattern 31 Dec 2025 · NSE (company filing, nsearchives.nseindia.com) · Tier 1: company or exchange filing · 20 Jan 2026
- S35Shareholding pattern 31 Mar 2026 · NSE (company filing, nsearchives.nseindia.com) · Tier 1: company or exchange filing · 20 Apr 2026
- S36Shareholding pattern 30 Jun 2026 · NSE (company filing, nsearchives.nseindia.com) · Tier 1: company or exchange filing · 15 Jul 2026
- S37Shareholding pattern 30 Sep 2026 · NSE (company filing, nsearchives.nseindia.com) · Tier 1: company or exchange filing · 15 Oct 2026
- S38Crisil Ratings rationale, 28 Sep 2026 (Crisil AAA/Stable and Crisil A1+ reaffirmed), as filed by the company · NSE debt segment (company filing of the Crisil Ratings rationale) · Tier 2: rating agency or regulator · 28 Sep 2026
- S39CareEdge Ratings press release, 9 Apr 2026 (revised; CARE AAA; Stable and CARE A1+ reaffirmed) · CARE Ratings · Tier 2: rating agency or regulator · 9 Apr 2026
- S40Reg 30 disclosure: RBI penalty of Rs 4.2 lakh for KYC Directions non-compliance in FY24 (order dated 1 Oct 2025) · NSE (company filing, nsearchives.nseindia.com) · Tier 1: company or exchange filing · 4 Oct 2025
- S41Resignation of Chairman and Independent Director Arijit Basu (23 Jan 2026), with his letter · NSE (company filing, nsearchives.nseindia.com) · Tier 1: company or exchange filing · 23 Jan 2026
- S42Board outcome 14 May 2026: Natarajan Srinivasan appointed Non-Executive Chairman and Independent Director; FY26 final dividend record date · NSE (company filing, nsearchives.nseindia.com) · Tier 1: company or exchange filing · 14 May 2026
- S43Jimmy Tata ceased as Non-Executive Director on completion of his term (14 Jul 2026) · NSE (company filing, nsearchives.nseindia.com) · Tier 1: company or exchange filing · 14 Jul 2026
- S44Board outcome 22 Oct 2026: Jimmy Tata appointed Additional Director (HDFC Bank nominee); two independent directors re-appointed · NSE (company filing, nsearchives.nseindia.com) · Tier 1: company or exchange filing · 22 Oct 2026
- S45NSE CM bhavcopy, 11 Nov 2026 (HDBFS EQ closing price) · NSE · Tier 1: company or exchange filing · 11 Nov 2026
- S46NSE IPO issue information for HDB Financial Services (issue period, price band, bid lot, listing date) · NSE · Tier 1: company or exchange filing · 20 Jun 2025
Changes to this page (v1 · 12 Nov 2026)
- v1 · 12 Nov 2026First version. (first version)
Numbers come only from tier 1 and tier 2 sources. Read how we research.
Disclaimer
For learning only. Cityfort is not a SEBI-registered adviser and does not recommend buying or selling any security. Prices shown are dated and may be out of date.
Investing in securities involves risk, including loss of capital. Before making any investment decision, do your own research and consider consulting a SEBI-registered investment adviser.
Cityfort, its owners and contributors may or may not hold securities of companies covered. Content is not an offer or solicitation to buy or sell any security.
Read the full disclaimerHide the full disclaimer
Cityfort publishes educational content that explains how listed companies work. Cityfort is not registered with the Securities and Exchange Board of India (SEBI) as an Investment Adviser or Research Analyst and does not provide investment advice, recommendations, ratings, price targets or any opinion on whether to buy, sell or hold any security.
All information is taken from publicly available sources, mainly company filings on BSE and NSE, which are listed on each page with dates. We work to keep it accurate and correct errors publicly, but we do not guarantee that it is complete, accurate or up to date. Any market price or price-based ratio shown is dated, may be out of date by the time you read it, and is included only to explain concepts.
Statements by company management are reported as statements, with their date and source; they are not our forecasts.