Financial Services · NSE: IDBI · BSE: 500116
IDBI Bank: how the business works
IDBI Bank, majority owned by LIC and the Government of India, takes deposits and lends mostly to individuals, small businesses and farmers, earning ₹9,210 crore of group profit in FY26.
Follow IDBI Bank
Email me when IDBI Bank's page is updated after results.
We store your email address with Kit, our email provider, which also records when you sign up and whether you open or click our emails. We send a confirmation email first. See our privacy policy.
IDBI Bank Ltd · Mumbai, Maharashtra · Founded 1964
Updated for Q2 FY27 · checked
- Deposits, 30 Sep 2026
- ₹355,684 cr
- Loans (net advances), 30 Sep 2026
- ₹271,533 cr
- Group net profit, FY26
- ₹9,210 cr
- Branches, 31 Mar 2026
- 2,174
- Promoters (LIC and Government), Sep 2026
- 94.71%
The short version
IDBI Bank in 5 points
1 · What it sells
IDBI Bank lends mostly to individuals, small businesses and farmers, with net advances of ₹271,533 crore at 30 Sep 2026, earns fees and treasury income (₹6,746 crore of bank-only other income in FY26), and funds this mainly with deposits of ₹355,684 crore.
2 · Who pays it
Borrowers pay IDBI Bank interest, and at 30 Sep 2026 retail borrowers had 69% of its gross advances and corporate borrowers 31%, its Q2 FY27 press release says.
3 · What it keeps from ₹100
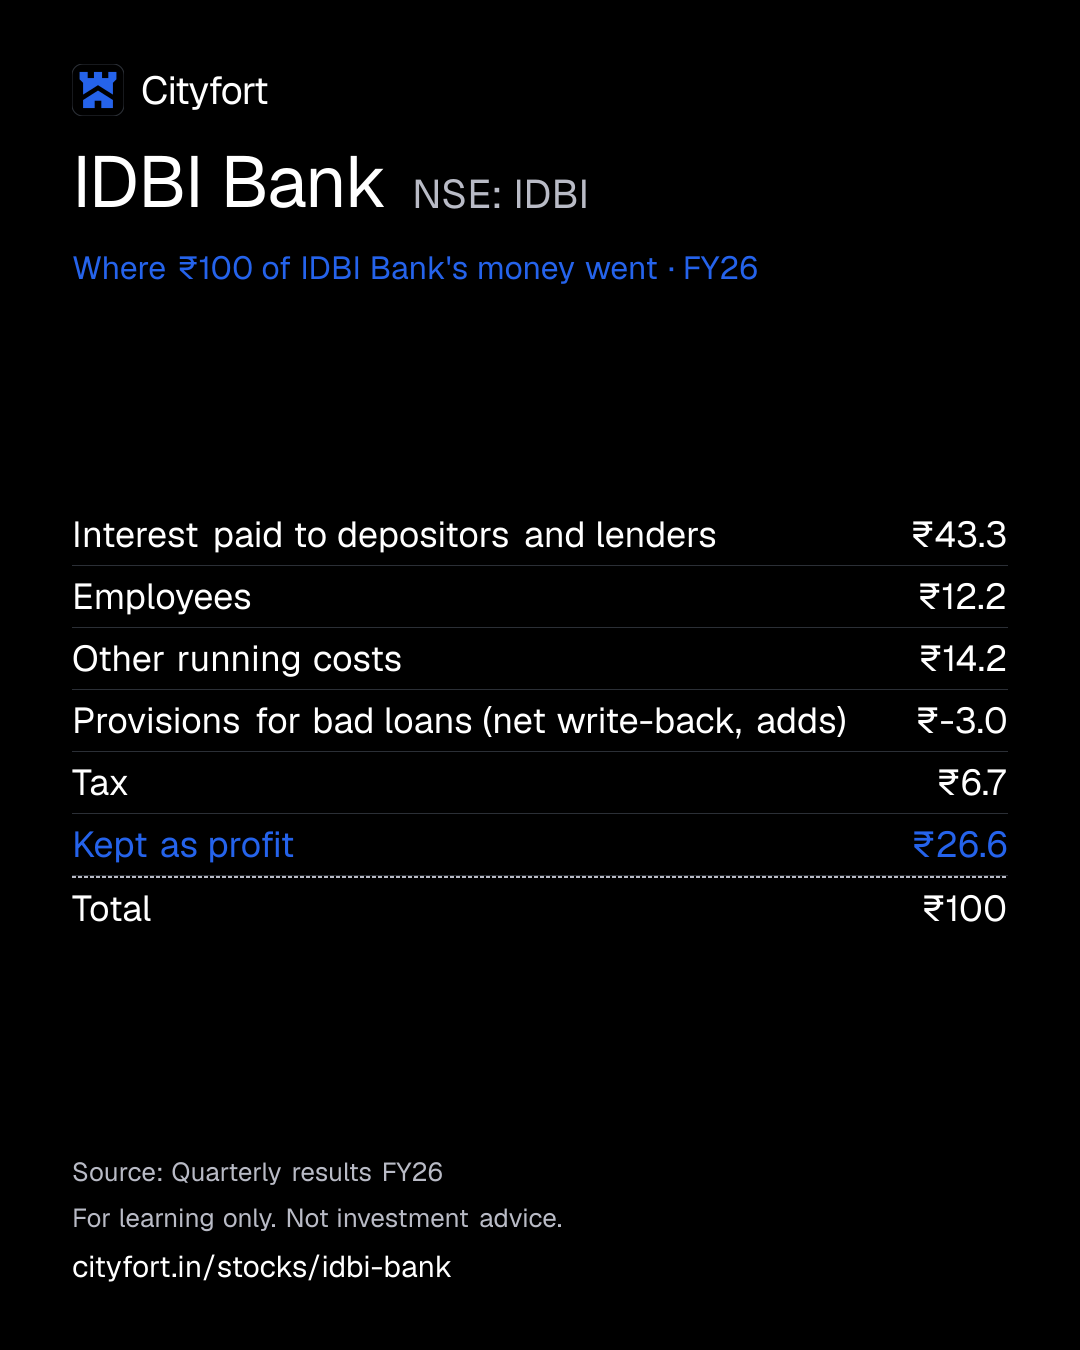
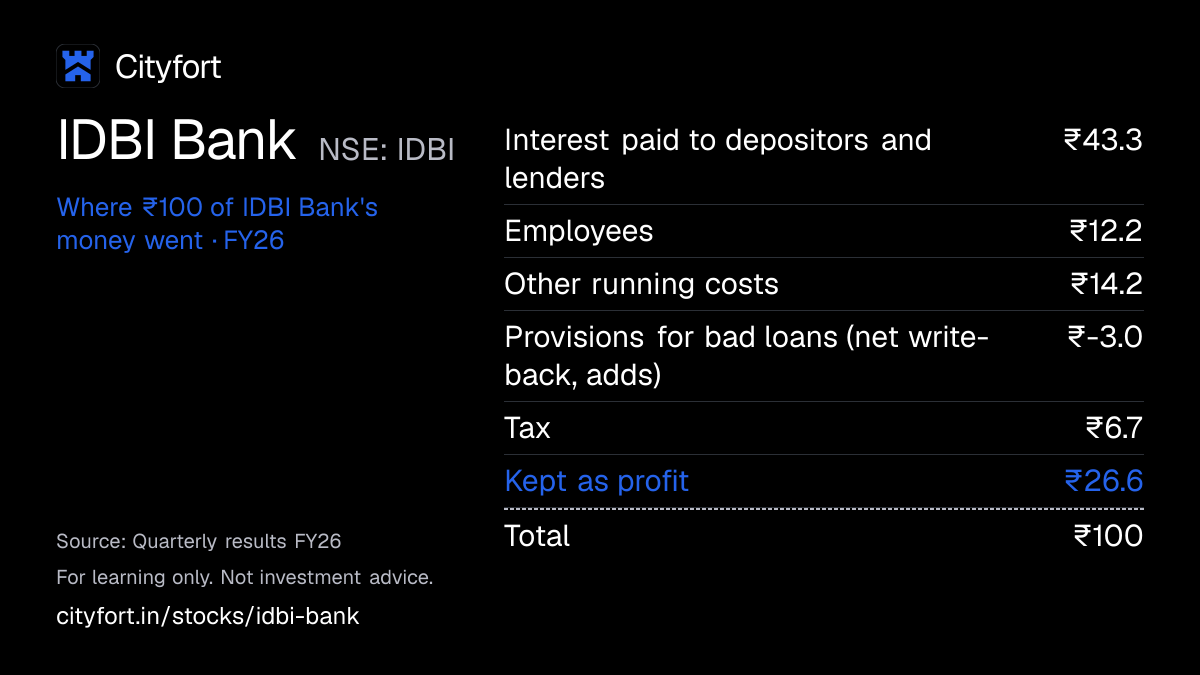
Of every ₹100 that came in to IDBI Bank alone in FY26 it kept ₹26.6 as profit, helped by a ₹1,088 crore net write-back of provisions and a ₹1,707 crore NSDL gain, which is in its ₹10,838 crore operating profit (₹9,131 crore without it, Cityfort calculation).
4 · Where the operating profit comes from
Treasury made ₹4,897 crore of IDBI Bank's FY26 segment profit before tax, including the NSDL gain, retail banking ₹3,265 crore, corporate banking ₹3,245 crore, unallocated items ₹329 crore and other banking ₹191 crore.
5 · The one thing to watch
On 14 Oct 2026 the Cabinet Committee on Economic Affairs approved selling 60.72% of IDBI Bank to a Fairfax Financial Holdings company at ₹81 a share, and the Ministry of Finance said that day that the buyer would next present its credentials to RBI and a roadmap for meeting regulatory conditions.
Sources: From IDBI Bank's FY26 annual report and results filings, its Q2 FY27 press release, and the Ministry of Finance release of 14 Oct 2026 filed by the bank · checked
Sources (4)
- Press release: results Q2 FY27 (17 Oct 2026)
- Results XBRL Q4 FY26 standalone (quarter and full year)
- Unaudited results Q2 FY27 (quarter and half year to 30 Sep 2026), standalone and consolidated, with notes
- Bank filing of Ministry of Finance press release and FAQs "Government Approves Strategic Restructuring of IDBI Bank Ltd." (PIB, 14 Oct 2026)
01Where the money goes · FY26
Where does ₹100 of IDBI Bank's money go?
IDBI Bank · FY26
Receipt for every ₹100
| Interest paid to depositors and lenders | ₹43.3 |
|---|---|
| Employees | ₹12.2 |
| Other running costs | ₹14.2 |
| Provisions for bad loans (net write-back, adds) | ₹-3.0 |
| Tax | ₹6.7 |
| Kept as profit | ₹26.6 |
| Total | ₹100 |
Each line = amount ÷ total money in × 100. Lines may not add to exactly ₹100 because of rounding.
How this is worked out
Of every ₹100 that came in to IDBI Bank alone (standalone) in FY26. Cityfort calculation from the FY26 results filing: each line ÷ money in of ₹35,744 crore (interest earned ₹28,997 crore + other income ₹6,746 crore). Provisions were a net write-back, so that line is negative and adds to profit. Other income includes a ₹1,707 crore gain on NSDL shares; without it, operating profit would have been ₹9,131 crore instead of ₹10,838 crore (Cityfort calculation).
Save this receipt as an image
Embed this receipt or the key numbers
Paste this code into a blog or website to show the card you choose, with a link back to this page.
Each week: the next company due to report results, explained in 5 points.
We'll email you once a week with what changed on Cityfort. Facts only, no tips. Unsubscribe any time.
We store your email address with Kit, our email provider, which also records when you sign up and whether you open or click our emails. We send a confirmation email first. See our privacy policy.
02The business in one line
What does IDBI Bank do?
Borrowers pay IDBI Bank interest; in FY26, ₹43.3 of every ₹100 that came in to the bank went to depositors and lenders, and ₹26.6 was profit.
- Interest on loans and investments was ₹81.1 of every ₹100 that came in during FY26. Fees, treasury gains and other income, including a one-off gain on NSDL shares, were the other ₹18.9.
- LIC (49.24%) and the Government of India (45.48%) together held 94.71% of the shares at 30 Sep 2026. None of these shares were pledged.
03Who pays it
Who pays IDBI Bank?
IDBI Bank does not disclose how much each type of customer pays.
Home buyers
Pay interest on home loans: 28% of advances at 30 Sep 2026, Crisil says.
Other individuals
Pay interest on gold loans (9% of advances), loans against property (8%) and other retail loans (10%), Crisil says.
Small businesses (MSME) and farmers
Pay interest on MSME loans (9% of advances) and farm loans (5%), Crisil says.
Companies
Pay interest on corporate (wholesale) loans: 31% of gross advances at 30 Sep 2026.
Customers paying fees
Pay charges and fees, part of ₹6,746 crore of bank-only other income in FY26, which also includes treasury gains.
How spread out the customers are
IDBI Bank does not disclose income by customer type. The shares above are shares of loans at 30 Sep 2026 (retail 69%, corporate 31%), not shares of income.
04How it makes money
How does IDBI Bank make money?
Profit rose as bad-loan provisions shrank, then turned into write-backs
IDBI Bank earns the gap between interest charged and interest paid. That gap (NII) grew 47.5% from FY22 to FY26, while bank-only profit grew 3.9 times. Provisions went from ₹3,887 crore to a net write-back of ₹1,088 crore. FY26 also had a ₹1,707 crore NSDL gain; operating profit without it was ₹9,131 crore (Cityfort calculations from the results filings).
Provisions per ₹100 of operating profit (bank only, Cityfort calculation)
₹51.9−₹10.0
FY22 to FY26
- Savers and firms deposit money, part of it in low-interest current and savings accounts
- The bank lends, mostly to individuals, small businesses and farmers, at higher rates
- The gap is net interest income: ₹13,512 crore in FY26
- Fees, treasury gains and other income add ₹6,746 crore
- Staff and running costs come out first, then provisions for bad loans
- Fewer new bad loans and recoveries mean smaller provisions, or write-backs, and more profit
↺ Step 6 feeds back into step 1.
05Business segments · FY26
Which businesses make up IDBI Bank?
Retail banking
57.9%Loans and deposits for individuals and small firms. Revenue includes amounts charged between segments; result is profit before tax.
Revenue ₹35,031 cr · Operating profit ₹3,265 cr
Treasury
26.6%The bank's own investments and trading. FY26 includes the ₹1,707 crore gain on NSDL shares.
Revenue ₹16,110 cr · Operating profit ₹4,897 cr
Corporate and wholesale banking
14.5%Loans and services for companies. Result is profit before tax, after provisions.
Revenue ₹8,737 cr · Operating profit ₹3,245 cr
Unallocated
0.5%Income the bank does not assign to any segment.
Revenue ₹329 cr · Operating profit ₹329 cr
Other banking
0.4%Other banking business the bank reports as a separate segment.
Revenue ₹253 cr · Operating profit ₹191 cr
How the mix changed
- Retail banking
- Treasury
- Corporate and wholesale banking
- Unallocated
- Other banking
Revenue by segment, FY25 to FY26.
₹ crore
See the numbers
06The numbers · bank only (standalone) · ₹ crore
How has IDBI Bank done?
Net interest income
₹13,512 crFY26
Bank-only net interest income (NII: interest earned minus interest paid) rose from ₹9,162 crore in FY22 to ₹14,626 crore in FY25, then was ₹13,512 crore in FY26.
₹ crore · bank only (standalone) · interest earned minus interest paid
See the yearly numbers
See the quarterly numbers
Net profit
₹9,513 crFY26
Bank-only net profit rose every year, from ₹2,439 crore in FY22 to ₹9,513 crore in FY26, when provisions were a net write-back of ₹1,088 crore.
₹ crore · bank only (standalone)
See the yearly numbers
See the quarterly numbers
Net interest margin
3.77%FY26
Net interest margin, as reported, rose from 3.73% in FY22 to 4.93% in FY24, fell to 3.77% in FY26 and was 4.11% in Q2 FY27.
% · as reported by the company
See the numbers
Bad loans (gross NPA)
2.32%FY26
Gross NPA (loans not being repaid) fell from 20.16% of loans at 31 Mar 2022 to 2.12% at 30 Sep 2026.
% of loans · gross and net (after provisions) non-performing assets
See the yearly numbers
See the quarterly numbers
See all yearly numbers
EPS is group (consolidated) basic EPS, as filed.
Net interest income = interest earned on loans and investments minus interest paid on deposits and borrowings. Provisions = money set aside for loans that may not be repaid. Financial year runs April to March.
- The bank-metrics figures are IDBI Bank alone (standalone), as the bank reports its ratios; the yearly and quarterly revenue and profit under "The numbers" are for the group (consolidated). The bank alone was 98.39% of the group's net assets in FY26. Group profit for shareholders was ₹9,210 crore and bank-only profit ₹9,513 crore; the filings read do not explain the gap.
- Provisions here exclude tax; the bank's press releases show a "provisions" line that includes tax. A negative figure is a net write-back, which adds to profit: FY26 (₹1,088 crore), and Q1, Q2 and Q3 FY26 and Q1 FY27.
- One-off items: Q3 FY25 interest income includes ₹807 crore of interest on an income-tax refund, and that quarter's 5.17% margin includes it. In Q2 FY26 the bank sold 11.11% of NSDL in NSDL's IPO, for a pre-tax gain of ₹1,698.91 crore (₹1,706.91 crore for FY26); Q2 FY26 ROA of 3.55% and ROE of 29.64% include it.
- Restated figures: FY22 gross and net NPA (20.16% and 1.36%) are as shown in the FY23 annual report; the FY22 results first reported 19.14% and 1.27%. FY23 deposits (₹255,490 crore) and FY25 deposits (₹310,212 crore) and CASA (46.55%) are as regrouped in later filings, against ₹255,499 crore, ₹310,294 crore and 46.56% first filed. The filings read give no reason.
- Provision cover (PCR) includes technical write-offs, as the bank reports it. NIM is as reported (annualised for quarters). Loans are net advances from the balance sheet; gross advances were ₹259,274 crore at 31 Mar 2026.
- Crisil Ratings' core NIM, which leaves out interest on tax refunds and on bad and written-off loans, was 3.3% in FY26 against 3.7% in FY25. Crisil put FY26 credit cost at -0.2% of average total assets and said the rise in return on assets was further "supported by recoveries from written-off accounts".
Sources (23)
- Results XBRL Q4 FY22 standalone (quarter and full year)
- Press release: results Q4 FY22 and FY22 (2 May 2022)
- Annual Report FY23 (2022-23) (NSE zip)
- Results XBRL Q4 FY23 standalone (quarter and full year)
- Annual Report FY24 (2023-24)
- Press release: results Q4 FY24 and FY24 (4 May 2024)
- Results XBRL Q4 FY24 standalone (quarter and full year)
- Press release: results Q4 FY25 and FY25 (28 Apr 2025)
- Results XBRL Q4 FY25 standalone (quarter and full year)
- Press release: results Q4 FY26 and FY26 (30 Apr 2026)
- Annual Report FY26 (2025-26), incl. BRSR, standalone and consolidated statements
- Results XBRL Q4 FY26 standalone (quarter and full year)
- Results XBRL Q3 FY25 standalone
- Press release: results Q3 FY25 (20 Jan 2025)
- Results XBRL Q1 FY26 standalone
- Press release: results Q1 FY27 (18 Jul 2026)
- Results XBRL Q2 FY26 standalone
- Press release: results Q2 FY26 (18 Oct 2025)
- Results XBRL Q3 FY26 standalone
- Press release (revised): results Q3 FY26 (17 Jan 2026)
- Results XBRL Q1 FY27 standalone
- Results XBRL Q2 FY27 standalone
- Press release: results Q2 FY27 (17 Oct 2026)
07Who runs it
Who runs IDBI Bank, and did they deliver?
Rakesh Sharma
Managing Director & CEO
Re-appointed MD & CEO for three years from 19 Mar 2025, with RBI approval.
Jayakumar S. Pillai
Deputy Managing Director · since 2023
Joined from Canara Bank in Jun 2023; re-appointed for one year from 12 Jun 2026.
Sumit Phakka
Deputy Managing Director
Re-appointed as a director retiring by rotation at the 21 Jul 2026 annual meeting.
Abhijit Chakravorty and Ketan Vikamsey
Independent directors · since 2026
Appointed from 19 May 2026 and 26 Jun 2026 for two-year terms; shareholders approved both on 21 Jul 2026.
Sources (4)
- Re-appointment of Rakesh Sharma as MD & CEO for 3 years from 19 Mar 2025 (23 Jan 2025)
- Re-appointment of Jayakumar S. Pillai as DMD for 1 year from 12 Jun 2026 (19 May 2026)
- Proceedings of the 22nd AGM, 21 Jul 2026 (six resolutions; no dividend item)
- Appointment of Abhijit Chakravorty and Ketan Vikamsey as additional (independent) directors (30 Apr 2026)
08What could go wrong
What could go wrong for IDBI Bank?
- Governance
Change of control still pending
The sale of 60.72% to a Fairfax company was approved on 14 Oct 2026. The Ministry of Finance said that day that the buyer would next present its credentials to RBI and a roadmap for meeting regulatory conditions. ICRA, in a rationale the bank filed on 26 Oct 2026, said the buyer "will become the promoter" on completion, and placed its rating on watch with developing implications.
Watch RBI approval, a share purchase agreement and the next shareholding patterns filed with NSE.
- Other
Profit helped by write-backs and one-offs
FY26 bank-only profit of ₹9,513 crore included a ₹1,088 crore net write-back of provisions and a ₹1,707 crore NSDL gain. Q3 FY25 interest income included ₹807 crore of interest on a tax refund.
Watch Quarterly provisions: ₹8.55 crore in Q2 FY27, after write-backs in four of the previous five quarters.
- Pricing
Narrower lending margin
Net interest margin, as reported, fell from 4.93% in FY24 to 3.77% in FY26. It was 4.11% in Q2 FY27, against 3.71% in Q2 FY26.
Watch Quarterly NIM and cost of deposits (4.55% in Q2 FY27).
- Governance
Few shares with the public
Public shareholders held 5.29% at 30 Sep 2026; LIC and the Government held the other 94.71%.
Watch The shareholding pattern each quarter, and any change after the sale.
- Debt
Bad loans and restructured accounts
Gross NPA was ₹6,028 crore, 2.32% of loans, at 31 Mar 2026 and 2.12% at 30 Sep 2026. The bank held ₹973.20 crore of additional provisions on restructured accounts at 30 Sep 2026.
Watch Gross and net NPA each quarter.
- Execution
Staff unrest
Officers' and employees' associations gave notice of a strike on 2–3 Nov 2026, the bank disclosed on 31 Oct 2026.
Watch Further strike notices filed with NSE.
- Regulation
Regulatory penalties
RBI penalties of ₹36.30 lakh (Mar 2025) and ₹31.80 lakh (May 2025), and a ₹5.50 crore income-tax penalty for FY2020-21 (Mar 2026).
Watch Penalty disclosures filed with the exchanges.
Sources (15)
- Bank filing of Ministry of Finance press release and FAQs "Government Approves Strategic Restructuring of IDBI Bank Ltd." (PIB, 14 Oct 2026)
- ICRA rationale: long-term rating placed on Watch with Developing Implications (filed by bank 26 Oct 2026)
- Results XBRL Q4 FY26 standalone (quarter and full year)
- Unaudited results Q2 FY27 (quarter and half year to 30 Sep 2026), standalone and consolidated, with notes
- Press release (revised): results Q3 FY26 (17 Jan 2026)
- Results XBRL Q2 FY27 standalone
- Press release: results Q4 FY25 and FY25 (28 Apr 2025)
- Press release: results Q4 FY26 and FY26 (30 Apr 2026)
- Press release: results Q2 FY27 (17 Oct 2026)
- Shareholding pattern Q2 FY27 (XBRL)
- Annual Report FY26 (2025-26), incl. BRSR, standalone and consolidated statements
- Notice of proposed strike on 2-3 Nov 2026 by the officers and employees associations (31 Oct 2026)
- RBI penalty Rs 36.30 lakh under FEMA s.11(3) (21 Mar 2025)
- RBI penalty Rs 31.80 lakh under the Banking Regulation Act (3 May 2025)
- Income Tax penalty Rs 5.50 crore under s.270A for FY2020-21 (20 Mar 2026)
09Supporters and critics
What do supporters and critics point to?
What supporters point to
- Gross NPA fell from 20.16% of loans at 31 Mar 2022 to 2.12% at 30 Sep 2026; net NPA was 0.17%.
- CRAR was 27.10% and core (CET1) capital 26.55% at 30 Sep 2026.
- Bank-only profit rose every year, from ₹2,439 crore in FY22 to ₹9,513 crore in FY26.
- Crisil placed its long-term ratings on Rating Watch with Positive Implications after the sale approval (rationale filed by the bank on 24 Oct 2026). The rating covers debt, not the shares.
- Net advances grew 17.95% in the year to 30 Sep 2026 (Cityfort calculation).
What critics point to
- Net interest margin fell from 4.93% in FY24 to 3.77% in FY26; Crisil's core NIM fell from 3.7% to 3.3% in FY26.
- FY26 profit included a ₹1,088 crore net write-back of provisions and a ₹1,707 crore NSDL gain.
- Bank-only profit was ₹4,321 crore in H1 FY27, down from ₹5,635 crore in H1 FY26, which included the NSDL gain.
- The CASA share of deposits fell from 56.77% at 31 Mar 2022 to 43.82% at 30 Sep 2026.
- Public shareholders hold 5.29%, no chairman has been named since Jul 2025, and no earnings call has been filed since Oct 2022.
10What to watch next
What should you watch next at IDBI Bank?
Next event
Q3 FY27 results (date not announced yet)
Date not announced yet.
The Fairfax sale
Approved on 14 Oct 2026; the Ministry of Finance said the buyer would next present its credentials to RBI and a roadmap for meeting regulatory conditions. Promoter holding was 94.71% at 30 Sep 2026.
Provisions
Provisions were net write-backs in four of the five quarters to Q1 FY27, then a ₹8.55 crore charge in Q2 FY27.
Net interest margin
It was 4.11% in Q2 FY27, against 3.71% a year earlier and 3.77% for FY26.
11Key facts
Key facts about IDBI Bank
- What does IDBI Bank do?
- IDBI Bank is a bank that takes deposits and lends to individuals, small businesses, farmers and companies. At 30 Sep 2026 IDBI Bank held deposits of ₹355,684 crore and net advances (loans) of ₹271,533 crore.
- How does IDBI Bank make money?
- IDBI Bank earns mainly the gap between the interest it charges borrowers and the interest it pays depositors and lenders. In FY26 IDBI Bank's own net interest income was ₹13,512 crore, and its other income, such as fees and treasury gains, was ₹6,746 crore.
- Who are IDBI Bank's customers?
- At 30 Sep 2026, retail borrowers had 69% of IDBI Bank's gross advances and corporate borrowers 31%, its Q2 FY27 press release says. Crisil Ratings puts home loans at 28% of IDBI Bank's advances, small businesses (MSME) and gold loans at 9% each, and loans against property at 8%.
- How big is IDBI Bank?
- IDBI Bank's group net profit was ₹9,210 crore in FY26, up from ₹7,631 crore in FY25. At 31 Mar 2026 IDBI Bank had 2,174 branches, 3,011 ATMs and 18,538 permanent employees.
- Who owns IDBI Bank?
- LIC held 49.24% of IDBI Bank and the Government of India 45.48% at 30 Sep 2026; together, as promoters, they held 94.71% and none of these shares were pledged. IDBI Bank had 703,415 shareholders on that date.
- How many of IDBI Bank's loans have gone bad?
- IDBI Bank's gross NPA (loans not being repaid) was 2.12% of its loans at 30 Sep 2026, down from 20.16% at 31 Mar 2022. After money already set aside, IDBI Bank's net NPA was 0.17%.
- What is IDBI Bank's net interest margin?
- Net interest margin is net interest income as a share of the money a bank has lent and invested. IDBI Bank reported 3.77% for FY26, down from 4.93% in FY24, and 4.11% for Q2 FY27 (Jul–Sep 2026).
- Does IDBI Bank pay a dividend?
- IDBI Bank paid ₹1 a share for FY23, ₹1.50 for FY24 and ₹2.10 for FY25. IDBI Bank's FY26 annual report shows no dividend for FY26, and its 21 Jul 2026 annual meeting had no dividend resolution.
- Who runs IDBI Bank?
- Rakesh Sharma is IDBI Bank's MD & CEO; IDBI Bank re-appointed him for three years from 19 Mar 2025. Jayakumar S. Pillai and Sumit Phakka are IDBI Bank's Deputy Managing Directors.
Sources (14)
- Press release: results Q2 FY27 (17 Oct 2026)
- Results XBRL Q4 FY26 standalone (quarter and full year)
- Press release: results Q4 FY26 and FY26 (30 Apr 2026)
- Crisil Ratings rationale: long-term debt placed on Rating Watch with Positive Implications, CD A1+ reaffirmed (filed by bank 24 Oct 2026)
- Results XBRL Q4 FY26 consolidated (quarter and full year)
- Results XBRL Q4 FY25 consolidated (quarter and full year)
- Annual Report FY26 (2025-26), incl. BRSR, standalone and consolidated statements
- Shareholding pattern Q2 FY27 (XBRL)
- Annual Report FY23 (2022-23) (NSE zip)
- Press release: results Q4 FY25 and FY25 (28 Apr 2025)
- Annual Report FY24 (2023-24)
- Proceedings of the 22nd AGM, 21 Jul 2026 (six resolutions; no dividend item)
- Re-appointment of Rakesh Sharma as MD & CEO for 3 years from 19 Mar 2025 (23 Jan 2025)
- Re-appointment of Jayakumar S. Pillai as DMD for 1 year from 12 Jun 2026 (19 May 2026)
Terms on this page
- CASA ratio
- Credit rating
- FII and DII holding
- Gross and net NPA
- Market capitalisation
- Net interest margin (NIM)
- Net profit
- Promoter holding
- Provision coverage ratio (PCR)
- Public shareholding
Each explains the term in plain English, with the same number from other companies on Cityfort.
Go deeper
More detail from the same filings. Open any section.
12What it sells
12What it sells
What does IDBI Bank sell?
Home loans and other retail loans
Retail loans were 69% of gross advances at 30 Sep 2026. Crisil puts home loans at 28%, loans against property at 8%, gold loans at 9% and other retail loans at 10%.
Loans to small businesses and farmers
Crisil counts small-business (MSME) loans, 9% of advances, and farm loans, 5%, within retail at 30 Sep 2026.
Loans to companies
Corporate (wholesale) loans were 31% of gross advances at 30 Sep 2026. The corporate segment's FY26 profit before tax was ₹3,245 crore.
Treasury
The bank's own investments in bonds and other securities: ₹128,011 crore at 31 Mar 2026. The treasury segment's FY26 profit before tax was ₹4,897 crore, including a gain on NSDL shares.
Deposits: savings, current and fixed
₹355,684 crore at 30 Sep 2026. 43.82% sat in current and savings accounts (CASA), which pay little or no interest.
Group companies
Subsidiaries include IDBI Capital Markets & Securities (broking), IDBI Asset Management (a mutual fund), IDBI Intech and IDBI Trusteeship Services.
What it does
- Does: Takes deposits from people and firms across 36 states and union territories
- Does: Lends for homes, gold, property, small businesses, farms and companies
- Does: Invests in government bonds and other securities through its treasury
- Does: Runs a mutual fund and a broking firm through subsidiaries
What it does not do
- Does not: Count as a public sector bank: RBI classified it as a private sector bank from Mar 2019, ICRA says
- Does not: Belong to the government alone: LIC is the promoter with management control and the Government the co-promoter
- Does not: Still own its NSDL stake: it sold 11.11% of NSDL in NSDL's IPO in Q2 FY26
Sources (5)
- Press release: results Q2 FY27 (17 Oct 2026)
- Crisil Ratings rationale: long-term debt placed on Rating Watch with Positive Implications, CD A1+ reaffirmed (filed by bank 24 Oct 2026)
- Results XBRL Q4 FY26 standalone (quarter and full year)
- Annual Report FY26 (2025-26), incl. BRSR, standalone and consolidated statements
- Unaudited results Q2 FY27 (quarter and half year to 30 Sep 2026), standalone and consolidated, with notes
13How the money flows
13How the money flows · FY26
How does money flow through IDBI Bank?
Money in
- Interest earned (loans, investments and other)₹28,997 cr
- Fees, treasury gains and other income (incl. NSDL share-sale gain)₹6,746 cr
The company
IDBI Bank
₹35,743 cr came in
Money out
- Interest paid to depositors and lenders₹15,486 cr
- Employees₹4,358 cr
- Other running costs₹5,062 cr
- Provisions for bad loans and other risks (a net write-back in FY26, adds)−₹1,088 cr
- Tax₹2,413 cr
- Net profit (bank only)₹9,513 cr
- These are IDBI Bank's own FY26 accounts (standalone), without its subsidiaries and associates.
- Savers, companies and other lenders provide the money. In FY26 the bank paid them ₹15,486 crore of interest.
- It lends and invests that money. Interest earned was ₹28,997 crore, and fees and other income added ₹6,746 crore.
- Staff cost ₹4,358 crore and other running costs ₹5,062 crore, leaving ₹10,838 crore of operating profit.
- Provisions were a net write-back of ₹1,088 crore, which added to profit. After ₹2,413 crore of tax, ₹9,513 crore was profit.
14What it needs to run
14What it needs to run
What does IDBI Bank need to run?
A banking licence and capital
RBI requires banks to hold their own money (capital) against risk-weighted loans and assets. That share is called CRAR. IDBI Bank's was 27.10% at 30 Sep 2026, and its core (CET1) part 26.55%.
Deposits
Deposits of ₹355,684 crore at 30 Sep 2026 fund most of its lending. Its cost of deposits was 4.55% in Q2 FY27, against 4.69% a year earlier.
Borrowings
Bank-only borrowings were ₹23,705 crore at 31 Mar 2026, against deposits of ₹347,163 crore.
Branches and ATMs
2,174 branches, 69 IDBI SAMEEP outlets, one unit in GIFT City and 3,011 ATMs at 31 Mar 2026, in 36 states and union territories.
People
18,538 permanent employees and 1,585 others at 31 Mar 2026. Staff cost ₹4,358 crore in FY26, 46.3% of running costs (Cityfort calculation).
15Where growth could come from
15Where growth could come from
Where could IDBI Bank's growth come from?
IDBI Bank has not filed an earnings call transcript or investor presentation on NSE since Oct 2022, so this page has no recent management guidance to quote.
Retail-led loan growth
WorkingNet advances +17.95% in the year to 30 Sep 2026 (Cityfort calculation)
Net advances rose from ₹230,220 crore to ₹271,533 crore. Retail loans were 69% of gross advances and corporate loans 31%.
Status: Working, on track against what the company said.
Deposit growth
MixedDeposits +17.23% to ₹355,684 crore (Sep 2026, Cityfort calculation)
Deposits grew from ₹303,408 crore a year earlier, as shown in the Q2 FY27 release. The CASA share was 43.82%, against 45.79% a year earlier.
Status: Mixed, partly on track.
A new owner's plans
NewSale of 60.72% approved on 14 Oct 2026
Crisil, in a rationale the bank filed on 24 Oct 2026, says Fairfax proposes to contribute its interests in Go Digit General Insurance, Go Digit Life Insurance and IIFL Capital Services to the bank at market prices, subject to regulatory approvals.
Status: New, recently announced.
Status compares progress with what the company itself said it would do: Working = on track against what the company said; Mixed = partly on track; Behind = behind the company's own plan; New = recently announced; Early = too early to judge.
Sources (4)
- Press release: results Q2 FY27 (17 Oct 2026)
- Press release: results Q2 FY26 (18 Oct 2025)
- Bank filing of Ministry of Finance press release and FAQs "Government Approves Strategic Restructuring of IDBI Bank Ltd." (PIB, 14 Oct 2026)
- Crisil Ratings rationale: long-term debt placed on Rating Watch with Positive Implications, CD A1+ reaffirmed (filed by bank 24 Oct 2026)
16Financial strength: capital, bad loans, deposits
16Financial strength · FY26
How strong is IDBI Bank's balance sheet?
- Loans given (advances)₹2.54 lakh cr
- Deposits taken₹3.47 lakh cr
Loans were 73% of deposits (credit–deposit ratio) at the end of FY26.
- Capital adequacy (CRAR)
- 26.65%
- capital as a share of risk-weighted loans; regulators set a minimum
- Core equity (CET1)
- 25.56%
- the highest-quality part of that capital
- Gross NPA
- 2.32%
- loans not being repaid, as % of all loans
- Net NPA
- 0.15%
- the same, after money already set aside
- Provision cover
- 99.39%
- share of bad loans already provided for
- CASA ratio
- 44.59%
- deposits in current and savings accounts, which usually pay low interest
- Cost to income
- 46.5%
- ₹ of running costs per ₹100 of income after interest paid
- Return on assets
- 2.27%
- profit as % of everything the lender owns
- Return on equity
- 18.93%
- profit as % of shareholders' money
Figures as on FY26 year end (standalone, as banks report these ratios). Reported by the company; see the dates on each source.
17Who owns it
17Who owns it · Q2 FY27
Who owns IDBI Bank?
- Promoters (founders or parent company)94.7%
- Foreign institutions (FII)0.5%
- Indian institutions (DII)0.2%
- Public and others4.6%
Promoter pledge
No promoter shares were pledged in Q2 FY27.
How ownership changed
* Pledged = share of the promoters' own holding reported as pledged. In older filings this can include shares “otherwise encumbered”; the governance flags say when.
Sources (12)
- Shareholding pattern Q2 FY27 (XBRL)
- Shareholding pattern Q1 FY27 (XBRL)
- Shareholding pattern Q4 FY26 (XBRL)
- Shareholding pattern Q3 FY26 (XBRL)
- Shareholding pattern Q2 FY26 (XBRL)
- Shareholding pattern Q1 FY26 (XBRL)
- Shareholding pattern Q4 FY25 (XBRL)
- Shareholding pattern Q3 FY25 (XBRL)
- Shareholding pattern Q2 FY25 (XBRL)
- Shareholding pattern Q1 FY25 (XBRL)
- Shareholding pattern Q4 FY24 (XBRL)
- Shareholding pattern Q3 FY24 (XBRL)
18What it does with profit
18What it does with profit
What does IDBI Bank do with its profit?
Dividend per share
₹0.00FY26
Dividend paid for each share, by financial year.
₹ per share
See the numbers
No buybacks or fund raises in the period covered.
19Governance signals
19Governance signals
What do IDBI Bank's governance filings show?
- Auditor
- Chokshi & Chokshi LLP and Suri & Co (joint statutory auditors, Q2 FY27 review)
- Auditor changes
- None in the period covered
- Audit qualifications
- None reported
- Related-party dealings
- IDBI Bank's group companies are its main related parties. It fully owns IDBI Capital Markets & Securities, IDBI Intech and IDBI MF Trustee, and holds 66.67% of IDBI Asset Management (IDBI Capital holds the rest) and 54.70% of IDBI Trusteeship Services. Associates are North Eastern Development Finance Corporation (25.00%) and Biotech Consortium India (27.93%).
- Credit rating
- Crisil Ratings Crisil AA (long-term debt); Crisil A1+ (certificates of deposit) (outlook Rating Watch with Positive Implications), 24 Oct 2026
A credit rating describes the company's ability to repay debt. It is not a rating of the share.
Flags to know about
other · 14 Oct 2026
Sale of 60.72% to a Fairfax company approved
On 14 Oct 2026 the Cabinet Committee on Economic Affairs approved M/s 10955230 Canada Inc. (parent Fairfax Financial Holdings Ltd.) as buyer of 60.72%: 30.48% from the Government and 30.24% from LIC, at ₹81 a share, ₹52,878 crore in all. The Ministry of Finance said on 14 Oct 2026 that the buyer would next present its credentials to RBI and a roadmap for meeting regulatory conditions. On 15 Oct 2026 the bank told NSE it "has had no role" in the process.
disclosure · 30 Sep 2026
Public shareholders hold 5.29%
The promoters, LIC (49.24%) and the Government (45.48%), held 94.71% at 30 Sep 2026 and public shareholders 5.29%, the shareholding pattern shows. After the sale, the Government is to keep 15% and LIC 19%, and both are to become public shareholders, the Ministry of Finance said on 14 Oct 2026.
regulatory · 3 May 2025
RBI penalties
RBI imposed a penalty of ₹36.30 lakh under section 11(3) of FEMA (disclosed 21 Mar 2025) and one of ₹31.80 lakh under the Banking Regulation Act for charging interest above the applicable lending rate to farmers on Kisan Credit Card loans with limits up to ₹3 lakh (disclosed 3 May 2025).
regulatory · 28 May 2026
Income-tax and subsidiary penalties
The income-tax department levied a ₹5.50 crore penalty under section 270A for FY2020-21 (disclosed 20 Mar 2026); the bank said it "is evaluating appropriate legal remedy, including appeal". SEBI imposed a ₹2 lakh penalty on the subsidiary IDBI Trusteeship Services (disclosed 28 May 2026).
other · 12 Nov 2026
No chairman named since Jul 2025
Part-time Chairman T. N. Manoharan died on 30 Jul 2025. The bank's filings read for this page, up to 12 Nov 2026, name no successor.
disclosure · 12 Nov 2026
No earnings calls or presentations since Oct 2022
IDBI Bank publishes results with a press release (latest 17 Oct 2026). No earnings call transcript or investor presentation was found among its NSE filings after Oct 2022.
other · 31 Oct 2026
Strike notice
On 31 Oct 2026 the bank disclosed notice of a proposed strike on 2–3 Nov 2026 by its officers' and employees' associations, "in support of their demands".
Sources (13)
- Unaudited results Q2 FY27 (quarter and half year to 30 Sep 2026), standalone and consolidated, with notes
- Annual Report FY26 (2025-26), incl. BRSR, standalone and consolidated statements
- Crisil Ratings rationale: long-term debt placed on Rating Watch with Positive Implications, CD A1+ reaffirmed (filed by bank 24 Oct 2026)
- Bank filing of Ministry of Finance press release and FAQs "Government Approves Strategic Restructuring of IDBI Bank Ltd." (PIB, 14 Oct 2026)
- Reply to NSE clarification on news of cabinet approval of the stake sale (15 Oct 2026)
- Shareholding pattern Q2 FY27 (XBRL)
- RBI penalty Rs 36.30 lakh under FEMA s.11(3) (21 Mar 2025)
- RBI penalty Rs 31.80 lakh under the Banking Regulation Act (3 May 2025)
- Income Tax penalty Rs 5.50 crore under s.270A for FY2020-21 (20 Mar 2026)
- SEBI penalty Rs 2 lakh on subsidiary IDBI Trusteeship Services (28 May 2026)
- Demise of Part-time Chairman T. N. Manoharan (30 Jul 2025)
- Press release: results Q2 FY27 (17 Oct 2026)
- Notice of proposed strike on 2-3 Nov 2026 by the officers and employees associations (31 Oct 2026)
20What the market paid
20What the market paid · price as of 11 Nov 2026
What did the market pay for IDBI Bank on 11 Nov 2026?
Price as of 11 Nov 2026 (shown for education; prices change daily).
Price as of 11 Nov 2026: ₹79.47, the NSE closing price. Market value: ₹85,449 crore, a Cityfort calculation from that price and the 10,752,402,175 shares in the 30 Sep 2026 shareholding pattern. P/E is the share price divided by one year's profit per share: here FY26 group EPS of ₹8.57, giving 9.27 (Cityfort calculation). P/B is not shown, because the bank's filings use different definitions of net worth. EV/EBITDA is not shown, because interest is a bank's main running cost.
- Share price
- ₹79.47
- Market value (market cap)
- ₹85,449 cr
- P/E
- 9.3×
Source: NSE historical price data, IDBI EQ, 1 Oct to 11 Nov 2026 (close 11 Nov 2026: Rs 79.47); Shareholding pattern Q2 FY27 (XBRL); Results XBRL Q4 FY26 consolidated (quarter and full year)
21How it got here
21How it got here
How did IDBI Bank get here?
1964
Milestone
Set up by the government
The Industrial Development Bank of India was constituted under the IDBI Act, 1964, Crisil notes.
2004
Business-model change
Became a banking company
Reconstituted as a banking company on 1 Oct 2004; the present company was incorporated on 27 Sep 2004.
2017
Crisis
Under RBI's Prompt Corrective Action
RBI placed the bank under Prompt Corrective Action on 5 May 2017; RBI lifted it by a letter of 10 Mar 2021, with conditions and monitoring.
2019
Business-model change
LIC takes control
LIC raised its stake to 51% in Jan 2019, and RBI classified IDBI as a private sector bank from Mar 2019, ICRA says.
2021
Milestone
Sale approved in principle
On 5 May 2021 the bank disclosed in-principle cabinet approval for selling a stake with management control.
2022
Crisis
Bad loans at 20.16%
Gross NPA was 20.16% of loans at 31 Mar 2022, as restated. In Oct 2022 the Government invited expressions of interest for 60.72% (30.48% from the Government, 30.24% from LIC).
2025
Milestone
NSDL stake sold
In Q2 FY26 the bank sold 11.11% of NSDL in NSDL's IPO, for a pre-tax gain of ₹1,698.91 crore.
2026
Business-model change
Fairfax buyer approved
On 14 Oct 2026 the cabinet committee approved a Fairfax Financial Holdings company as buyer of 60.72% at ₹81 a share.
Sources (9)
- Crisil Ratings rationale: long-term debt placed on Rating Watch with Positive Implications, CD A1+ reaffirmed (filed by bank 24 Oct 2026)
- Annual Report FY26 (2025-26), incl. BRSR, standalone and consolidated statements
- Bank filing of Ministry of Finance press release and FAQs "Government Approves Strategic Restructuring of IDBI Bank Ltd." (PIB, 14 Oct 2026)
- ICRA rationale: long-term rating placed on Watch with Developing Implications (filed by bank 26 Oct 2026)
- Strategic disinvestment and transfer of management control: CCEA in-principle approval (5 May 2021)
- Annual Report FY23 (2022-23) (NSE zip)
- Strategic disinvestment: PIM issued for Expressions of Interest; GoI to sell 30.48%, LIC 30.24% (7 Oct 2022)
- Unaudited results Q2 FY27 (quarter and half year to 30 Sep 2026), standalone and consolidated, with notes
- Press release: results Q2 FY27 (17 Oct 2026)
22Sources and changes
Where every number on this page comes from
Sources (64 documents)
- S1Annual Report FY26 (2025-26), incl. BRSR, standalone and consolidated statements · NSE (company filing, nsearchives.nseindia.com) · Tier 1: company or exchange filing · 25 Jun 2026
- S3Annual Report FY24 (2023-24) · NSE (company filing, nsearchives.nseindia.com) · Tier 1: company or exchange filing · 28 Jun 2024
- S4Annual Report FY23 (2022-23) (NSE zip) · NSE (company filing, nsearchives.nseindia.com) · Tier 1: company or exchange filing · 19 Jun 2023
- S6Unaudited results Q2 FY27 (quarter and half year to 30 Sep 2026), standalone and consolidated, with notes · NSE (company filing, nsearchives.nseindia.com) · Tier 1: company or exchange filing · 17 Oct 2026
- S7Press release: results Q2 FY27 (17 Oct 2026) · NSE (company filing, nsearchives.nseindia.com) · Tier 1: company or exchange filing · 17 Oct 2026
- S8Press release: results Q1 FY27 (18 Jul 2026) · NSE (company filing, nsearchives.nseindia.com) · Tier 1: company or exchange filing · 18 Jul 2026
- S9Press release: results Q4 FY26 and FY26 (30 Apr 2026) · NSE (company filing, nsearchives.nseindia.com) · Tier 1: company or exchange filing · 30 Apr 2026
- S10Press release (revised): results Q3 FY26 (17 Jan 2026) · NSE (company filing, nsearchives.nseindia.com) · Tier 1: company or exchange filing · 17 Jan 2026
- S11Press release: results Q2 FY26 (18 Oct 2025) · NSE (company filing, nsearchives.nseindia.com) · Tier 1: company or exchange filing · 18 Oct 2025
- S12Press release: results Q4 FY25 and FY25 (28 Apr 2025) · NSE (company filing, nsearchives.nseindia.com) · Tier 1: company or exchange filing · 28 Apr 2025
- S13Press release: results Q3 FY25 (20 Jan 2025) · NSE (company filing, nsearchives.nseindia.com) · Tier 1: company or exchange filing · 20 Jan 2025
- S14Press release: results Q4 FY24 and FY24 (4 May 2024) · NSE (company filing, nsearchives.nseindia.com) · Tier 1: company or exchange filing · 4 May 2024
- S15Press release: results Q4 FY22 and FY22 (2 May 2022) · NSE (company filing, nsearchives.nseindia.com) · Tier 1: company or exchange filing · 2 May 2022
- S16Results XBRL Q2 FY27 standalone · NSE (company filing, nsearchives.nseindia.com) · Tier 1: company or exchange filing · 17 Oct 2026
- S17Results XBRL Q1 FY27 standalone · NSE (company filing, nsearchives.nseindia.com) · Tier 1: company or exchange filing · 18 Jul 2026
- S18Results XBRL Q4 FY26 standalone (quarter and full year) · NSE (company filing, nsearchives.nseindia.com) · Tier 1: company or exchange filing · 30 Apr 2026
- S19Results XBRL Q3 FY26 standalone · NSE (company filing, nsearchives.nseindia.com) · Tier 1: company or exchange filing · 17 Jan 2026
- S20Results XBRL Q2 FY26 standalone · NSE (company filing, nsearchives.nseindia.com) · Tier 1: company or exchange filing · 18 Oct 2025
- S21Results XBRL Q1 FY26 standalone · NSE (company filing, nsearchives.nseindia.com) · Tier 1: company or exchange filing · 21 Jul 2025
- S22Results XBRL Q4 FY25 standalone (quarter and full year) · NSE (company filing, nsearchives.nseindia.com) · Tier 1: company or exchange filing · 28 Apr 2025
- S23Results XBRL Q3 FY25 standalone · NSE (company filing, nsearchives.nseindia.com) · Tier 1: company or exchange filing · 20 Jan 2025
- S24Results XBRL Q4 FY24 standalone (quarter and full year) · NSE (company filing, nsearchives.nseindia.com) · Tier 1: company or exchange filing · 4 May 2024
- S25Results XBRL Q4 FY23 standalone (quarter and full year) · NSE (company filing, nsearchives.nseindia.com) · Tier 1: company or exchange filing · 29 Apr 2023
- S26Results XBRL Q4 FY22 standalone (quarter and full year) · NSE (company filing, nsearchives.nseindia.com) · Tier 1: company or exchange filing · 2 May 2022
- S27Results XBRL Q2 FY27 consolidated · NSE (company filing, nsearchives.nseindia.com) · Tier 1: company or exchange filing · 17 Oct 2026
- S28Results XBRL Q1 FY27 consolidated · NSE (company filing, nsearchives.nseindia.com) · Tier 1: company or exchange filing · 18 Jul 2026
- S29Results XBRL Q4 FY26 consolidated (quarter and full year) · NSE (company filing, nsearchives.nseindia.com) · Tier 1: company or exchange filing · 30 Apr 2026
- S30Results XBRL Q3 FY26 consolidated · NSE (company filing, nsearchives.nseindia.com) · Tier 1: company or exchange filing · 17 Jan 2026
- S31Results XBRL Q2 FY26 consolidated · NSE (company filing, nsearchives.nseindia.com) · Tier 1: company or exchange filing · 18 Oct 2025
- S32Results XBRL Q1 FY26 consolidated · NSE (company filing, nsearchives.nseindia.com) · Tier 1: company or exchange filing · 21 Jul 2025
- S33Results XBRL Q4 FY25 consolidated (quarter and full year) · NSE (company filing, nsearchives.nseindia.com) · Tier 1: company or exchange filing · 28 Apr 2025
- S34Results XBRL Q3 FY25 consolidated · NSE (company filing, nsearchives.nseindia.com) · Tier 1: company or exchange filing · 20 Jan 2025
- S35Results XBRL Q4 FY24 consolidated (quarter and full year) · NSE (company filing, nsearchives.nseindia.com) · Tier 1: company or exchange filing · 4 May 2024
- S36Results XBRL Q4 FY23 consolidated (quarter and full year) · NSE (company filing, nsearchives.nseindia.com) · Tier 1: company or exchange filing · 29 Apr 2023
- S37Results XBRL Q4 FY22 consolidated (quarter and full year) · NSE (company filing, nsearchives.nseindia.com) · Tier 1: company or exchange filing · 2 May 2022
- S38Shareholding pattern Q2 FY27 (XBRL) · NSE (company filing, nsearchives.nseindia.com) · Tier 1: company or exchange filing · 16 Oct 2026
- S39Shareholding pattern Q1 FY27 (XBRL) · NSE (company filing, nsearchives.nseindia.com) · Tier 1: company or exchange filing · 14 Jul 2026
- S40Shareholding pattern Q4 FY26 (XBRL) · NSE (company filing, nsearchives.nseindia.com) · Tier 1: company or exchange filing · 18 Apr 2026
- S41Shareholding pattern Q3 FY26 (XBRL) · NSE (company filing, nsearchives.nseindia.com) · Tier 1: company or exchange filing · 13 Jan 2026
- S42Shareholding pattern Q2 FY26 (XBRL) · NSE (company filing, nsearchives.nseindia.com) · Tier 1: company or exchange filing · 18 Oct 2025
- S43Shareholding pattern Q1 FY26 (XBRL) · NSE (company filing, nsearchives.nseindia.com) · Tier 1: company or exchange filing · 19 Jul 2025
- S44Shareholding pattern Q4 FY25 (XBRL) · NSE (company filing, nsearchives.nseindia.com) · Tier 1: company or exchange filing · 8 Apr 2025
- S45Shareholding pattern Q3 FY25 (XBRL) · NSE (company filing, nsearchives.nseindia.com) · Tier 1: company or exchange filing · 7 Jan 2025
- S46Shareholding pattern Q2 FY25 (XBRL) · NSE (company filing, nsearchives.nseindia.com) · Tier 1: company or exchange filing · 11 Oct 2024
- S47Shareholding pattern Q1 FY25 (XBRL) · NSE (company filing, nsearchives.nseindia.com) · Tier 1: company or exchange filing · 12 Jul 2024
- S48Shareholding pattern Q4 FY24 (XBRL) · NSE (company filing, nsearchives.nseindia.com) · Tier 1: company or exchange filing · 18 Apr 2024
- S49Shareholding pattern Q3 FY24 (XBRL) · NSE (company filing, nsearchives.nseindia.com) · Tier 1: company or exchange filing · 5 Jan 2024
- S50Crisil Ratings rationale: long-term debt placed on Rating Watch with Positive Implications, CD A1+ reaffirmed (filed by bank 24 Oct 2026) · NSE (company filing, nsearchives.nseindia.com) · Tier 2: rating agency or regulator · 24 Oct 2026
- S51ICRA rationale: long-term rating placed on Watch with Developing Implications (filed by bank 26 Oct 2026) · NSE (company filing, nsearchives.nseindia.com) · Tier 2: rating agency or regulator · 26 Oct 2026
- S52Bank filing of Ministry of Finance press release and FAQs "Government Approves Strategic Restructuring of IDBI Bank Ltd." (PIB, 14 Oct 2026) · NSE (company filing, nsearchives.nseindia.com) · Tier 1: company or exchange filing · 14 Oct 2026
- S53Reply to NSE clarification on news of cabinet approval of the stake sale (15 Oct 2026) · NSE (company filing, nsearchives.nseindia.com) · Tier 1: company or exchange filing · 15 Oct 2026
- S59Strategic disinvestment and transfer of management control: CCEA in-principle approval (5 May 2021) · NSE (company filing, nsearchives.nseindia.com) · Tier 1: company or exchange filing · 5 May 2021
- S60Strategic disinvestment: PIM issued for Expressions of Interest; GoI to sell 30.48%, LIC 30.24% (7 Oct 2022) · NSE (company filing, nsearchives.nseindia.com) · Tier 1: company or exchange filing · 7 Oct 2022
- S65Re-appointment of Rakesh Sharma as MD & CEO for 3 years from 19 Mar 2025 (23 Jan 2025) · NSE (company filing, nsearchives.nseindia.com) · Tier 1: company or exchange filing · 23 Jan 2025
- S66Demise of Part-time Chairman T. N. Manoharan (30 Jul 2025) · NSE (company filing, nsearchives.nseindia.com) · Tier 1: company or exchange filing · 30 Jul 2025
- S67Appointment of Abhijit Chakravorty and Ketan Vikamsey as additional (independent) directors (30 Apr 2026) · NSE (company filing, nsearchives.nseindia.com) · Tier 1: company or exchange filing · 30 Apr 2026
- S68Re-appointment of Jayakumar S. Pillai as DMD for 1 year from 12 Jun 2026 (19 May 2026) · NSE (company filing, nsearchives.nseindia.com) · Tier 1: company or exchange filing · 19 May 2026
- S69Proceedings of the 22nd AGM, 21 Jul 2026 (six resolutions; no dividend item) · NSE (company filing, nsearchives.nseindia.com) · Tier 1: company or exchange filing · 21 Jul 2026
- S70RBI penalty Rs 36.30 lakh under FEMA s.11(3) (21 Mar 2025) · NSE (company filing, nsearchives.nseindia.com) · Tier 1: company or exchange filing · 21 Mar 2025
- S71RBI penalty Rs 31.80 lakh under the Banking Regulation Act (3 May 2025) · NSE (company filing, nsearchives.nseindia.com) · Tier 1: company or exchange filing · 3 May 2025
- S72Income Tax penalty Rs 5.50 crore under s.270A for FY2020-21 (20 Mar 2026) · NSE (company filing, nsearchives.nseindia.com) · Tier 1: company or exchange filing · 20 Mar 2026
- S73SEBI penalty Rs 2 lakh on subsidiary IDBI Trusteeship Services (28 May 2026) · NSE (company filing, nsearchives.nseindia.com) · Tier 1: company or exchange filing · 28 May 2026
- S74Notice of proposed strike on 2-3 Nov 2026 by the officers and employees associations (31 Oct 2026) · NSE (company filing, nsearchives.nseindia.com) · Tier 1: company or exchange filing · 31 Oct 2026
- S75NSE historical price data, IDBI EQ, 1 Oct to 11 Nov 2026 (close 11 Nov 2026: Rs 79.47) · NSE (www.nseindia.com) · Tier 1: company or exchange filing · 11 Nov 2026
Changes to this page (v1 · 12 Nov 2026)
- v1 · 12 Nov 2026First version. (first version)
Numbers come only from tier 1 and tier 2 sources. Read how we research.
Disclaimer
For learning only. Cityfort is not a SEBI-registered adviser and does not recommend buying or selling any security. Prices shown are dated and may be out of date.
Investing in securities involves risk, including loss of capital. Before making any investment decision, do your own research and consider consulting a SEBI-registered investment adviser.
Cityfort, its owners and contributors may or may not hold securities of companies covered. Content is not an offer or solicitation to buy or sell any security.
Read the full disclaimerHide the full disclaimer
Cityfort publishes educational content that explains how listed companies work. Cityfort is not registered with the Securities and Exchange Board of India (SEBI) as an Investment Adviser or Research Analyst and does not provide investment advice, recommendations, ratings, price targets or any opinion on whether to buy, sell or hold any security.
All information is taken from publicly available sources, mainly company filings on BSE and NSE, which are listed on each page with dates. We work to keep it accurate and correct errors publicly, but we do not guarantee that it is complete, accurate or up to date. Any market price or price-based ratio shown is dated, may be out of date by the time you read it, and is included only to explain concepts.
Statements by company management are reported as statements, with their date and source; they are not our forecasts.