Financial Services · NSE: INDIANB · BSE: 532814
Indian Bank: how the business works
Indian Bank, a Chennai-based public-sector bank, lends to farmers, households, small businesses and companies, earning ₹12,156 crore of bank-only profit in FY26.
Follow Indian Bank
Email me when Indian Bank's page is updated after results.
We store your email address with Kit, our email provider, which also records when you sign up and whether you open or click our emails. We send a confirmation email first. See our privacy policy.
Indian Bank · Chennai, Tamil Nadu · Founded 1907
Updated for Q2 FY27 · checked
- Deposits, 30 Sep 2026
- ₹874,036 cr
- Loans (gross advances), 30 Sep 2026
- ₹721,982 cr
- Bank-only net profit, FY26
- ₹12,156 cr
- Branches in India, Sep 2026
- 6,017
- Promoter (Government of India), Sep 2026
- 73.84%
The short version
Indian Bank in 5 points
1 · What it sells
Indian Bank lends to farmers, households, small businesses and companies, ₹721,982 crore of gross advances at 30 Sep 2026, and earned ₹9,991 crore of fees, treasury and other income in FY26; ₹874,036 crore of deposits fund it, through 6,017 branches in India.
2 · Who pays it
Borrowers and bond issuers pay Indian Bank, and its FY26 segment income was 41.6% retail banking, 32.3% corporate and wholesale banking, 24.2% treasury and 1.9% other banking.
3 · What it keeps from ₹100
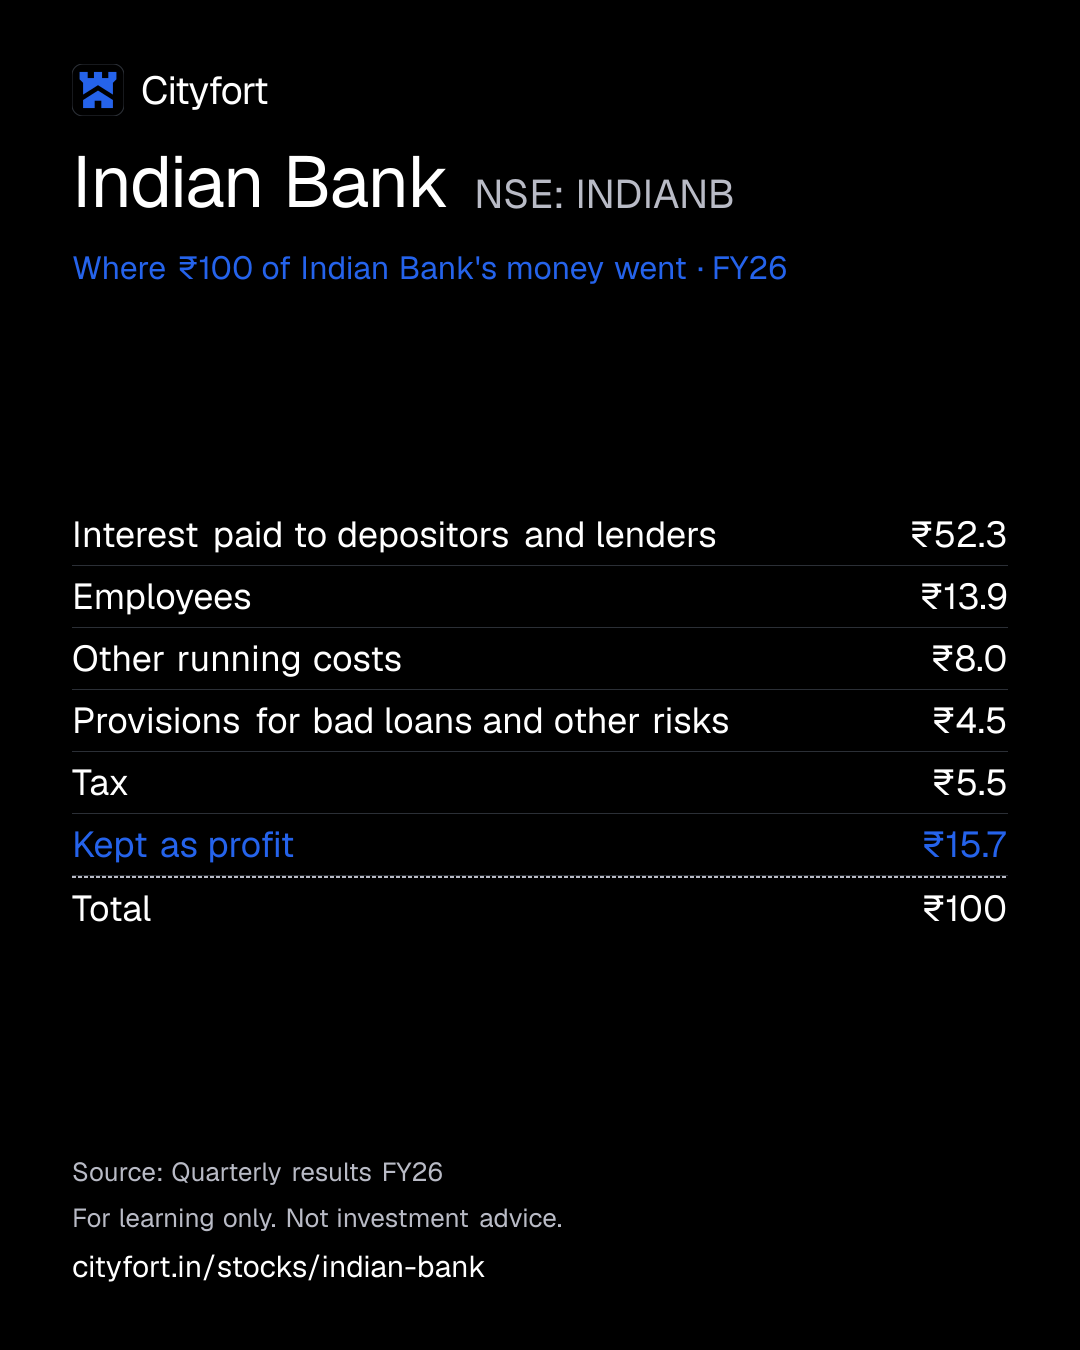
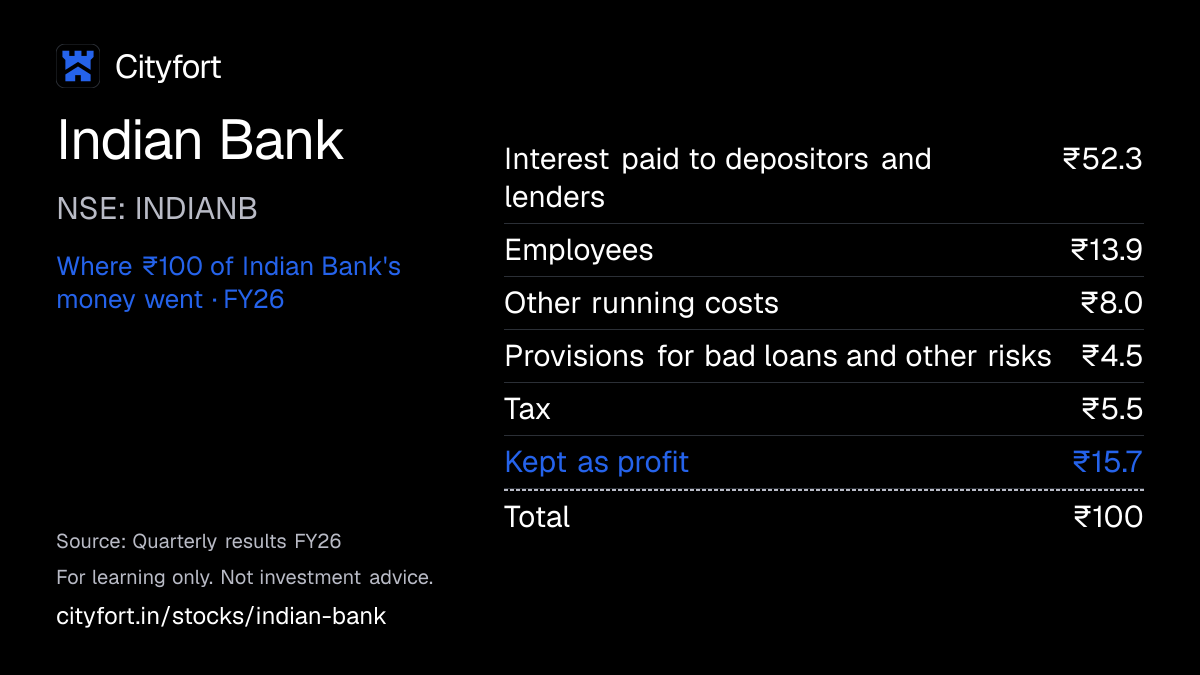
Of every ₹100 that came in to Indian Bank alone in FY26 it kept ₹15.7 as profit, in a year with no exceptional items in its own accounts; profit before provisions and tax was ₹19,916 crore.
4 · Where the operating profit comes from
Retail banking made ₹6,758 crore of Indian Bank's FY26 segment result, treasury ₹6,349 crore, corporate and wholesale banking ₹5,504 crore and other banking ₹1,305 crore, before provisions and tax.
5 · The one thing to watch
Indian Bank's Q2 FY27 (Jul–Sep 2026) profit before tax of ₹4,868 crore included a ₹1,387 crore gain on NSE shares, 28.5% of it, while its provisions of ₹2,222 crore included ₹1,500 crore for the move to expected-credit-loss rules.
Sources: From Indian Bank's FY26 annual report and results, its Q2 FY27 results, press release and call transcript · checked
Sources (6)
- Press release, Q2 FY27 results
- Annual Report FY26 (2025-26), standalone and consolidated financial statements
- Q2 FY27 results (standalone), XBRL integrated filing
- Q4 FY26 and FY26 audited results (standalone), XBRL integrated filing
- Q2 FY27 results with notes (PDF, standalone and consolidated)
- Earnings call transcript, Q2 FY27 (call 15 Oct 2026)
01Where the money goes · FY26
Where does ₹100 of Indian Bank's money go?
Indian Bank · FY26
Receipt for every ₹100
| Interest paid to depositors and lenders | ₹52.3 |
|---|---|
| Employees | ₹13.9 |
| Other running costs | ₹8.0 |
| Provisions for bad loans and other risks | ₹4.5 |
| Tax | ₹5.5 |
| Kept as profit | ₹15.7 |
| Total | ₹100 |
Each line = amount ÷ total money in × 100. Lines may not add to exactly ₹100 because of rounding.
How this is worked out
Of every ₹100 that came in to Indian Bank alone (standalone) in FY26. Money in = interest earned ₹67,451 crore + other income ₹9,991 crore. Cityfort calculation from the FY26 annual report and results.
Save this receipt as an image
Embed this receipt or the key numbers
Paste this code into a blog or website to show the card you choose, with a link back to this page.
Each week: the next company due to report results, explained in 5 points.
We'll email you once a week with what changed on Cityfort. Facts only, no tips. Unsubscribe any time.
We store your email address with Kit, our email provider, which also records when you sign up and whether you open or click our emails. We send a confirmation email first. See our privacy policy.
02The business in one line
What does Indian Bank do?
Borrowers pay Indian Bank interest; in FY26, ₹52 of every ₹100 that came in went to depositors and lenders, and ₹16 was profit.
- Interest on loans and investments was ₹87 of every ₹100 that came in during FY26. Fees, treasury gains and other income made up the other ₹13.
- The Government of India, through the President of India, owns 73.84% of the bank (Sep 2026). It was founded in 1907, nationalised in 1969, and Allahabad Bank merged into it from 1 Apr 2020.
03Who pays it
Who pays Indian Bank?
Retail branch customers
41.6%
of revenue
Income booked in the retail banking segment (mainly personal banking at retail branches): ₹32,214 crore, or 41.6% of FY26 segment income.
Companies (corporate and wholesale banking)
32.3%
of revenue
Corporate and institutional clients pay interest and fees: ₹25,027 crore, or 32.3% of FY26 segment income.
Treasury: governments and companies whose bonds the bank holds
24.2%
of revenue
Interest on investments and trading income: ₹18,740 crore, or 24.2% of FY26 segment income.
Other banking
1.9%
of revenue
Other banking business the bank reports separately: ₹1,461 crore, or 1.9% of FY26 segment income.
- Retail branch customers41.6%
- Companies (corporate and wholesale banking)32.3%
- Treasury: governments and companies whose bonds the bank holds24.2%
- Other banking1.9%
How spread out the customers are
Indian Bank does not disclose income by customer. The shares are its FY26 segment income (bank only). By loans, at 30 Jun 2026 domestic advances were 34% corporate, 25% agriculture, 23% retail and 18% MSME.
04How it makes money
How does Indian Bank make money?
A bank earns the gap between the interest it charges and the interest it pays
Indian Bank takes in deposits, lends at higher rates and keeps the gap, called net interest income (NII): ₹26,915 crore in FY26. Between FY22 and FY26 provisions for bad loans fell from ₹9,513 crore to ₹3,512 crore, and gross NPA from 8.47% to 1.98%.
Gross NPA, share of loans not being repaid (bank only)
8.5%2.0%
FY22 to FY26
- Savers and firms deposit money; 39.67% of domestic deposits were in low-interest current and savings accounts (Mar 2026)
- The bank lends to farmers, households, small businesses and companies at higher rates
- The gap is net interest income: ₹26,915 crore in FY26
- Fees, treasury gains and recoveries add ₹9,991 crore of other income
- Staff, branches and provisions for bad loans are paid out of it
- Profit adds to capital, which lets the bank lend more
↺ Step 6 feeds back into step 1.
05Business segments · FY26
Which businesses make up Indian Bank?
Retail banking
41.6%Retail branches: mainly personal banking, plus loans to companies that bank with those branches, agency business and ATMs. Results are before provisions and tax, which the bank does not split by segment.
Revenue ₹32,214 cr · Operating profit ₹6,758 cr
Corporate and wholesale banking
32.3%Loans and transaction services for corporate and institutional clients, including foreign offices' non-treasury business.
Revenue ₹25,027 cr · Operating profit ₹5,504 cr
Treasury
24.2%The whole investment portfolio, plus foreign-exchange and derivative trading.
Revenue ₹18,740 cr · Operating profit ₹6,349 cr
Other banking operations
1.9%Other banking business the bank reports as a separate segment.
Revenue ₹1,461 cr · Operating profit ₹1,305 cr
How the mix changed
- Retail banking
- Corporate and wholesale banking
- Treasury
- Other banking operations
Revenue by segment, FY22 to FY26.
₹ crore
See the numbers
Sources (6)
- Q4 FY22 and FY22 audited results (standalone), XBRL
- Q4 FY23 and FY23 audited results (standalone), XBRL
- Q4 FY24 and FY24 audited results (standalone), XBRL
- Q4 FY25 and FY25 audited results (standalone), XBRL integrated filing
- Q4 FY26 and FY26 audited results (standalone), XBRL integrated filing
- Annual Report FY26 (2025-26), standalone and consolidated financial statements
06The numbers · bank only (standalone) · ₹ crore
How has Indian Bank done?
Net interest income
₹26,915 crFY26
Bank-only net interest income (NII: interest earned minus interest paid) rose every year, from ₹16,728 crore in FY22 to ₹26,915 crore in FY26.
* Q2 FY27: Incl. ₹1,387 cr gain on NSE shares.
₹ crore · bank only (standalone) · interest earned minus interest paid
See the yearly numbers
See the quarterly numbers
Net profit
₹12,156 crFY26
Bank-only net profit rose every year, from ₹3,945 crore in FY22 to ₹12,156 crore in FY26; Q2 FY27 profit (₹3,462 crore) includes a ₹1,387 crore gain on NSE shares.
₹ crore · bank only (standalone)
See the yearly numbers
See the quarterly numbers
Net interest margin
3.36%FY26
Domestic net interest margin, as reported, was 3.54% in FY24, 3.36% in FY26 and 3.42% in Q2 FY27.
% · as reported by the company
See the numbers
Bad loans (gross NPA)
1.98%FY26
Gross NPA (loans not being repaid) fell from 8.47% in FY22 to 1.61% at 30 Sep 2026; net NPA fell from 2.27% to 0.14%.
* Q2 FY27: Incl. ₹1,387 cr gain on NSE shares.
% of loans · gross and net (after provisions) non-performing assets
See the yearly numbers
See the quarterly numbers
See all yearly numbers
EPS is group (consolidated) EPS for each period, as filed; quarterly EPS is not annualised (the bank's press releases quote an annualised figure).
Net interest income = interest earned on loans and investments minus interest paid on deposits and borrowings. Provisions = money set aside for loans that may not be repaid. Financial year runs April to March.
- Lending numbers and ratios here are Indian Bank alone (standalone), as the bank reports them. Total income, net profit and EPS under "The numbers" are group (consolidated) figures, which add subsidiaries such as Ind Bank Housing, and the bank's share of associates such as Tamil Nadu Grama Bank.
- Net interest margin is the domestic margin, as reported, on every row (FY22 from the FY23 annual report). The global margin was 2.93%, 3.37%, 3.47%, 3.41% and 3.24% in FY22–FY26; the Q2 FY27 global figure was not in the filings read.
- Q2 FY27: other income includes ₹1,386.67 crore from NSE's listing: ₹252.50 crore realised on shares sold in NSE's IPO and ₹1,134.17 crore from revaluing the rest. That is 28.5% of the quarter's profit before tax of ₹4,868 crore (Cityfort calculation from the Q2 FY27 results). Cost-to-income was 39.25% as reported, and 44.55% without the NSE income (Cityfort calculation).
- Q2 FY27 provisions of ₹2,222 crore include ₹1,500 crore for the move to expected-credit-loss (ECL) rules, after ₹1,000 crore in Q1 FY27. MD & CEO Binod Kumar said on 15 Oct 2026 that he expects a total impact of ₹3,500 crore.
- In its 2026 inspection, RBI observed that the bank had counted ₹3,823 crore of specific provisions on standard assets with probable stress as general provisions, incorrectly including ₹2,470 crore in Tier 2 capital, and had not applied a credit conversion factor to undrawn exposures with unconditional cancellation clauses, understating credit risk-weighted assets by ₹22,079 crore; the bank had relied on those clauses being in its sanction letters. RBI assessed 31 Mar 2026 CRAR at 16.53% (bank: 17.93%) and CET1 at 15.61% (bank: 16.40%). The FY26 row keeps the bank's reported figures; the bank applied the changes from Q2 FY27.
- CASA is the domestic CASA ratio. Advances are net advances from the balance sheet; gross advances were ₹667,113 crore at 31 Mar 2026. Provision cover (PCR) includes technical write-offs. Cost-to-income is operating expenses ÷ (NII + other income) and matches the bank's ratio. FY22 tax was a credit of ₹741 crore, so FY22 profit was above profit before tax.
Sources (22)
- Q4 FY22 and FY22 audited results (standalone), XBRL
- Annual Report FY22 (2021-22)
- Annual Report FY23 (2022-23)
- Annual Report FY26 (2025-26), standalone and consolidated financial statements
- Q4 FY23 and FY23 audited results (standalone), XBRL
- Annual Report FY24 (2023-24)
- Q4 FY24 and FY24 audited results (standalone), XBRL
- Annual Report FY25 (2024-25)
- Q4 FY25 and FY25 audited results (standalone), XBRL integrated filing
- Q4 FY26 and FY26 audited results (standalone), XBRL integrated filing
- Reg 30 disclosure: RBI Inspection for Supervisory Evaluation (ISE) 2026, RWA and CRAR as assessed by RBI for 31 Mar 2026
- Q3 FY25 results (standalone), XBRL
- Investor presentation Q3 FY26 (quarter ended 31 Dec 2025)
- Investor presentation Q4 FY26 (revised, 29 Apr 2026)
- Q1 FY26 results (standalone), XBRL integrated filing
- Investor presentation Q1 FY27 (quarter ended 30 Jun 2026)
- Q2 FY26 results (standalone), XBRL integrated filing
- Q3 FY26 results (standalone), XBRL integrated filing
- Q1 FY27 results (standalone), XBRL integrated filing
- Q2 FY27 results (standalone), XBRL integrated filing
- Press release, Q2 FY27 results
- Q2 FY27 results with notes (PDF, standalone and consolidated)
07Who runs it
Who runs Indian Bank, and did they deliver?
Binod Kumar
Managing Director & CEO · since 2025
Appointed from 16 Jan 2025 for 3 years; earlier an Executive Director of Punjab National Bank.
Ashutosh Choudhury
Executive Director
Shiv Bajrang Singh
Executive Director
Mini T M
Executive Director
Sunil Jain
General Manager & Chief Financial Officer
Signed the Q2 FY27 results and spoke on the Q2 FY27 call.
What they said, and what happened
2 delivered · 1 too early to tell
Said on 22 Jan 2026
FY26 recovery from bad loans of ₹5,500–6,500 crore and return on assets of 1.20% (MD & CEO Binod Kumar, Q3 FY26 call).
DeliveredWhat happened
FY26 recovery was ₹6,651 crore and ROA 1.31%, the bank's Q4 FY26 presentation shows.
Said on 10 Jul 2026
Try to provide ₹1,500–2,000 crore during FY27 for the move to expected-credit-loss (ECL) rules, of which ₹1,000 crore was already provided (MD & CEO Binod Kumar, Q1 FY27 call).
DeliveredWhat happened
A further ₹1,500 crore was provided in Q2 FY27, taking the total to ₹2,500 crore, he said on 15 Oct 2026.
Said on 29 Apr 2026
FY27 deposit growth of 9–11%, advances growth of 11–13%, CASA around 40%, gross NPA of 1.50–1.60%, NIM of 3.10–3.25% and ROA of 1.20–1.30% (MD & CEO Binod Kumar, Q4 FY26 call).
Too early to tellWhat happened
On 15 Oct 2026 he raised deposit guidance to 11–12% and advances to 13–14%. At 30 Sep 2026 domestic CASA was 39.36% and gross NPA 1.61%.
Sources (9)
- Appointment of Shri Binod Kumar as MD & CEO from 16 Jan 2025
- Earnings call transcript, Q2 FY27 (call 15 Oct 2026)
- Q2 FY27 results with notes (PDF, standalone and consolidated)
- Earnings call transcript, Q3 FY26 (call 22 Jan 2026)
- Investor presentation Q4 FY26 (revised, 29 Apr 2026)
- Earnings call transcript, Q1 FY27 (call 10 Jul 2026)
- Earnings call transcript, Q4 FY26 (call 29 Apr 2026)
- Press release, Q2 FY27 results
- Q2 FY27 results (standalone), XBRL integrated filing
08What could go wrong
What could go wrong for Indian Bank?
- Regulation
Capital ratios reassessed by RBI
RBI's 2026 inspection assessed 31 Mar 2026 CRAR at 16.53% (bank: 17.93%) and CET1 at 15.61% (bank: 16.40%). After the bank applied the changes, CRAR was 16.21% and CET1 15.18% at 30 Sep 2026; the bank cites RBI minimums of 11.50% and 5.50%.
Watch CRAR and CET1 each quarter.
- Regulation
Move to expected-credit-loss rules
Provisions of ₹2,222 crore in Q2 FY27, against ₹739 crore a year earlier, included ₹1,500 crore for the move to expected-credit-loss (ECL) rules. MD & CEO Binod Kumar said on 15 Oct 2026 that he expects a total impact of ₹3,500 crore, of which ₹2,500 crore was provided.
Watch ECL provisions in each quarter's results.
- Pricing
Narrower lending margin
Domestic net interest margin, as reported, fell from 3.54% in FY24 to 3.36% in FY26, and was 3.42% in Q2 FY27. On 29 Apr 2026 MD & CEO Binod Kumar gave an FY27 range of 3.10–3.25% for the global margin, which was 3.24% in FY26.
Watch Quarterly NIM against that range.
- Competition
Fewer low-cost deposits
Domestic current and savings deposits (CASA), which pay little interest, fell from 42.26% of domestic deposits in FY22 to 39.36% at 30 Sep 2026. FY27 guidance is about 40%.
Watch Domestic CASA ratio each quarter.
- Other
One-off income in Q2 FY27
Q2 FY27 profit before tax of ₹4,868 crore included ₹1,387 crore from NSE's listing (28.5%). Operating profit grew 46.58% from a year earlier; excluding the NSE income it grew 18%, MD & CEO Binod Kumar said.
Watch Other income without one-off gains in later quarters.
- Cash and liquidity
More borrowed money
Borrowings rose from ₹46,693 crore at 31 Mar 2026 to ₹77,195 crore at 30 Sep 2026. Loans grew 16.39% and deposits 12.50% in the year to 30 Sep 2026.
Watch Borrowings and the credit-deposit ratio each quarter.
- Governance
Government as controlling owner
The Government of India holds 73.84%. CRISIL Ratings factors in the "strong support" it expects from the government as majority owner.
Watch Board and top-management changes filed with the exchanges.
- Legal
Penalties and a tax demand
RBI imposed penalties of ₹2.10 lakh and ₹1.886 lakh in Sep–Oct 2026. In Mar 2025 the bank received an income-tax demand of ₹873.15 crore for assessment year 2017-18 and said it would appeal.
Watch RBI and tax intimations filed with the exchanges.
Sources (17)
- Reg 30 disclosure: RBI Inspection for Supervisory Evaluation (ISE) 2026, RWA and CRAR as assessed by RBI for 31 Mar 2026
- Press release, Q2 FY27 results
- Q2 FY27 results (standalone), XBRL integrated filing
- Q2 FY26 results (standalone), XBRL integrated filing
- Earnings call transcript, Q2 FY27 (call 15 Oct 2026)
- Annual Report FY24 (2023-24)
- Annual Report FY26 (2025-26), standalone and consolidated financial statements
- Earnings call transcript, Q4 FY26 (call 29 Apr 2026)
- Investor presentation Q4 FY26 (revised, 29 Apr 2026)
- Annual Report FY22 (2021-22)
- Q2 FY27 results with notes (PDF, standalone and consolidated)
- Q4 FY26 and FY26 audited results (standalone), XBRL integrated filing
- Shareholding pattern, quarter ended Sep 2026 (XBRL)
- CRISIL Ratings rating rationale, Indian Bank (27 Dec 2024)
- Reg 30 disclosure: RBI monetary penalty of ₹2,10,000 (ATM cash-out reporting)
- Reg 30 disclosure: RBI penalty of ₹1,88,600 on currency chest, Satna
- Reg 30 disclosure: income-tax demand notice for AY 2017-18
09Supporters and critics
What do supporters and critics point to?
What supporters point to
- Gross NPA fell from 8.47% of loans in FY22 to 1.61% at 30 Sep 2026; net NPA was 0.14%.
- Bank-only net profit rose every year, from ₹3,945 crore in FY22 to ₹12,156 crore in FY26.
- FY26 deposit growth of 12.29% and advances growth of 13.43% were above the bank's guidance of 8–10% and 10–12%.
- Retail, farm and small-business loans grew 17.74% in the year to 30 Sep 2026, to ₹442,302 crore.
- CARE Ratings and CRISIL Ratings rate the bank's infrastructure and Tier II bonds AAA (Stable), as of 16 Mar 2026. The ratings cover debt, not the shares.
What critics point to
- Domestic net interest margin fell from 3.54% in FY24 to 3.36% in FY26.
- Domestic CASA fell from 42.26% of domestic deposits in FY22 to 39.36% at 30 Sep 2026.
- RBI's 2026 inspection assessed 31 Mar 2026 CRAR at 16.53%, against the 17.93% the bank reported.
- FY26 cost-to-income was 46.03%, against guidance of about 44%.
- Q2 FY27 profit before tax included ₹1,387 crore from NSE's listing, 28.5% of the total.
10What to watch next
What should you watch next at Indian Bank?
Next event
Q3 FY27 results (date not announced yet)
Date not announced yet.
Expected-credit-loss transition
MD & CEO Binod Kumar said on 15 Oct 2026 that he expects a total impact of ₹3,500 crore; ₹2,500 crore was provided by 30 Sep 2026.
Capital ratios
CRAR was 16.21% and CET1 15.18% at 30 Sep 2026, after RBI's reassessment of the Mar 2026 figures.
Net interest margin
Domestic margin was 3.42% in Q2 FY27. After a 25 basis point repo rate increase, Mr Kumar said on 15 Oct 2026 that he expects a margin rise of about 5–6 basis points.
11Key facts
Key facts about Indian Bank
- What does Indian Bank do?
- Indian Bank is a public-sector bank based in Chennai, majority-owned by the Government of India. Indian Bank lends to farmers, households, small businesses and companies, funded mainly by deposits. At 30 Sep 2026 Indian Bank had gross advances of ₹721,982 crore and deposits of ₹874,036 crore.
- How does Indian Bank make money?
- Indian Bank earns mainly the gap between the interest it charges borrowers and the interest it pays depositors and lenders. In FY26 Indian Bank's own net interest income was ₹26,915 crore. Its other income was ₹9,991 crore, of which fee income was ₹3,709 crore.
- Who borrows from Indian Bank?
- At 30 Jun 2026 Indian Bank's domestic loans were 34% corporate, 25% agriculture, 23% retail and 18% MSME (small businesses). Retail, agriculture and MSME loans together were ₹442,302 crore, or 67.04% of domestic loans, at 30 Sep 2026.
- How big is Indian Bank?
- Indian Bank's bank-only net profit was ₹12,156 crore in FY26, up from ₹10,918 crore in FY25. Group profit for Indian Bank shareholders, including subsidiaries and associates, was ₹11,704 crore in FY26. Indian Bank had 6,017 branches in India at 30 Sep 2026 and 40,224 employees at 31 Mar 2026.
- Who owns Indian Bank?
- The President of India, for the Government of India, held 73.84% of Indian Bank's shares at 30 Sep 2026, none pledged. Indian institutions held 16.77% of Indian Bank (mutual funds 13.36%), foreign institutions 6.86%, and individuals and others 2.53%.
- What is Indian Bank's net interest margin?
- Net interest margin is net interest income as a share of the money a bank has lent and invested. Indian Bank reported a domestic margin of 3.36% for FY26, down from 3.54% in FY24, and 3.42% for Q2 FY27 (Jul–Sep 2026). Its global margin for FY26 was 3.24%.
- How many of Indian Bank's loans have gone bad?
- Indian Bank's gross NPA (loans not being repaid) was 1.61% of its loans at 30 Sep 2026, down from 8.47% at 31 Mar 2022. After money already set aside, Indian Bank's net NPA was 0.14% at 30 Sep 2026.
- Which bank merged into Indian Bank?
- Allahabad Bank was amalgamated into Indian Bank with effect from 1 Apr 2020, CRISIL Ratings notes. Indian Bank was incorporated on 5 Mar 1907 and nationalised on 19 Jul 1969.
- Who runs Indian Bank?
- Binod Kumar has been Indian Bank's MD & CEO since 16 Jan 2025, appointed for 3 years; he was earlier an Executive Director of Punjab National Bank. Sunil Jain is Indian Bank's General Manager and CFO.
Sources (14)
- Press release, Q2 FY27 results
- Q2 FY27 results (standalone), XBRL integrated filing
- Shareholding pattern, quarter ended Sep 2026 (XBRL)
- Annual Report FY26 (2025-26), standalone and consolidated financial statements
- Q4 FY26 and FY26 audited results (standalone), XBRL integrated filing
- Investor presentation Q1 FY27 (quarter ended 30 Jun 2026)
- Q4 FY26 and FY26 audited results (consolidated), XBRL integrated filing
- Annual Report FY24 (2023-24)
- Annual Report FY25 (2024-25)
- Q4 FY22 and FY22 audited results (standalone), XBRL
- CRISIL Ratings rating rationale, Indian Bank (27 Dec 2024)
- Business Responsibility and Sustainability Report FY25 (2024-25)
- Appointment of Shri Binod Kumar as MD & CEO from 16 Jan 2025
- Earnings call transcript, Q2 FY27 (call 15 Oct 2026)
Terms on this page
- CASA ratio
- Credit rating
- FII and DII holding
- Gross and net NPA
- Market capitalisation
- Net interest margin (NIM)
- Net profit
- Promoter holding
- Provision coverage ratio (PCR)
- Public shareholding
Each explains the term in plain English, with the same number from other companies on Cityfort.
Go deeper
More detail from the same filings. Open any section.
12What it sells
12What it sells
What does Indian Bank sell?
Deposits: savings, current and fixed
₹874,036 crore at 30 Sep 2026. In India, 39.36% sat in current and savings accounts (CASA), which pay little or no interest.
Retail loans
Loans to individuals: ₹146,827 crore at 30 Jun 2026, including ₹86,409 crore of home loans and ₹21,284 crore of non-priority jewel (gold) loans. They grew 17.37% in the year to 30 Sep 2026.
Farm loans
₹158,512 crore at 30 Jun 2026, of which ₹121,261 crore were crop loans. They grew 17.18% in the year to 30 Sep 2026.
Small-business (MSME) loans
₹111,653 crore at 30 Jun 2026, mostly to micro enterprises (₹61,385 crore). They grew 19.06% in the year to 30 Sep 2026.
Loans to companies
₹214,798 crore at 30 Jun 2026, 34% of domestic loans. Corporate loans grew 9.92% in the year to 30 Sep 2026, MD & CEO Binod Kumar said.
Investments and subsidiaries
The bank held ₹254,758 crore of investments, mostly bonds, at 30 Sep 2026. The group includes Ind Bank Housing (51%), Indbank Merchant Banking Services (64.84%) and Indbank Global Support Services (100%).
What it does
- Does: Takes deposits from people and businesses, mainly in India
- Does: Lends to farmers, households, small businesses and companies
- Does: Runs 3 overseas branches and a unit in GIFT City (Sep 2026)
- Does: Owns 35% each of two rural banks, Tamil Nadu Grama Bank and Puducherry Grama Bank (Mar 2026)
What it does not do
- Does not: Belong to a business family: the Government of India owns 73.84% (Sep 2026)
- Does not: Run Allahabad Bank separately: it merged into Indian Bank from 1 Apr 2020
- Does not: Have a large overseas network: 3 branches abroad, against 6,017 in India (Sep 2026)
13How the money flows
13How the money flows · FY26
How does money flow through Indian Bank?
Money in
- Interest earned (loans, investments and other)₹67,451 cr
- Fees, treasury gains and other income₹9,991 cr
The company
Indian Bank
₹77,442 cr came in
Money out
- Interest paid to depositors and lenders₹40,536 cr
- Employees₹10,760 cr
- Other running costs₹6,229 cr
- Provisions for bad loans and other risks₹3,512 cr
- Tax₹4,248 cr
- Net profit (bank only)₹12,156 cr
- These are Indian Bank's own FY26 accounts (standalone), without its subsidiaries and associates.
- Savers, companies and other lenders provide the money. In FY26 the bank paid them ₹40,536 crore of interest.
- It lends and invests that money. Interest earned was ₹67,451 crore, and other income added ₹9,991 crore, including ₹3,709 crore of fees.
- Staff cost ₹10,760 crore and other running costs ₹6,229 crore, leaving ₹19,916 crore of profit before provisions and tax.
- After ₹3,512 crore of provisions for possible bad loans and ₹4,248 crore of tax, ₹12,156 crore was profit.
14What it needs to run
14What it needs to run
What does Indian Bank need to run?
A banking licence and capital
RBI requires each bank to hold its own money (capital) against its loans and other assets, weighted by risk; that share is called CRAR. Indian Bank reported 17.93% at 31 Mar 2026, and RBI assessed 16.53%; the bank cites an RBI minimum of 11.50%.
Deposits
Deposits of ₹827,726 crore at 31 Mar 2026 fund most of its lending. Domestic current and savings accounts were 39.67% of domestic deposits then.
Branches, ATMs and agents
6,017 branches in India, 5,678 ATMs and cash machines, and 18,379 business correspondents (local agents) at 30 Sep 2026.
People
40,224 employees at 31 Mar 2026, up from 39,803 at 31 Mar 2022.
Borrowed money
Borrowings were ₹77,195 crore at 30 Sep 2026, up from ₹46,693 crore at 31 Mar 2026. In Aug 2026 its GIFT City branch raised a US$400 million 4-year loan.
Sources (6)
- Annual Report FY26 (2025-26), standalone and consolidated financial statements
- Reg 30 disclosure: RBI Inspection for Supervisory Evaluation (ISE) 2026, RWA and CRAR as assessed by RBI for 31 Mar 2026
- Q4 FY26 and FY26 audited results (standalone), XBRL integrated filing
- Press release, Q2 FY27 results
- Q2 FY27 results (standalone), XBRL integrated filing
- Reg 30 disclosure: GIFT City branch raised USD 400 million 4-year loan
15Where growth could come from
15Where growth could come from
Where could Indian Bank's growth come from?
MD & CEO Binod Kumar said on the Q2 FY27 call (15 Oct 2026) that he was raising FY27 guidance for deposit growth from 9–11% to 11–12%, and for advances growth from 11–13% to 13–14%. After a 25 basis point repo rate increase, he said "we should see NIM expansion of perhaps 5-6 basis points going forward".
Retail, farm and small-business loans
Working₹442,302 crore at 30 Sep 2026, up 17.74% in a year and 67.04% of domestic loans
Retail loans grew 17.37%, agriculture 17.18% and MSME 19.06% in the year to 30 Sep 2026.
Status: Working, on track against what the company said.
Total loan growth
WorkingGross advances ₹721,982 crore at 30 Sep 2026, up 16.39% in a year
FY26 advances grew 13.43%, above the 10–12% guidance. On 15 Oct 2026 FY27 guidance was raised to 13–14%.
Status: Working, on track against what the company said.
Corporate loans
MixedCorporate loans grew 9.92% in the year to 30 Sep 2026
MD & CEO Binod Kumar said on 15 Oct 2026 that the corporate pipeline was ₹63,000 crore, of which ₹30,000 crore was sanctioned but not yet disbursed.
Status: Mixed, partly on track.
Low-cost deposits
BehindDomestic CASA 39.36% at 30 Sep 2026, against FY27 guidance of about 40%
It was 39.67% at 31 Mar 2026, against FY26 guidance of above 40%.
Status: Behind, behind the company's own plan.
Status compares progress with what the company itself said it would do: Working = on track against what the company said; Mixed = partly on track; Behind = behind the company's own plan; New = recently announced; Early = too early to judge.
16Financial strength: capital, bad loans, deposits
16Financial strength · FY26
How strong is Indian Bank's balance sheet?
- Loans given (advances)₹6.55 lakh cr
- Deposits taken₹8.28 lakh cr
Loans were 79% of deposits (credit–deposit ratio) at the end of FY26.
- Capital adequacy (CRAR)
- 17.93%
- capital as a share of risk-weighted loans; regulators set a minimum
- Core equity (CET1)
- 16.4%
- the highest-quality part of that capital
- Gross NPA
- 1.98%
- loans not being repaid, as % of all loans
- Net NPA
- 0.15%
- the same, after money already set aside
- Provision cover
- 98.28%
- share of bad loans already provided for
- CASA ratio
- 39.67%
- deposits in current and savings accounts, which usually pay low interest
- Cost to income
- 46.03%
- ₹ of running costs per ₹100 of income after interest paid
- Return on assets
- 1.31%
- profit as % of everything the lender owns
- Return on equity
- 19.53%
- profit as % of shareholders' money
Figures as on FY26 year end (standalone, as banks report these ratios). Reported by the company; see the dates on each source.
17Who owns it
17Who owns it · Q2 FY27
Who owns Indian Bank?
- Promoters (founders or parent company)73.8%
- Foreign institutions (FII)6.9%
- Indian institutions (DII)16.8%
- Public and others2.5%
Promoter pledge
No promoter shares were pledged in Q2 FY27.
How ownership changed
* Pledged = share of the promoters' own holding reported as pledged. In older filings this can include shares “otherwise encumbered”; the governance flags say when.
Sources (12)
- Shareholding pattern, quarter ended Dec 2023 (XBRL)
- Shareholding pattern, quarter ended Mar 2024 (XBRL)
- Shareholding pattern, quarter ended Jun 2024 (XBRL)
- Shareholding pattern, quarter ended Sep 2024 (XBRL)
- Shareholding pattern, quarter ended Dec 2024 (XBRL)
- Shareholding pattern, quarter ended Mar 2025 (XBRL)
- Shareholding pattern, quarter ended Jun 2025 (XBRL)
- Shareholding pattern, quarter ended Sep 2025 (XBRL)
- Shareholding pattern, quarter ended Dec 2025 (XBRL)
- Shareholding pattern, quarter ended Mar 2026 (XBRL)
- Shareholding pattern, quarter ended Jun 2026 (XBRL)
- Shareholding pattern, quarter ended Sep 2026 (XBRL)
18What it does with profit
18What it does with profit
What does Indian Bank do with its profit?
Dividend per share
₹18.25FY26
Dividend paid for each share, by financial year.
₹ per share
See the numbers
Money raised · 24 Mar 2026
Allotted 7.15% long-term infrastructure bonds (Series III). Bonds are borrowing, not new shares.
₹5,000 cr
19Governance signals
19Governance signals
What do Indian Bank's governance filings show?
- Auditor
- Five statutory central auditors for FY26: G Balu Associates LLP, Dass Gupta & Associates, Arun K Agarwal & Associates, S P A R K & Associates LLP and Bhatia & Bhatia
- Auditor changes
- 15 Nov 2025: S. Singhal & Co (one of the central auditors) → S P A R K & Associates LLP and Bhatia & Bhatia joined as new central auditors for FY26 (S. Singhal & Co ceased to be a central auditor on completing its term, the bank's filing says. The appointments followed RBI approval.)
- Audit qualifications
- None reported
- Related-party dealings
- Indian Bank's main related parties are its subsidiaries, associates and joint ventures. At 31 Mar 2026 it held 64.84% of Indbank Merchant Banking Services, 51% of Ind Bank Housing and 100% of Indbank Global Support Services; 35% each of Tamil Nadu Grama Bank and Puducherry Grama Bank; 28.52% of Universal Sompo General Insurance and 38.26% of ASREC (India).
- Credit rating
- CARE Ratings and CRISIL Ratings AAA (infrastructure and Tier II bonds) (outlook Stable), 16 Mar 2026
A credit rating describes the company's ability to repay debt. It is not a rating of the share.
Flags to know about
other · 30 Sep 2026
The Government of India is the promoter
The President of India held 73.84% of shares for the Government of India in every quarter from Dec 2023 to Sep 2026, none pledged.
regulatory · 15 Oct 2026
RBI reassessed the bank's capital ratios for Mar 2026
On 15 Oct 2026 the bank disclosed the findings of RBI's 2026 inspection. RBI observed that the bank had counted ₹3,823 crore of specific provisions on standard assets with probable stress as general provisions, incorrectly including ₹2,470 crore in Tier 2 capital, and had not applied a credit conversion factor to undrawn exposures with unconditional cancellation clauses, understating credit risk-weighted assets by ₹22,079 crore; the bank had relied on those clauses being in its sanction letters. RBI assessed 31 Mar 2026 CRAR at 16.53% against the bank's 17.93%. The bank says there is no impact on reported net profit.
regulatory · 30 Oct 2026
RBI penalties, 2026
RBI imposed ₹2.10 lakh (order received 29 Oct 2026) for not reporting cash-out incidents at 21 ATMs for June 2026, and ₹1.886 lakh (disclosed 1 Sep 2026) on the Satna currency chest for soiled note remittance irregularities.
regulatory · 26 Mar 2025
Income-tax demand for assessment year 2017-18
On 26 Mar 2025 the bank received a demand of ₹873.15 crore for assessment year 2017-18, citing certain disallowances. It said it would appeal and expects that the entire demand will subside.
Sources (10)
- Appointment/re-appointment of Statutory Central Auditors for FY 2025-26
- Annual Report FY26 (2025-26), standalone and consolidated financial statements
- Q4 FY26 and FY26 audited results with notes (PDF)
- CARE Ratings and CRISIL Ratings: AAA/Stable assigned to proposed ₹5,000 crore infrastructure bonds, other ratings reaffirmed (bank's intimation of the 16 Mar 2026 rating letters)
- Shareholding pattern, quarter ended Sep 2026 (XBRL)
- Shareholding pattern, quarter ended Dec 2023 (XBRL)
- Reg 30 disclosure: RBI Inspection for Supervisory Evaluation (ISE) 2026, RWA and CRAR as assessed by RBI for 31 Mar 2026
- Reg 30 disclosure: RBI monetary penalty of ₹2,10,000 (ATM cash-out reporting)
- Reg 30 disclosure: RBI penalty of ₹1,88,600 on currency chest, Satna
- Reg 30 disclosure: income-tax demand notice for AY 2017-18
20What the market paid
20What the market paid · price as of 11 Nov 2026
What did the market pay for Indian Bank on 11 Nov 2026?
Price as of 11 Nov 2026 (shown for education; prices change daily).
Price as of 11 Nov 2026: ₹935.40, the NSE closing price. Market value: ₹125,995 crore, a Cityfort calculation from that price and the 1,346,963,981 shares in the 30 Sep 2026 shareholding pattern. P/E is the share price divided by one year's profit per share: here FY26 group EPS of ₹86.89, giving 10.8 (Cityfort calculation). P/B divides the price by book value per share: here bank-only capital plus reserves of ₹630.73 a share at 30 Sep 2026, giving 1.48 (Cityfort calculation from the Q2 FY27 results); the bank states its own book value as ₹535 a share without giving its method. The FY26 dividend of ₹18.25 is 1.95% of the price (Cityfort calculation). EV/EBITDA is not shown, because interest is a bank's main running cost.
- Share price
- ₹935.40
- Market value (market cap)
- ₹125,995 cr
- P/E
- 10.8×
- P/B
- 1.5×
Source: NSE capital market bhavcopy, 11 Nov 2026 (INDIANB close); Shareholding pattern, quarter ended Sep 2026 (XBRL); Q4 FY26 and FY26 audited results (consolidated), XBRL integrated filing and 3 more
Sources (6)
- NSE capital market bhavcopy, 11 Nov 2026 (INDIANB close)
- Shareholding pattern, quarter ended Sep 2026 (XBRL)
- Q4 FY26 and FY26 audited results (consolidated), XBRL integrated filing
- Q2 FY27 results (standalone), XBRL integrated filing
- Earnings call transcript, Q2 FY27 (call 15 Oct 2026)
- Annual Report FY26 (2025-26), standalone and consolidated financial statements
21How it got here
21How it got here
How did Indian Bank get here?
1907
Milestone
Founded
Incorporated on 5 Mar 1907 by V. Krishnaswamy Iyer; it began business on 15 Aug 1907.
1969
Business-model change
Nationalised
Nationalised on 19 Jul 1969, the bank's BRSR report says.
2007
Milestone
Shares listed
The bank's IPO came in February 2007, the FY26 annual report says.
2020
Business-model change
Allahabad Bank merged in
Allahabad Bank was amalgamated into Indian Bank with effect from 1 Apr 2020, CRISIL Ratings notes.
2023
Milestone
₹4,000 crore share sale to institutions
A QIP in Dec 2023 issued 101,522,842 shares at ₹394; the government's stake fell from 79.86% to 73.84%.
2025
Milestone
New MD & CEO
Binod Kumar took over as MD & CEO on 16 Jan 2025.
2025
Milestone
Saptagiri Grameena Bank amalgamated
The associate rural bank merged into Andhra Pradesh Grameena Bank from 1 May 2025; the group booked a ₹766.59 crore exceptional loss.
2026
Milestone
NSE shares sold
The bank offered up to 15,00,000 NSE shares (17.91% of its holding) in NSE's IPO and booked ₹1,386.67 crore of income in Q2 FY27.
Sources (9)
- Annual Report FY26 (2025-26), standalone and consolidated financial statements
- Business Responsibility and Sustainability Report FY25 (2024-25)
- CRISIL Ratings rating rationale, Indian Bank (27 Dec 2024)
- Annual Report FY24 (2023-24)
- Appointment of Shri Binod Kumar as MD & CEO from 16 Jan 2025
- Amalgamation of Saptagiri Grameena Bank (sponsored by Indian Bank) into Andhra Pradesh Grameena Bank from 1 May 2025
- Q4 FY26 and FY26 audited results with notes (PDF)
- Reg 30 disclosure: sale of up to 15,00,000 NSE shares in NSE's IPO offer for sale
- Q2 FY27 results with notes (PDF, standalone and consolidated)
22Sources and changes
Where every number on this page comes from
Sources (63 documents)
- S1Annual Report FY26 (2025-26), standalone and consolidated financial statements · NSE (company filing, nsearchives.nseindia.com) · Tier 1: company or exchange filing · 23 May 2026
- S2Annual Report FY25 (2024-25) · NSE (company filing, nsearchives.nseindia.com) · Tier 1: company or exchange filing · 25 May 2025
- S3Annual Report FY24 (2023-24) · NSE (company filing, nsearchives.nseindia.com) · Tier 1: company or exchange filing · 25 May 2024
- S4Annual Report FY23 (2022-23) · NSE (company filing, nsearchives.nseindia.com) · Tier 1: company or exchange filing · 27 May 2023
- S5Annual Report FY22 (2021-22) · NSE (company filing, nsearchives.nseindia.com) · Tier 1: company or exchange filing · 31 May 2022
- S6Q2 FY27 results (standalone), XBRL integrated filing · NSE (company filing, nsearchives.nseindia.com) · Tier 1: company or exchange filing · 15 Oct 2026
- S7Q2 FY27 results (consolidated), XBRL integrated filing · NSE (company filing, nsearchives.nseindia.com) · Tier 1: company or exchange filing · 15 Oct 2026
- S8Q1 FY27 results (standalone), XBRL integrated filing · NSE (company filing, nsearchives.nseindia.com) · Tier 1: company or exchange filing · 10 Jul 2026
- S9Q1 FY27 results (consolidated), XBRL integrated filing · NSE (company filing, nsearchives.nseindia.com) · Tier 1: company or exchange filing · 10 Jul 2026
- S10Q4 FY26 and FY26 audited results (standalone), XBRL integrated filing · NSE (company filing, nsearchives.nseindia.com) · Tier 1: company or exchange filing · 29 Apr 2026
- S11Q4 FY26 and FY26 audited results (consolidated), XBRL integrated filing · NSE (company filing, nsearchives.nseindia.com) · Tier 1: company or exchange filing · 29 Apr 2026
- S12Q3 FY26 results (standalone), XBRL integrated filing · NSE (company filing, nsearchives.nseindia.com) · Tier 1: company or exchange filing · 22 Jan 2026
- S13Q3 FY26 results (consolidated), XBRL integrated filing · NSE (company filing, nsearchives.nseindia.com) · Tier 1: company or exchange filing · 22 Jan 2026
- S14Q2 FY26 results (standalone), XBRL integrated filing · NSE (company filing, nsearchives.nseindia.com) · Tier 1: company or exchange filing · 16 Oct 2025
- S15Q2 FY26 results (consolidated), XBRL integrated filing · NSE (company filing, nsearchives.nseindia.com) · Tier 1: company or exchange filing · 16 Oct 2025
- S16Q1 FY26 results (standalone), XBRL integrated filing · NSE (company filing, nsearchives.nseindia.com) · Tier 1: company or exchange filing · 24 Jul 2025
- S17Q1 FY26 results (consolidated), XBRL integrated filing · NSE (company filing, nsearchives.nseindia.com) · Tier 1: company or exchange filing · 24 Jul 2025
- S18Q4 FY25 and FY25 audited results (standalone), XBRL integrated filing · NSE (company filing, nsearchives.nseindia.com) · Tier 1: company or exchange filing · 3 May 2025
- S19Q4 FY25 and FY25 audited results (consolidated), XBRL integrated filing · NSE (company filing, nsearchives.nseindia.com) · Tier 1: company or exchange filing · 5 May 2025
- S20Q3 FY25 results (standalone), XBRL · NSE (company filing, nsearchives.nseindia.com) · Tier 1: company or exchange filing · 29 Jan 2025
- S21Q3 FY25 results (consolidated), XBRL · NSE (company filing, nsearchives.nseindia.com) · Tier 1: company or exchange filing · 29 Jan 2025
- S22Q4 FY24 and FY24 audited results (standalone), XBRL · NSE (company filing, nsearchives.nseindia.com) · Tier 1: company or exchange filing · 6 May 2024
- S23Q4 FY24 and FY24 audited results (consolidated), XBRL · NSE (company filing, nsearchives.nseindia.com) · Tier 1: company or exchange filing · 6 May 2024
- S24Q4 FY23 and FY23 audited results (standalone), XBRL · NSE (company filing, nsearchives.nseindia.com) · Tier 1: company or exchange filing · 9 May 2023
- S25Q4 FY23 and FY23 audited results (consolidated), XBRL · NSE (company filing, nsearchives.nseindia.com) · Tier 1: company or exchange filing · 9 May 2023
- S26Q4 FY22 and FY22 audited results (standalone), XBRL · NSE (company filing, nsearchives.nseindia.com) · Tier 1: company or exchange filing · 12 May 2022
- S27Q4 FY22 and FY22 audited results (consolidated), XBRL · NSE (company filing, nsearchives.nseindia.com) · Tier 1: company or exchange filing · 12 May 2022
- S28Q2 FY27 results with notes (PDF, standalone and consolidated) · NSE (company filing, nsearchives.nseindia.com) · Tier 1: company or exchange filing · 15 Oct 2026
- S29Q4 FY26 and FY26 audited results with notes (PDF) · NSE (company filing, nsearchives.nseindia.com) · Tier 1: company or exchange filing · 29 Apr 2026
- S30Investor presentation Q1 FY27 (quarter ended 30 Jun 2026) · NSE (company filing, nsearchives.nseindia.com) · Tier 1: company or exchange filing · 10 Jul 2026
- S31Investor presentation Q4 FY26 (revised, 29 Apr 2026) · NSE (company filing, nsearchives.nseindia.com) · Tier 1: company or exchange filing · 29 Apr 2026
- S32Investor presentation Q3 FY26 (quarter ended 31 Dec 2025) · NSE (company filing, nsearchives.nseindia.com) · Tier 1: company or exchange filing · 22 Jan 2026
- S33Press release, Q2 FY27 results · NSE (company filing, nsearchives.nseindia.com) · Tier 1: company or exchange filing · 15 Oct 2026
- S41Earnings call transcript, Q2 FY27 (call 15 Oct 2026) · NSE (company filing, nsearchives.nseindia.com) · Tier 1: company or exchange filing · 21 Oct 2026
- S42Earnings call transcript, Q1 FY27 (call 10 Jul 2026) · NSE (company filing, nsearchives.nseindia.com) · Tier 1: company or exchange filing · 17 Jul 2026
- S43Earnings call transcript, Q4 FY26 (call 29 Apr 2026) · NSE (company filing, nsearchives.nseindia.com) · Tier 1: company or exchange filing · 6 May 2026
- S44Earnings call transcript, Q3 FY26 (call 22 Jan 2026) · NSE (company filing, nsearchives.nseindia.com) · Tier 1: company or exchange filing · 30 Jan 2026
- S45Shareholding pattern, quarter ended Sep 2026 (XBRL) · NSE (company filing, nsearchives.nseindia.com) · Tier 1: company or exchange filing · 8 Oct 2026
- S46Shareholding pattern, quarter ended Jun 2026 (XBRL) · NSE (company filing, nsearchives.nseindia.com) · Tier 1: company or exchange filing · 4 Jul 2026
- S47Shareholding pattern, quarter ended Mar 2026 (XBRL) · NSE (company filing, nsearchives.nseindia.com) · Tier 1: company or exchange filing · 7 Apr 2026
- S48Shareholding pattern, quarter ended Dec 2025 (XBRL) · NSE (company filing, nsearchives.nseindia.com) · Tier 1: company or exchange filing · 13 Jan 2026
- S49Shareholding pattern, quarter ended Sep 2025 (XBRL) · NSE (company filing, nsearchives.nseindia.com) · Tier 1: company or exchange filing · 15 Oct 2025
- S50Shareholding pattern, quarter ended Jun 2025 (XBRL) · NSE (company filing, nsearchives.nseindia.com) · Tier 1: company or exchange filing · 16 Jul 2025
- S51Shareholding pattern, quarter ended Mar 2025 (XBRL) · NSE (company filing, nsearchives.nseindia.com) · Tier 1: company or exchange filing · 5 Apr 2025
- S52Shareholding pattern, quarter ended Dec 2024 (XBRL) · NSE (company filing, nsearchives.nseindia.com) · Tier 1: company or exchange filing · 13 Jan 2025
- S53Shareholding pattern, quarter ended Sep 2024 (XBRL) · NSE (company filing, nsearchives.nseindia.com) · Tier 1: company or exchange filing · 15 Oct 2024
- S54Shareholding pattern, quarter ended Jun 2024 (XBRL) · NSE (company filing, nsearchives.nseindia.com) · Tier 1: company or exchange filing · 3 Jul 2024
- S55Shareholding pattern, quarter ended Mar 2024 (XBRL) · NSE (company filing, nsearchives.nseindia.com) · Tier 1: company or exchange filing · 8 Apr 2024
- S56Shareholding pattern, quarter ended Dec 2023 (XBRL) · NSE (company filing, nsearchives.nseindia.com) · Tier 1: company or exchange filing · 8 Jan 2024
- S57CARE Ratings and CRISIL Ratings: AAA/Stable assigned to proposed ₹5,000 crore infrastructure bonds, other ratings reaffirmed (bank's intimation of the 16 Mar 2026 rating letters) · NSE (company filing, nsearchives.nseindia.com) · Tier 2: rating agency or regulator · 16 Mar 2026
- S59CRISIL Ratings rating rationale, Indian Bank (27 Dec 2024) · CRISIL Ratings · Tier 2: rating agency or regulator · 27 Dec 2024
- S60Business Responsibility and Sustainability Report FY25 (2024-25) · NSE (company filing, nsearchives.nseindia.com) · Tier 1: company or exchange filing · 25 May 2025
- S61Reg 30 disclosure: sale of up to 15,00,000 NSE shares in NSE's IPO offer for sale · NSE (company filing, nsearchives.nseindia.com) · Tier 1: company or exchange filing · 9 Sep 2026
- S62Reg 30 disclosure: RBI Inspection for Supervisory Evaluation (ISE) 2026, RWA and CRAR as assessed by RBI for 31 Mar 2026 · NSE (company filing, nsearchives.nseindia.com) · Tier 1: company or exchange filing · 15 Oct 2026
- S63Reg 30 disclosure: RBI monetary penalty of ₹2,10,000 (ATM cash-out reporting) · NSE (company filing, nsearchives.nseindia.com) · Tier 1: company or exchange filing · 30 Oct 2026
- S64Reg 30 disclosure: RBI penalty of ₹1,88,600 on currency chest, Satna · NSE (company filing, nsearchives.nseindia.com) · Tier 1: company or exchange filing · 1 Sep 2026
- S65Allotment of ₹5,000 crore 7.15% long term infrastructure bonds, Series III · NSE (company filing, nsearchives.nseindia.com) · Tier 1: company or exchange filing · 24 Mar 2026
- S66Amalgamation of Saptagiri Grameena Bank (sponsored by Indian Bank) into Andhra Pradesh Grameena Bank from 1 May 2025 · NSE (company filing, nsearchives.nseindia.com) · Tier 1: company or exchange filing · 8 Apr 2025
- S67Appointment of Shri Binod Kumar as MD & CEO from 16 Jan 2025 · NSE (company filing, nsearchives.nseindia.com) · Tier 1: company or exchange filing · 16 Jan 2025
- S68Reg 30 disclosure: income-tax demand notice for AY 2017-18 · NSE (company filing, nsearchives.nseindia.com) · Tier 1: company or exchange filing · 26 Mar 2025
- S69Appointment/re-appointment of Statutory Central Auditors for FY 2025-26 · NSE (company filing, nsearchives.nseindia.com) · Tier 1: company or exchange filing · 15 Nov 2025
- S70Reg 30 disclosure: GIFT City branch raised USD 400 million 4-year loan · NSE (company filing, nsearchives.nseindia.com) · Tier 1: company or exchange filing · 19 Aug 2026
- S71NSE capital market bhavcopy, 11 Nov 2026 (INDIANB close) · NSE (company filing, nsearchives.nseindia.com) · Tier 1: company or exchange filing · 11 Nov 2026
Changes to this page (v1 · 12 Nov 2026)
- v1 · 12 Nov 2026First version. (first version)
Numbers come only from tier 1 and tier 2 sources. Read how we research.
Disclaimer
For learning only. Cityfort is not a SEBI-registered adviser and does not recommend buying or selling any security. Prices shown are dated and may be out of date.
Investing in securities involves risk, including loss of capital. Before making any investment decision, do your own research and consider consulting a SEBI-registered investment adviser.
Cityfort, its owners and contributors may or may not hold securities of companies covered. Content is not an offer or solicitation to buy or sell any security.
Read the full disclaimerHide the full disclaimer
Cityfort publishes educational content that explains how listed companies work. Cityfort is not registered with the Securities and Exchange Board of India (SEBI) as an Investment Adviser or Research Analyst and does not provide investment advice, recommendations, ratings, price targets or any opinion on whether to buy, sell or hold any security.
All information is taken from publicly available sources, mainly company filings on BSE and NSE, which are listed on each page with dates. We work to keep it accurate and correct errors publicly, but we do not guarantee that it is complete, accurate or up to date. Any market price or price-based ratio shown is dated, may be out of date by the time you read it, and is included only to explain concepts.
Statements by company management are reported as statements, with their date and source; they are not our forecasts.