Healthcare · NSE: PPLPHARMA · BSE: 543635
Piramal Pharma: how the business works
Piramal Pharma makes medicines under contract for other drug companies, sells anaesthesia and other hospital medicines, and owns Indian consumer brands; FY26 revenue was ₹8,869 crore.
Follow Piramal Pharma
Email me when Piramal Pharma's page is updated after results.
We store your email address with Kit, our email provider, which also records when you sign up and whether you open or click our emails. We send a confirmation email first. See our privacy policy.
Piramal Pharma Limited · Mumbai, Maharashtra · Founded 2020
Updated for Q2 FY27 · checked
- Revenue, FY26
- ₹8,869 cr
- Loss, FY26
- −₹326 cr
- Revenue, Q2 FY27
- ₹2,617 cr
- Permanent employees, FY26
- 6,617
- Promoter holding, Sep 2026 (none pledged)
- 34.80%
The short version
Piramal Pharma in 5 points
1 · What it sells
Piramal Pharma makes medicines under contract for other drug companies, sells anaesthesia and other hospital medicines, and owns Indian consumer brands, with ₹8,869 crore of revenue in FY26.
2 · Who pays it
By the company's presentation figures for FY26, drug companies buying contract development and manufacturing paid 55% of revenue, hospitals and their buyers 30% and Indian consumers 14%.
3 · What it keeps from ₹100
Of every ₹100 that came in during FY26, Piramal Pharma lost ₹3.6 after ₹196 crore of one-off charges, mainly a ₹176 crore write-down; before those charges its EBITDA was ₹922 crore (Cityfort calculation).
4 · Where the operating profit comes from
Piramal Pharma does not report profit by business, and its EBITDA after one-off charges fell from ₹1,445 crore in FY25 to ₹725 crore in FY26, a year in which CDMO revenue fell 10%.
5 · The one thing to watch
Net debt rose from ₹4,140 crore on 31 Mar 2026 to ₹4,835 crore on 30 Sep 2026 (Cityfort calculation), and CARE names net debt above 3.5 times its measure of operating profit, if sustained, as a downgrade trigger.
Sources: From Piramal Pharma's FY26 annual report, its FY25, FY26 and Q2 FY27 results filings and presentations, and CARE's Jul 2026 rating report · checked
Sources (6)
- Q4 FY26 and FY26 consolidated results, XBRL (integrated filing)
- Annual Report FY26
- Q4 and FY26 press release and investor presentation (28 Apr 2026)
- Q4 FY25 and FY25 consolidated results, XBRL (integrated filing)
- Q2 FY27 consolidated results, XBRL (integrated filing)
- CARE Ratings press release: ratings reaffirmed, CARE AA; Stable / CARE A1+ (17 Jul 2026)
01Where the money goes · FY26
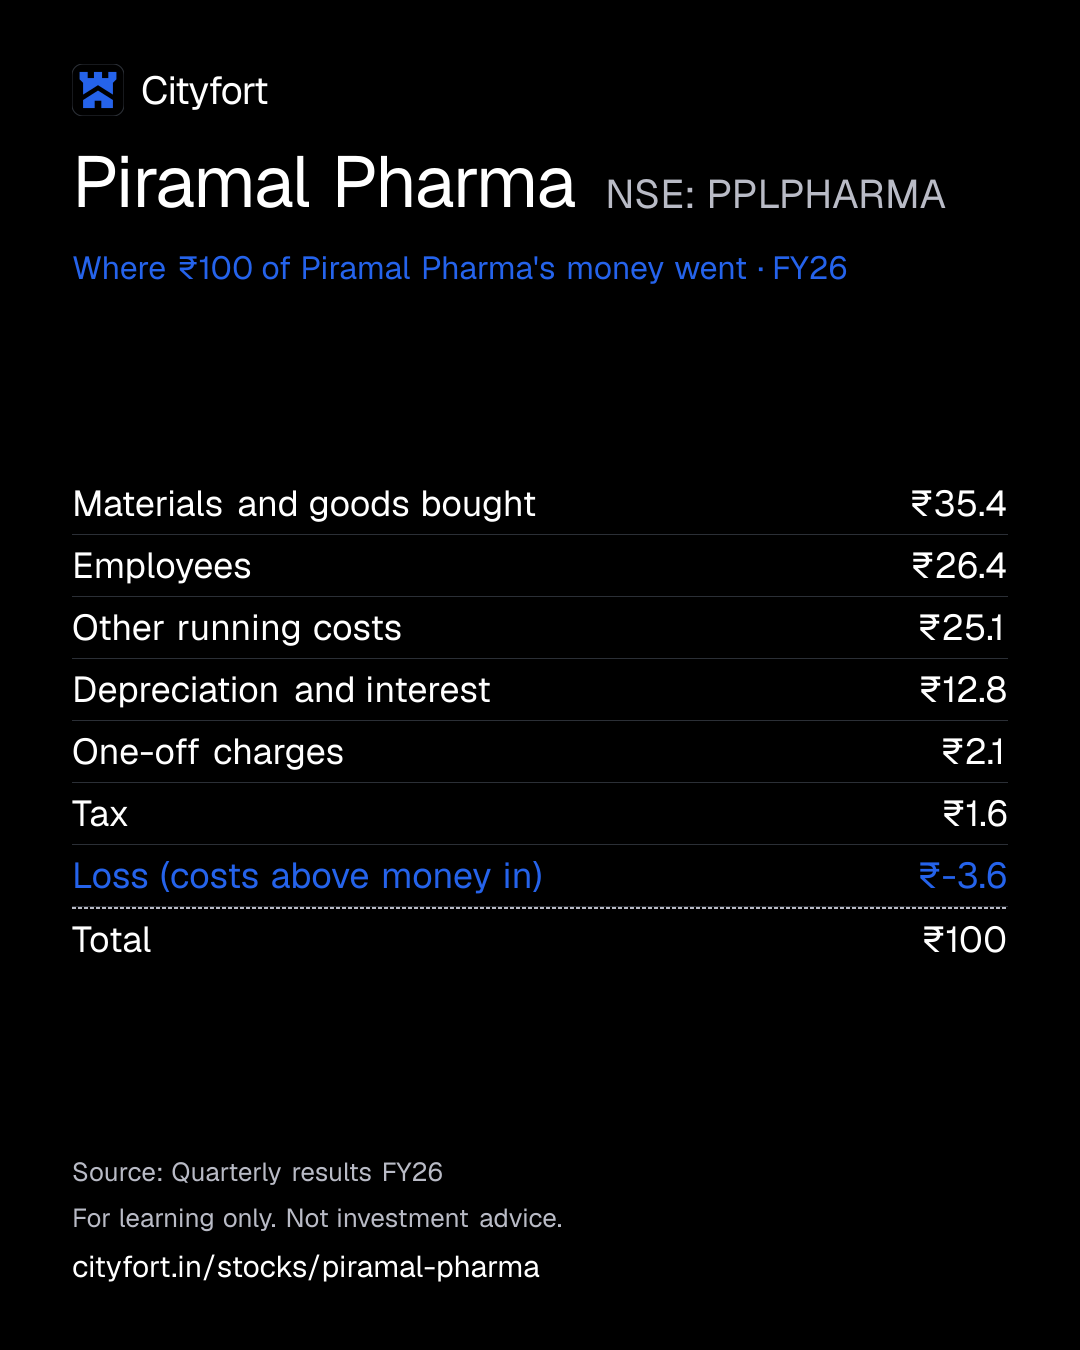
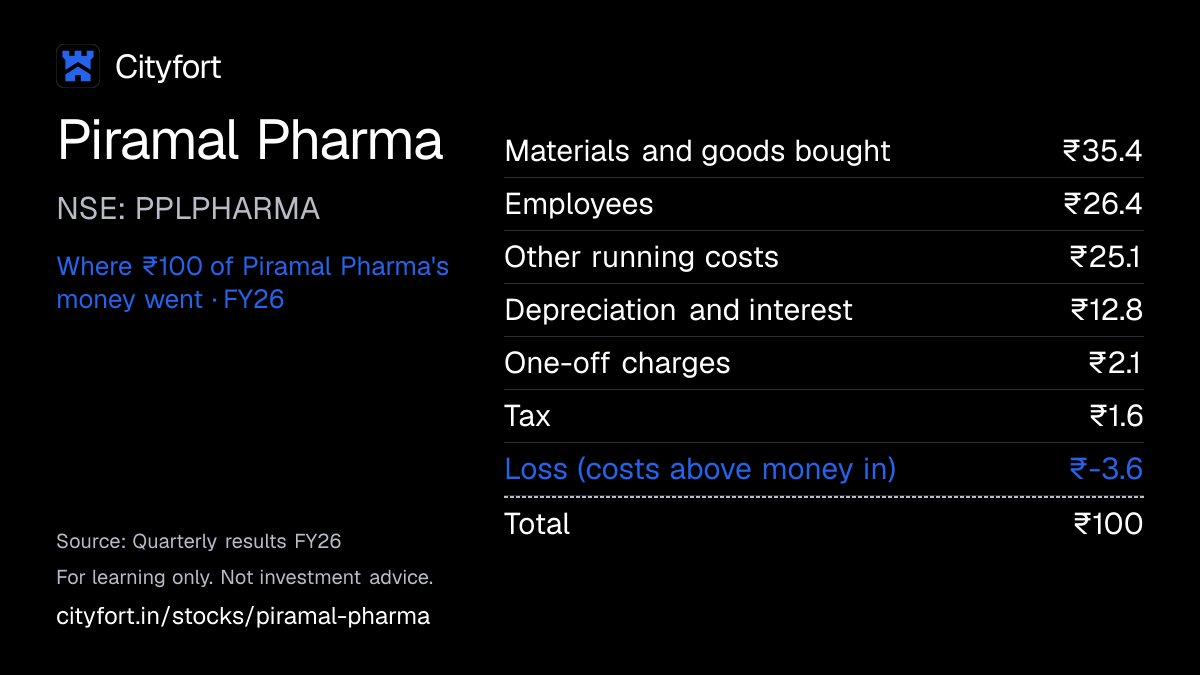
Where does ₹100 of Piramal Pharma's money go?
Piramal Pharma · FY26
Receipt for every ₹100
| Materials and goods bought | ₹35.4 |
|---|---|
| Employees | ₹26.4 |
| Other running costs | ₹25.1 |
| Depreciation and interest | ₹12.8 |
| One-off charges | ₹2.1 |
| Tax | ₹1.6 |
| Loss (costs above money in) | ₹-3.6 |
| Total | ₹100 |
Each line = amount ÷ total money in × 100. Lines may not add to exactly ₹100 because of rounding.
How this is worked out
Cityfort calculation from the FY26 annual report: each line ÷ ₹9,140 crore that came in (revenue ₹8,869 crore, other income ₹213 crore and ₹57 crore share of associates' profit) × 100. Costs took ₹103.6, so the last line is a loss of ₹3.6; rounded lines add to 99.8. One-off charges were mainly a ₹176 crore write-down of an intangible asset under development.
Save this receipt as an image
Embed this receipt or the key numbers
Paste this code into a blog or website to show the card you choose, with a link back to this page.
Each week: the next company due to report results, explained in 5 points.
We'll email you once a week with what changed on Cityfort. Facts only, no tips. Unsubscribe any time.
We store your email address with Kit, our email provider, which also records when you sign up and whether you open or click our emails. We send a confirmation email first. See our privacy policy.
02The business in one line
What does Piramal Pharma do?
Drug companies, hospitals and Indian shoppers pay Piramal Pharma; of every ₹100 that came in during FY26, ₹35.4 went on materials and ₹26.4 on staff, and costs ended ₹3.6 above income.
- By the company's presentation figures, contract development and manufacturing (CDMO) brought in 55% of FY26 revenue, hospital generics 30% and consumer brands 14%.
- FY26 ended in a ₹326 crore loss after ₹196 crore of one-off charges; in Q2 FY27 revenue rose 28.1% from a year earlier and profit for owners was ₹5.6 crore.
03Who pays it
Who pays Piramal Pharma?
Drug companies (CDMO)
55%
of revenue
Big pharma (32% of FY26 CDMO revenue), emerging biotech companies (33%), generics makers (27%) and others; more than 500 customers. Share is the company's presentation figure.
Hospitals and their buyers (hospital generics)
30%
of revenue
More than 6,000 hospital customers in over 100 countries; inhalation anaesthesia was 64% of FY26 hospital generics revenue. Share is the company's presentation figure.
Indian consumers (consumer healthcare)
14%
of revenue
Sold through more than 180,000 chemist and cosmetics outlets, 13,000 modern-trade stores and online; e-commerce was 27% of FY26 consumer sales. Share is the company's presentation figure.
- Drug companies (CDMO)55%
- Hospitals and their buyers (hospital generics)30%
- Indian consumers (consumer healthcare)14%
How spread out the customers are
The company does not name customers. Its largest CDMO customer was 6% of FY26 CDMO revenue and the top 10 were 36% (CARE); with CDMO at 55% of revenue, the largest customer was about 3% of company revenue (Cityfort calculation).
04How it makes money
How does Piramal Pharma make money?
Plants, staff and debt cost money whether orders are high or low, so small revenue changes move profit a lot.
In FY26 revenue fell 3.1% but EBITDA after one-off charges fell 49.8% (Cityfort calculation). CARE's Jul 2026 report says capacity at overseas sites is underutilised. In H1 FY27 revenue rose 22.9% and the company's own EBITDA rose 72%.
EBITDA per ₹100 of revenue (after one-off charges)
₹15.8₹8.2
FY25 to FY26
- Drug companies hire Piramal Pharma to develop medicines; 28 of the molecules were in Phase III trials in Sep 2026.
- Approved medicines move to commercial manufacturing, 71% of FY26 CDMO revenue according to CARE.
- Plants, staff (₹2,416 crore in FY26) and interest (₹341 crore) cost money whether orders are high or low.
- When orders fall, as CDMO revenue did by 10% in FY26, profit falls faster than revenue.
- When orders return, as in H1 FY27 (CDMO revenue +28%), the same plants earn more.
↺ Step 5 feeds back into step 1.
Sources (4)
05Business segments · FY26
Which businesses make up Piramal Pharma?
CDMO (contract development and manufacturing)
55%Company presentation figure, not an audited segment. Develops and makes medicines for other drug companies; revenue fell 10% in FY26 and rose 28% in H1 FY27.
Revenue ₹4,915 cr
Complex hospital generics
30%Company presentation figure, not an audited segment. Anaesthesia, spinal pain and other hospital medicines; revenue rose 3% in FY26 and 24% in H1 FY27, including the first Kenalog sales.
Revenue ₹2,703 cr
Consumer healthcare
14%Company presentation figure, not an audited segment. Over-the-counter brands in India; revenue rose 17% in FY26 and 14% in H1 FY27.
Revenue ₹1,274 cr
How the mix changed
- CDMO (contract development and manufacturing)
- Complex hospital generics
- Consumer healthcare
Revenue by segment, FY23 to FY26.
₹ crore
See the numbers
06The numbers · Consolidated · ₹ crore
How has Piramal Pharma done?
Piramal Enterprises demerged its pharma business into Piramal Pharma under a scheme effective 18 Aug 2022 (appointed date 1 Apr 2022); the shares listed on 19 Oct 2022. Only FY23–FY26, all on the post-demerger basis, are shown.
Revenue
₹8,869 crFY26
Revenue rose from ₹7,082 crore in FY23 to ₹9,151 crore in FY25, fell 3.1% to ₹8,869 crore in FY26, and was ₹2,617 crore in Q2 FY27, up 28.1% from Q2 FY26; Q4 has been the largest quarter each year.
₹ crore
See the numbers
Net profit
−₹326 crFY26
Piramal Pharma lost ₹326 crore in FY26, after ₹196 crore of one-off charges including a ₹176 crore write-down, against a ₹91 crore profit in FY25; Q2 FY27 profit for owners was ₹5.6 crore (₹5.0 crore including Yapan Bio's minority holders).
₹ crore
See the numbers
Net profit for every ₹100 of revenue
₹-3.7FY26
EBITDA per ₹100 of revenue fell from ₹15.8 in FY25 to ₹8.2 in FY26 after one-off charges (₹10.4 before them, ₹922 crore); EBITDA here is a Cityfort calculation (profit before tax + interest + depreciation − other income), while the company's own EBITDA, which includes other income, was ₹1,135 crore (13%).
Net margin: ₹ of net profit per ₹100 of revenue
See the numbers
Free cash flow
₹763 crFY26
Free cash flow (operating cash minus spending on plant and intangible assets) was ₹763 crore in FY26, a year in which trade payables rose ₹778 crore, and −₹468 crore in H1 FY27, whose capex line does not separate plant spending from intangible purchases such as the Kenalog brands.
₹ crore · cash from operations minus spending on plants and equipment
See the numbers
See all yearly numbers
EBITDA = profit before interest, tax and wear-and-tear of assets. Financial year runs April to March (March year end). Net profit is the share belonging to the company's owners.
Sources (16)
- Annual Report FY23 (ZIP on NSE)
- Q4 FY23 and FY23 consolidated audited results, XBRL
- Annual Report FY24
- Q4 FY24 and FY24 consolidated audited results, XBRL
- Annual Report FY25
- Q4 FY25 and FY25 consolidated results, XBRL (integrated filing)
- Annual Report FY26
- Q4 FY26 and FY26 consolidated results, XBRL (integrated filing)
- Q1 FY25 consolidated results, XBRL
- Q2 FY25 consolidated results, XBRL
- Q3 FY25 consolidated results, XBRL
- Q1 FY26 consolidated results, XBRL (integrated filing)
- Q2 FY26 consolidated results, XBRL (integrated filing)
- Q3 FY26 consolidated results, XBRL (integrated filing)
- Q1 FY27 consolidated results, XBRL (integrated filing)
- Q2 FY27 consolidated results, XBRL (integrated filing)
07Who runs it
Who runs Piramal Pharma, and did they deliver?
Nandini Piramal
Chairperson & Executive Director · since 2020
On the board since 4 Mar 2020, the day the company was incorporated.
Peter DeYoung
Executive Director & CEO, Piramal Global Pharma
Listed in the promoter group in the shareholding filings.
Vivek Valsaraj
Executive Director & Chief Financial Officer
Brian Guy
President & COO, Critical Care · since 2026
Appointed from 19 Oct 2026; Jeffrey Hampton retires from the role on 27 Nov 2026.
Maneesh Sharma
Company Secretary & Compliance Officer · since 2026
From 29 Apr 2026; Tanya Sanish's resignation took effect on 20 Feb 2026.
What they said, and what happened
1 missed · 4 too early to tell
Said on 15 May 2025
FY26 consolidated revenue growth in the mid-single digits, with reported EBITDA margin moderating to a mid-teen level (management, Q4 FY25 call).
MissedWhat happened
FY26 revenue fell 3.1% to ₹8,869 crore, the company's own EBITDA margin was 13%, and the year ended with a ₹326 crore loss.
Said on 29 Jan 2026
The Kenalog brands bought from Bristol-Myers Squibb were expected to bring annualised revenue of US$30–40 million (management, Q3 FY26 call).
Too early to tellWhat happened
The purchase completed on 1 Apr 2026 and Kenalog first added sales in Q2 FY27; the company has not disclosed the amount.
Said on 29 Apr 2026
FY27 revenue growth in the early to mid-teens, with EBITDA growing faster than revenue, excluding a previously destocked product (management, Q4 FY26 call).
Too early to tellWhat happened
On 28 Oct 2026 management raised it to about 19–20% revenue growth. In H1 FY27 revenue rose 22.9% and the company's own EBITDA 72%.
Said on 29 Apr 2026
Net debt to EBITDA, 3.6 times at Mar 2026, to stay in this range in FY27 (management, Q4 FY26 call).
Too early to tellWhat happened
The company reported 3.4 times on 30 Sep 2026, on its own EBITDA, which includes other income.
Said on 2 Jul 2025
FY2030 aspirations: revenue above US$2 billion and an EBITDA margin of about 25% (FY25 annual report).
Too early to tellWhat happened
FY26 revenue was ₹8,869 crore. On 29 Jan 2026 management said it would like to keep standing by the aspirations.
Sources (14)
- Annual Report FY26
- Shareholding pattern, quarter ended Sep 2026 (XBRL)
- Changes in senior management: Critical Care President and COO (30 Sep 2026)
- Changes in KMP and SMP, incl. company secretary (29 Jan 2026)
- Q4 FY25 earnings call transcript (call 15 May 2025)
- Q4 FY26 and FY26 consolidated results, XBRL (integrated filing)
- Q4 and FY26 press release and investor presentation (28 Apr 2026)
- Q3 FY26 earnings call transcript (call 29 Jan 2026)
- Completion of Kenalog acquisition (1 Apr 2026)
- Q2 and H1 FY27 press release and investor presentation (27 Oct 2026)
- Q4 FY26 earnings call transcript (call 29 Apr 2026)
- Q2 FY27 earnings call transcript (call 28 Oct 2026)
- Q2 FY27 consolidated results, XBRL (integrated filing)
- Annual Report FY25
08What could go wrong
What could go wrong for Piramal Pharma?
- Demand
Contract orders can swing
CDMO revenue fell 10% in FY26 to ₹4,915 crore, then rose 36% in Q2 FY27 (company figures). In May 2025 management had said customers' inventory adjustments would weigh on FY26.
Watch CDMO revenue each quarter (₹1,424 crore in Q2 FY27, company figure).
- Debt
Debt and the rating's limits
Net debt rose from ₹4,140 crore on 31 Mar 2026 to ₹4,835 crore on 30 Sep 2026 (Cityfort calculation). CARE says it could downgrade if net debt stays above 3.5 times its measure of operating profit (PBILDT) or that margin below 12%, on a sustained basis; its FY26 figure was 4.28 times.
Watch The company's net debt to EBITDA (3.4 times on 30 Sep 2026, company figure).
- Regulation
US FDA inspection results
Plants that supply the US must pass US FDA inspections. Four inspections from Dec 2025 to Sep 2026 ended with Form 483 observations; Morpeth's 7 observations (Sep 2026) had no disclosed outcome by 12 Nov 2026.
Watch The US FDA's response on Morpeth and any new Form 483.
- Execution
Tax paid while overseas sites run below capacity
In Q2 FY27 profit before tax was ₹64 crore but tax was ₹77 crore; in FY26 tax was ₹150 crore on a loss before tax. CARE's Jul 2026 report says capacity at overseas sites is underutilised.
Watch Tax against profit before tax each quarter.
- Demand
Bayer arrangement ends
The sales and distribution support arrangement with Bayer Pharmaceuticals, which earns commission, ends on 31 Dec 2026 and will not be renewed. The company says it is under 5% of consolidated revenue and does not expect a material impact on profitability.
Watch Revenue in Q4 FY27 (Jan–Mar 2027).
- Currency
Currency
Exports were 72.78% of FY26 turnover (BRSR). Management named currency movements among the reasons net debt rose in H1 FY27.
Watch Net debt and revenue in the Q3 FY27 results.
Sources (13)
- Q4 and FY26 press release and investor presentation (28 Apr 2026)
- Q2 and H1 FY27 press release and investor presentation (27 Oct 2026)
- Q4 FY25 earnings call transcript (call 15 May 2025)
- Q2 FY27 consolidated results, XBRL (integrated filing)
- Annual Report FY26
- CARE Ratings press release: ratings reaffirmed, CARE AA; Stable / CARE A1+ (17 Jul 2026)
- Q2 FY27 earnings call transcript (call 28 Oct 2026)
- US FDA inspection at Morpeth (UK): Form 483 with 7 observations (14 Sep 2026)
- US FDA inspection at Lexington (USA): Form 483 with 4 observations (11 Dec 2025)
- US FDA inspection at Digwal (India): Form 483 with 4 observations (14 Feb 2026)
- US FDA inspection at Sellersville (USA): Form 483 with 3 observations (10 May 2026)
- Expiry and non-renewal of Bayer distribution arrangement (1 Oct 2026)
- Business Responsibility and Sustainability Report FY26
09Supporters and critics
What do supporters and critics point to?
What supporters point to
- Revenue rose from ₹7,082 crore in FY23 to ₹9,151 crore in FY25, and H1 FY27 revenue was 22.9% higher than in H1 FY26.
- The company's own EBITDA rose 72% in Q2 FY27 from a year earlier, and its margin went from 11.0% to 14.7%.
- CARE reaffirmed its AA rating with a stable outlook on 17 Jul 2026 and calls liquidity strong.
- The largest CDMO customer was 6% of FY26 CDMO revenue, among more than 500 customers.
- No promoter shares were pledged in any of the 12 quarters to Sep 2026.
What critics point to
- Piramal Pharma lost ₹186 crore in FY23 and ₹326 crore in FY26, and ₹209 crore in the four quarters to Sep 2026.
- Net debt reached ₹4,835 crore on 30 Sep 2026; CARE's FY26 net debt to PBILDT of 4.28 times is above the 3.5 times it names as a downgrade trigger if sustained.
- FY26 revenue fell 3.1%, against management's May 2025 guidance of mid-single-digit growth.
- Free cash flow was −₹468 crore in H1 FY27.
- Four US FDA inspections from Dec 2025 to Sep 2026 ended with Form 483 observations.
10What to watch next
What should you watch next at Piramal Pharma?
Next event
Q3 FY27 results
Date not announced yet.
Q3 FY27 results
No board-meeting date was announced as of 12 Nov 2026. Last year's Q3 results were approved on 28 Jan 2026.
FY27 guidance
Management said on 28 Oct 2026 it expects about 19–20% revenue growth in FY27; H1 FY27 revenue rose 22.9%.
Morpeth and Bayer
The US FDA's response to Morpeth's 7 observations, and revenue after the Bayer arrangement ends on 31 Dec 2026.
11Key facts
Key facts about Piramal Pharma
- What does Piramal Pharma do?
- Piramal Pharma, based in Mumbai, develops and makes medicines under contract for other drug companies, sells anaesthesia and other hospital medicines in more than 100 countries, and sells consumer health brands in India. Piramal Pharma's FY26 revenue was ₹8,869 crore.
- How does Piramal Pharma make money?
- Piramal Pharma earns most from contract development and manufacturing (CDMO), which was 55% of FY26 revenue by the company's presentation figures; complex hospital generics were 30% and consumer healthcare 14%. Piramal Pharma's audited accounts report a single pharmaceuticals segment.
- Who are Piramal Pharma's customers?
- Piramal Pharma's customers include more than 500 drug companies for contract work, over 6,000 hospital customers for its hospital medicines, and over 180,000 chemist and cosmetics outlets in India for its consumer brands. Piramal Pharma's largest contract-manufacturing customer was 6% of FY26 CDMO revenue.
- How big is Piramal Pharma?
- Piramal Pharma had FY26 revenue of ₹8,869 crore and a loss of ₹326 crore, against revenue of ₹9,151 crore and a profit of ₹91 crore in FY25. Piramal Pharma had 6,617 permanent employees and 17 development and manufacturing sites in FY26.
- Who owns Piramal Pharma?
- In Sep 2026 Piramal Pharma's promoter group (the Ajay Piramal family, its trusts and group companies) held 34.80%, with no shares pledged. CA Alchemy Investments, a Carlyle affiliate, held 17.93% of Piramal Pharma, other foreign investors 13.65%, Indian institutions 14.44% and the public and others 19.18%.
- When did Piramal Pharma list?
- Piramal Pharma took over Piramal Enterprises' pharma business under a demerger scheme effective 18 Aug 2022, with 1 Apr 2022 as the appointed date, and Piramal Pharma's shares listed on NSE and BSE on 19 Oct 2022. Its FY23 annual report says FY23 may not be comparable with FY22.
- How much debt does Piramal Pharma have?
- On 30 Sep 2026 Piramal Pharma had borrowings of ₹5,665 crore and cash and current investments of ₹830 crore, so net debt was ₹4,835 crore (Cityfort calculation). CARE rated Piramal Pharma AA with a stable outlook on 17 Jul 2026.
- Does Piramal Pharma pay a dividend?
- Piramal Pharma paid ₹0.11 a share for FY24 and ₹0.14 a share for FY25, and proposed no dividend for FY26, a year in which Piramal Pharma made a loss of ₹326 crore.
Sources (11)
- Annual Report FY26
- Q4 FY26 and FY26 consolidated results, XBRL (integrated filing)
- CARE Ratings press release: ratings reaffirmed, CARE AA; Stable / CARE A1+ (17 Jul 2026)
- Q4 and FY26 press release and investor presentation (28 Apr 2026)
- Q2 FY27 consolidated results, XBRL (integrated filing)
- Q4 FY25 and FY25 consolidated results, XBRL (integrated filing)
- Business Responsibility and Sustainability Report FY26
- Shareholding pattern, quarter ended Sep 2026 (XBRL)
- Annual Report FY23 (ZIP on NSE)
- Annual Report FY24
- Annual Report FY25
Terms on this page
- Capital expenditure (capex)
- Credit rating
- Dividend payout ratio
- EBITDA
- FII and DII holding
- Free cash flow
- Market capitalisation
- Net debt
- Net profit
- Operating margin
Each explains the term in plain English, with the same number from other companies on Cityfort.
Go deeper
More detail from the same filings. Open any section.
12What it sells
12What it sells
What does Piramal Pharma sell?
Contract development and manufacturing (CDMO, Piramal Pharma Solutions)
Drug companies hire it to develop a medicine's recipe and then make the active ingredient or the finished dose. 157 molecules were in development for customers in Mar 2026. The company's figure for FY26 revenue was ₹4,915 crore, down 10%.
Complex hospital generics (Piramal Critical Care)
Inhaled anaesthesia such as sevoflurane, spinal (intrathecal) pain and spasticity medicines, and injectable anaesthesia, sold to hospitals. The company's figure for FY26 revenue was ₹2,703 crore, up 3%.
Kenalog brands
A corticosteroid injection (triamcinolone acetonide) for inflammation, sold in 15 countries under names such as Kenalog, Kenacort and Adcortyl. Bought from Bristol-Myers Squibb for US$35 million upfront plus up to US$65 million on milestones; completed on 1 Apr 2026, with first sales in Q2 FY27.
Consumer healthcare (Piramal Consumer Healthcare)
About 25 over-the-counter brands sold through chemists, shops and online in India. The company's figure for FY26 revenue was ₹1,274 crore, up 17%.
Think of it like this
The CDMO business is like a hired kitchen: drug companies bring the recipe, and Piramal Pharma develops and cooks it at scale in approved plants.
What it does
- Does: Develops and makes medicines and their ingredients for more than 500 drug companies
- Does: Sells anaesthesia gases and spinal pain medicines to hospitals in more than 100 countries
- Does: Sells about 25 over-the-counter brands in India
- Does: Earns commission for sales and distribution support to Bayer, an arrangement that ends on 31 Dec 2026
What it does not do
- Does not: Report audited profit for each business: its accounts have one segment, pharmaceuticals
- Does not: Name its contract-manufacturing customers
- Does not: Include Piramal Finance, into which Piramal Enterprises merged in Sep 2025: it is a separate promoter-group company that holds Piramal Pharma shares
- Does not: Have any promoter shares pledged: none in the 12 quarters to Sep 2026
Sources (6)
- Annual Report FY26
- CARE Ratings press release: ratings reaffirmed, CARE AA; Stable / CARE A1+ (17 Jul 2026)
- Q4 and FY26 press release and investor presentation (28 Apr 2026)
- Agreement to acquire Kenalog brands from Bristol-Myers Squibb (28 Jan 2026)
- Completion of Kenalog acquisition (1 Apr 2026)
- Q2 and H1 FY27 press release and investor presentation (27 Oct 2026)
13How the money flows
13How the money flows · FY26
How does money flow through Piramal Pharma?
Money in
- Revenue from operations₹8,869 cr
- Share of associates' profit (AbbVie Therapeutics India, Yapan Bio)₹57.2 cr
- Other income₹213 cr
The company
Piramal Pharma
₹9,139 cr came in
Money out
- Materials and goods bought₹3,239 cr
- Employee costs₹2,416 cr
- Other running costs₹2,293 cr
- Depreciation and interest₹1,172 cr
- One-off charges (mainly a ₹176 crore write-down)₹196 cr
- Tax₹150 cr
- Loss for the year−₹326 cr
- In FY26 Piramal Pharma took in ₹8,869 crore of revenue, ₹213 crore of other income and ₹57 crore as its share of associates' profit.
- Materials and goods bought took ₹3,239 crore, and employees ₹2,416 crore.
- Other running costs took ₹2,293 crore.
- Depreciation took ₹831 crore, interest ₹341 crore, one-off charges ₹196 crore and tax ₹150 crore.
- Costs were ₹326 crore more than the money that came in, so FY26 ended in a loss.
14What it needs to run
14What it needs to run
What does Piramal Pharma need to run?
Plants in three regions
17 development and manufacturing sites in FY26, in North America, the UK and India, one of them through Yapan Bio. Examples: sterile injectables at Lexington (US), antibody-drug conjugates at Grangemouth (UK), anaesthesia at Bethlehem (US) and Digwal (India).
Regulators' approval
Plants that supply the US must pass US FDA inspections. The company counts 427 regulatory inspections, 51 of them by the US FDA, since FY12 (to Sep 2026).
Materials
Materials and goods bought cost ₹3,239 crore in FY26, ₹35.4 of every ₹100 that came in.
People
6,617 permanent employees, 503 permanent workers and 3,163 other workers in FY26, according to the BRSR.
Borrowed money
Borrowings were ₹5,665 crore on 30 Sep 2026, and FY26 interest cost was ₹341 crore.
15Where it sells
15Where it sells · FY26
Where does Piramal Pharma sell?
- North America40%
- India23%
- Europe21%
- Japan5%
- Other countries11%
16Where growth could come from
16Where growth could come from
Where could Piramal Pharma's growth come from?
Management said on the Q2 FY27 call (28 Oct 2026) that it was upgrading its FY27 guidance and now expects "annual revenue growth of approximately 19% to 20% with a meaningful higher growth in profitability". On 29 Apr 2026 it had guided revenue growth in the early to mid-teens.
Contract development and manufacturing
Mixed−10% in FY26; +28% in H1 FY27 (company figures)
CDMO revenue was ₹2,611 crore in H1 FY27. The company says on-patent commercial manufacturing revenue rose 39% and it added 22 CDMO customers in H1 FY27.
Status: Mixed, partly on track.
Antibody-drug conjugates (ADCs)
WorkingUS$26 million → US$40 million, H1 FY26 to H1 FY27
ADCs attach a drug to an antibody that seeks out cancer cells. Piramal Pharma makes them for customers at Grangemouth in the UK; the company says ADC services revenue rose 51%.
Status: Working, on track against what the company said.
Hospital generics and Kenalog
Working+24% in H1 FY27 (company figure)
Hospital generics revenue was ₹1,592 crore in H1 FY27, including the first Kenalog sales, whose amount is not disclosed. Citing IQVIA, the company said in its Oct 2026 results presentation that its US sevoflurane value share was 48%.
Status: Working, on track against what the company said.
Consumer brands
Working+17% in FY26; +14% in H1 FY27 (company figures)
Larger "power brands" were 53% and e-commerce 28% of consumer sales in H1 FY27. Management said on 28 Oct 2026 the business is profitable at a single-digit margin.
Status: Working, on track against what the company said.
US plant expansions
EarlyUS$90 million across Lexington and Riverview (company figure)
The company says the Riverview expansion for highly potent ingredients is complete and Lexington's sterile fill-finish expansion is progressing to plan; CARE says Lexington is targeted for completion by the end of 2027.
Status: Early, too early to judge.
Status compares progress with what the company itself said it would do: Working = on track against what the company said; Mixed = partly on track; Behind = behind the company's own plan; New = recently announced; Early = too early to judge.
Sources (6)
- Q2 FY27 earnings call transcript (call 28 Oct 2026)
- Q4 FY26 earnings call transcript (call 29 Apr 2026)
- Q4 and FY26 press release and investor presentation (28 Apr 2026)
- Q2 and H1 FY27 press release and investor presentation (27 Oct 2026)
- Annual Report FY26
- CARE Ratings press release: ratings reaffirmed, CARE AA; Stable / CARE A1+ (17 Jul 2026)
17Financial strength and debt
17Financial strength · 30 Sep 2026
How much debt does Piramal Pharma have?
- Total debt₹5,665 cr
- Cash and investments₹830 cr
- Net debt (debt minus cash)₹4,835 cr
- Net worth (shareholders' money)₹8,165 cr
- Debt to equity
- 0.69×
- ₹ of debt for every ₹1 of shareholders' money
- Borrowings = long-term ₹4,454 crore + short-term ₹1,212 crore. Cash and investments = cash, other bank balances and current investments. Lease liabilities (₹179 crore on 31 Mar 2026) are not counted.
- Net debt was ₹4,140 crore on 31 Mar 2026 on the same calculation. The company's own figures are ₹4,859 crore for 30 Sep 2026 and ₹4,164 crore for 31 Mar 2026 (₹4,140 crore in its Apr 2026 presentation).
- The company reported net debt of 3.4 times its EBITDA (its definition, which includes other income) on 30 Sep 2026, against 3.7 in March. Asked on 28 Oct 2026 why net debt rose, management named the Lexington expansion, the Kenalog purchase, the Yapan Bio stake and currency movements.
- CARE (17 Jul 2026) calls liquidity strong: about ₹1,332 crore of unencumbered cash and liquid investments on 31 Mar 2026, and working-capital limits of ₹2,702 crore, less than half used.
- Debt to equity = borrowings ÷ total equity of ₹8,165 crore, which includes Yapan Bio's minority holders from Q2 FY27 (Cityfort calculation).
Sources (6)
- Q2 FY27 consolidated results, XBRL (integrated filing)
- Annual Report FY26
- Q2 and H1 FY27 press release and investor presentation (27 Oct 2026)
- Q4 and FY26 press release and investor presentation (28 Apr 2026)
- Q2 FY27 earnings call transcript (call 28 Oct 2026)
- CARE Ratings press release: ratings reaffirmed, CARE AA; Stable / CARE A1+ (17 Jul 2026)
18Who owns it
18Who owns it · Q2 FY27
Who owns Piramal Pharma?
- Promoters (founders or parent company)34.8%
- Foreign institutions (FII)13.7%
- Indian institutions (DII)14.4%
- Public and others37.1%
Promoter pledge
No promoter shares were pledged in Q2 FY27.
How ownership changed
* Pledged = share of the promoters' own holding reported as pledged. In older filings this can include shares “otherwise encumbered”; the governance flags say when.
† Others = CA Alchemy Investments, a Carlyle affiliate, shown on its own in every quarter: the filings list it under foreign direct investment (institutions) to Mar 2026 and under foreign companies (non-institutions) from Jun 2026.
Sources (13)
- Shareholding pattern, quarter ended Sep 2026 (XBRL)
- Shareholding pattern, quarter ended Jun 2026 (XBRL)
- Shareholding pattern, quarter ended Mar 2026 (XBRL)
- Shareholding pattern, quarter ended Dec 2025 (XBRL)
- Shareholding pattern, quarter ended Sep 2025 (XBRL)
- Shareholding pattern, quarter ended Jun 2025 (XBRL)
- Shareholding pattern, quarter ended Mar 2025 (XBRL)
- Shareholding pattern, quarter ended Dec 2024 (XBRL)
- Shareholding pattern, quarter ended Sep 2024 (XBRL)
- Shareholding pattern, quarter ended Jun 2024 (XBRL)
- Shareholding pattern, quarter ended Mar 2024 (XBRL)
- Shareholding pattern, quarter ended Dec 2023 (XBRL)
- CARE Ratings press release: ratings reaffirmed, CARE AA; Stable / CARE A1+ (17 Jul 2026)
19What it does with profit
19What it does with profit
What does Piramal Pharma do with its profit?
Dividend per share
₹0.00FY26
Dividend paid for each share, by financial year.
₹ per share
See the numbers
Money raised · 27 Jul 2023
Rights issue of 129,629,630 shares at ₹81 each, approved by the board's rights issue committee on 27 Jul 2023 (record date 2 Aug 2023). The promoter group took part.
₹1,050 cr
20Governance signals
20Governance signals
What do Piramal Pharma's governance filings show?
- Auditor
- Suresh Surana & Associates LLP, since 2025
- Auditor changes
- 13 Jun 2025: Deloitte Haskins & Sells LLP → Suresh Surana & Associates LLP (Deloitte's term ended at the 5th AGM in 2025. The board approved the new firm on 13 Jun 2025 for five years, to the 10th AGM in 2030. Its FY26 audit opinion was unmodified.)
- Audit qualifications
- None reported
- Related-party dealings
- The FY26 consolidated accounts list as related parties two associates (AbbVie Therapeutics India, a 49% ophthalmology joint venture with AbbVie that the CDMO business supplies, and Yapan Bio), PayU India and Trilegal (entities in which key managers have significant influence), the employees' provident fund trust and key managers. The company says all related-party transactions were on normal commercial terms at market rates.
- Credit rating
- CARE CARE AA (long-term, issuer and NCDs); CARE A1+ (₹200 crore commercial paper) (outlook Stable), 17 Jul 2026
A credit rating describes the company's ability to repay debt. It is not a rating of the share.
Flags to know about
regulatory · 14 Sep 2026
US FDA inspections
The US FDA issued a Form 483 (a list of inspectors' observations) with 7 observations at Morpeth, UK, after an inspection that ended on 11 Sep 2026; the company said it was preparing a response, and had disclosed no outcome by 12 Nov 2026. Form 483s at Lexington (4 observations, Dec 2025), Digwal (4, Feb 2026) and Sellersville (3, May 2026) were followed by inspection reports (EIRs) in Apr, May and Jul 2026; Lexington's was classified VAI (voluntary action indicated).
regulatory · 3 Jun 2026
Dahej closure direction, revoked
On 3 Feb 2026 the Gujarat Pollution Control Board directed closure of the Dahej plant, alleging violations under section 33-A of the Water Act, and asked for a ₹15 lakh bank guarantee; on 10 Feb it imposed ₹1 crore of interim environmental damage compensation. The company called the alleged violation unsubstantiated. The board revoked the closure on an interim basis on 13 Feb 2026, and permanently, as disclosed on 3 Jun 2026.
regulatory · 29 Sep 2026
GST order on input tax credit
On 28 Sep 2026 a CGST Additional Commissioner confirmed a demand of ₹4.06 crore of input tax credit for FY21 to FY23, with interest and an equal penalty. The company said it will appeal and does not expect a material impact.
disclosure · 28 Apr 2026
Business split is presentation data
The audited accounts report one segment, pharmaceuticals. The CDMO, hospital generics and consumer figures come from results presentations with no reconciliation; in FY26 they add up to ₹8,892 crore against reported revenue of ₹8,869 crore.
other · 20 Jul 2026
Carlyle's stake moved category in the shareholding filings
CA Alchemy Investments, a Carlyle affiliate, held 17.95% in Mar 2026 and 17.93% in Jun 2026. The Jun 2026 filing moved it from foreign direct investment (institutions) to foreign companies (non-institutions), so reported foreign institutional holding went from 30.18% to 12.52%. This page shows it separately in every quarter.
Sources (21)
- Appointment of Suresh Surana & Associates LLP as statutory auditors (13 Jun 2025)
- Annual Report FY26
- Annual Report FY25
- Q4 and FY26 press release and investor presentation (28 Apr 2026)
- CARE Ratings press release: ratings reaffirmed, CARE AA; Stable / CARE A1+ (17 Jul 2026)
- US FDA inspection at Morpeth (UK): Form 483 with 7 observations (14 Sep 2026)
- US FDA inspection at Lexington (USA): Form 483 with 4 observations (11 Dec 2025)
- US FDA inspection at Digwal (India): Form 483 with 4 observations (14 Feb 2026)
- US FDA inspection at Sellersville (USA): Form 483 with 3 observations (10 May 2026)
- US FDA EIR (VAI) received for Lexington (13 Apr 2026)
- US FDA EIR received for Digwal (18 May 2026)
- US FDA EIR received for Sellersville (9 Jul 2026)
- GPCB closure directions for Dahej site (4 Feb 2026)
- GPCB interim environmental damage compensation of Rs 1 crore, Dahej (11 Feb 2026)
- GPCB interim revocation of Dahej closure directions (14 Feb 2026)
- GPCB permanent revocation of Dahej closure directions (3 Jun 2026)
- GST order-in-original on input tax credit, FY21-FY23 (29 Sep 2026)
- Q2 FY27 consolidated results, XBRL (integrated filing)
- Shareholding pattern, quarter ended Mar 2026 (XBRL)
- Shareholding pattern, quarter ended Jun 2026 (XBRL)
- Shareholding pattern, quarter ended Sep 2026 (XBRL)
21What the market paid
21What the market paid · price as of 11 Nov 2026
What did the market pay for Piramal Pharma on 11 Nov 2026?
Price as of 11 Nov 2026 (shown for education; prices change daily).
Price as of 11 Nov 2026: ₹245.25, the NSE closing price. Market value = price × 1,331,348,130 shares (Sep 2026 shareholding filing) = ₹32,651 crore. P/E (price ÷ a year's profit per share) is not shown: Piramal Pharma made a loss in FY26 (₹326 crore) and in the last four quarters (₹209 crore, Q3 FY26 to Q2 FY27). P/B = market value ÷ total equity of ₹8,165 crore on 30 Sep 2026 = 4.0. All are Cityfort calculations from the NSE bhavcopy and the company's filings.
- Share price
- ₹245.25
- Market value (market cap)
- ₹32,651 cr
- P/B
- 4×
Source: NSE bhavcopy (full), 11 Nov 2026; Shareholding pattern, quarter ended Sep 2026 (XBRL); Q2 FY27 consolidated results, XBRL (integrated filing) and 3 more
Sources (6)
- NSE bhavcopy (full), 11 Nov 2026
- Shareholding pattern, quarter ended Sep 2026 (XBRL)
- Q2 FY27 consolidated results, XBRL (integrated filing)
- Q3 FY26 consolidated results, XBRL (integrated filing)
- Q4 FY26 and FY26 consolidated results, XBRL (integrated filing)
- Q1 FY27 consolidated results, XBRL (integrated filing)
22How it got here
22How it got here
How did Piramal Pharma get here?
2020
Milestone
Incorporated
Piramal Pharma Ltd was incorporated on 4 Mar 2020, according to its FY26 annual report.
2022
Business-model change
Pharma business demerged into it
Under a scheme approved by the NCLT on 12 Aug 2022 and effective 18 Aug 2022, Piramal Enterprises' pharma business moved into Piramal Pharma, with 1 Apr 2022 as the appointed date.
2022
Milestone
Listed on NSE and BSE
Piramal Pharma's shares listed on 19 Oct 2022.
2023
Milestone
₹1,050 crore rights issue
Existing shareholders were offered new shares at ₹81 each; the promoter group took part.
2025
Milestone
Rating upgraded
CARE upgraded the long-term rating to AA with a stable outlook on 21 Jul 2025.
2026
Crisis
Dahej closure direction, then revoked
A closure direction for the Dahej plant in Feb 2026 was revoked on an interim basis within days, and permanently by Jun 2026.
2026
Business-model change
Bought Kenalog brands
Agreed on 28 Jan 2026 to buy Kenalog and related brands from Bristol-Myers Squibb; completed on 1 Apr 2026.
2026
Crisis
FY26 loss
FY26 revenue fell 3.1% and the year ended with a ₹326 crore loss, including a ₹176 crore write-down.
2026
Milestone
Yapan Bio becomes a subsidiary
Raised its stake in Yapan Bio from 33.33% to 74.00% for about ₹76 crore in Aug 2026.
Sources (14)
- Annual Report FY26
- Annual Report FY23 (ZIP on NSE)
- Annual Report FY24
- CARE Ratings press release: ratings reaffirmed, CARE AA; Stable / CARE A1+ (17 Jul 2026)
- Intimation: CARE upgrade to CARE AA; Stable (21 Jul 2025)
- GPCB closure directions for Dahej site (4 Feb 2026)
- GPCB interim revocation of Dahej closure directions (14 Feb 2026)
- GPCB permanent revocation of Dahej closure directions (3 Jun 2026)
- Agreement to acquire Kenalog brands from Bristol-Myers Squibb (28 Jan 2026)
- Completion of Kenalog acquisition (1 Apr 2026)
- Q4 FY26 and FY26 consolidated results, XBRL (integrated filing)
- Q4 and FY26 press release and investor presentation (28 Apr 2026)
- Exercise of call option for additional stake in Yapan Bio (10 Aug 2026)
- Completion of acquisition of additional 40.67% in Yapan Bio (18 Aug 2026)
23Sources and changes
Where every number on this page comes from
Sources (58 documents)
- S1Annual Report FY26 · Piramal Pharma Ltd (filed with NSE) · Tier 1: company or exchange filing · 3 Jul 2026
- S2Annual Report FY25 · Piramal Pharma Ltd (filed with NSE) · Tier 1: company or exchange filing · 2 Jul 2025
- S3Annual Report FY24 · Piramal Pharma Ltd (filed with NSE) · Tier 1: company or exchange filing · 2 Jul 2024
- S4Annual Report FY23 (ZIP on NSE) · Piramal Pharma Ltd (filed with NSE) · Tier 1: company or exchange filing · 6 Jul 2023
- S6Q2 FY27 consolidated results, XBRL (integrated filing) · NSE (company XBRL filing) · Tier 1: company or exchange filing · 27 Oct 2026
- S7Q1 FY27 consolidated results, XBRL (integrated filing) · NSE (company XBRL filing) · Tier 1: company or exchange filing · 29 Jul 2026
- S8Q4 FY26 and FY26 consolidated results, XBRL (integrated filing) · NSE (company XBRL filing) · Tier 1: company or exchange filing · 28 Apr 2026
- S9Q3 FY26 consolidated results, XBRL (integrated filing) · NSE (company XBRL filing) · Tier 1: company or exchange filing · 29 Jan 2026
- S10Q2 FY26 consolidated results, XBRL (integrated filing) · NSE (company XBRL filing) · Tier 1: company or exchange filing · 5 Nov 2025
- S11Q1 FY26 consolidated results, XBRL (integrated filing) · NSE (company XBRL filing) · Tier 1: company or exchange filing · 28 Jul 2025
- S12Q4 FY25 and FY25 consolidated results, XBRL (integrated filing) · NSE (company XBRL filing) · Tier 1: company or exchange filing · 14 May 2025
- S13Q3 FY25 consolidated results, XBRL · NSE (company XBRL filing) · Tier 1: company or exchange filing · 28 Jan 2025
- S14Q2 FY25 consolidated results, XBRL · NSE (company XBRL filing) · Tier 1: company or exchange filing · 23 Oct 2024
- S15Q1 FY25 consolidated results, XBRL · NSE (company XBRL filing) · Tier 1: company or exchange filing · 26 Jul 2024
- S16Q4 FY24 and FY24 consolidated audited results, XBRL · NSE (company XBRL filing) · Tier 1: company or exchange filing · 10 May 2024
- S17Q4 FY23 and FY23 consolidated audited results, XBRL · NSE (company XBRL filing) · Tier 1: company or exchange filing · 25 May 2023
- S18Q2 and H1 FY27 press release and investor presentation (27 Oct 2026) · Piramal Pharma Ltd (filed with NSE) · Tier 1: company or exchange filing · 27 Oct 2026
- S20Q4 and FY26 press release and investor presentation (28 Apr 2026) · Piramal Pharma Ltd (filed with NSE) · Tier 1: company or exchange filing · 28 Apr 2026
- S22Q2 FY27 earnings call transcript (call 28 Oct 2026) · Piramal Pharma Ltd (company website) · Tier 1: company or exchange filing · 30 Oct 2026
- S24Q4 FY26 earnings call transcript (call 29 Apr 2026) · Piramal Pharma Ltd (company website) · Tier 1: company or exchange filing · 30 Apr 2026
- S25Q3 FY26 earnings call transcript (call 29 Jan 2026) · Piramal Pharma Ltd (company website) · Tier 1: company or exchange filing · 30 Jan 2026
- S26Q4 FY25 earnings call transcript (call 15 May 2025) · Piramal Pharma Ltd (company website) · Tier 1: company or exchange filing · 16 May 2025
- S27Shareholding pattern, quarter ended Sep 2026 (XBRL) · NSE (company XBRL filing) · Tier 1: company or exchange filing · 21 Oct 2026
- S28Shareholding pattern, quarter ended Jun 2026 (XBRL) · NSE (company XBRL filing) · Tier 1: company or exchange filing · 20 Jul 2026
- S29Shareholding pattern, quarter ended Mar 2026 (XBRL) · NSE (company XBRL filing) · Tier 1: company or exchange filing · 20 Apr 2026
- S30Shareholding pattern, quarter ended Dec 2025 (XBRL) · NSE (company XBRL filing) · Tier 1: company or exchange filing · 20 Jan 2026
- S31Shareholding pattern, quarter ended Sep 2025 (XBRL) · NSE (company XBRL filing) · Tier 1: company or exchange filing · 17 Oct 2025
- S32Shareholding pattern, quarter ended Jun 2025 (XBRL) · NSE (company XBRL filing) · Tier 1: company or exchange filing · 21 Jul 2025
- S33Shareholding pattern, quarter ended Mar 2025 (XBRL) · NSE (company XBRL filing) · Tier 1: company or exchange filing · 21 Apr 2025
- S34Shareholding pattern, quarter ended Dec 2024 (XBRL) · NSE (company XBRL filing) · Tier 1: company or exchange filing · 17 Jan 2025
- S35Shareholding pattern, quarter ended Sep 2024 (XBRL) · NSE (company XBRL filing) · Tier 1: company or exchange filing · 18 Oct 2024
- S36Shareholding pattern, quarter ended Jun 2024 (XBRL) · NSE (company XBRL filing) · Tier 1: company or exchange filing · 19 Jul 2024
- S37Shareholding pattern, quarter ended Mar 2024 (XBRL) · NSE (company XBRL filing) · Tier 1: company or exchange filing · 19 Apr 2024
- S38Shareholding pattern, quarter ended Dec 2023 (XBRL) · NSE (company XBRL filing) · Tier 1: company or exchange filing · 19 Jan 2024
- S39CARE Ratings press release: ratings reaffirmed, CARE AA; Stable / CARE A1+ (17 Jul 2026) · CARE Ratings Ltd · Tier 2: rating agency or regulator · 17 Jul 2026
- S40Intimation: CARE upgrade to CARE AA; Stable (21 Jul 2025) · Piramal Pharma Ltd (filed with NSE) · Tier 1: company or exchange filing · 21 Jul 2025
- S42Business Responsibility and Sustainability Report FY26 · Piramal Pharma Ltd (filed with NSE) · Tier 1: company or exchange filing · 3 Jul 2026
- S43NSE bhavcopy (full), 11 Nov 2026 · NSE · Tier 1: company or exchange filing · 11 Nov 2026
- S44Expiry and non-renewal of Bayer distribution arrangement (1 Oct 2026) · Piramal Pharma Ltd (filed with NSE) · Tier 1: company or exchange filing · 1 Oct 2026
- S45Changes in senior management: Critical Care President and COO (30 Sep 2026) · Piramal Pharma Ltd (filed with NSE) · Tier 1: company or exchange filing · 30 Sep 2026
- S46GST order-in-original on input tax credit, FY21-FY23 (29 Sep 2026) · Piramal Pharma Ltd (filed with NSE) · Tier 1: company or exchange filing · 29 Sep 2026
- S47US FDA inspection at Morpeth (UK): Form 483 with 7 observations (14 Sep 2026) · Piramal Pharma Ltd (filed with NSE) · Tier 1: company or exchange filing · 14 Sep 2026
- S48Exercise of call option for additional stake in Yapan Bio (10 Aug 2026) · Piramal Pharma Ltd (filed with NSE) · Tier 1: company or exchange filing · 10 Aug 2026
- S49Completion of acquisition of additional 40.67% in Yapan Bio (18 Aug 2026) · Piramal Pharma Ltd (filed with NSE) · Tier 1: company or exchange filing · 18 Aug 2026
- S52GPCB closure directions for Dahej site (4 Feb 2026) · Piramal Pharma Ltd (filed with NSE) · Tier 1: company or exchange filing · 4 Feb 2026
- S53GPCB interim environmental damage compensation of Rs 1 crore, Dahej (11 Feb 2026) · Piramal Pharma Ltd (filed with NSE) · Tier 1: company or exchange filing · 11 Feb 2026
- S54GPCB interim revocation of Dahej closure directions (14 Feb 2026) · Piramal Pharma Ltd (filed with NSE) · Tier 1: company or exchange filing · 14 Feb 2026
- S55GPCB permanent revocation of Dahej closure directions (3 Jun 2026) · Piramal Pharma Ltd (filed with NSE) · Tier 1: company or exchange filing · 3 Jun 2026
- S56Agreement to acquire Kenalog brands from Bristol-Myers Squibb (28 Jan 2026) · Piramal Pharma Ltd (filed with NSE) · Tier 1: company or exchange filing · 28 Jan 2026
- S57Completion of Kenalog acquisition (1 Apr 2026) · Piramal Pharma Ltd (filed with NSE) · Tier 1: company or exchange filing · 1 Apr 2026
- S58US FDA inspection at Lexington (USA): Form 483 with 4 observations (11 Dec 2025) · Piramal Pharma Ltd (filed with NSE) · Tier 1: company or exchange filing · 11 Dec 2025
- S59US FDA inspection at Digwal (India): Form 483 with 4 observations (14 Feb 2026) · Piramal Pharma Ltd (filed with NSE) · Tier 1: company or exchange filing · 14 Feb 2026
- S60US FDA inspection at Sellersville (USA): Form 483 with 3 observations (10 May 2026) · Piramal Pharma Ltd (filed with NSE) · Tier 1: company or exchange filing · 10 May 2026
- S61US FDA EIR (VAI) received for Lexington (13 Apr 2026) · Piramal Pharma Ltd (filed with NSE) · Tier 1: company or exchange filing · 13 Apr 2026
- S62US FDA EIR received for Digwal (18 May 2026) · Piramal Pharma Ltd (filed with NSE) · Tier 1: company or exchange filing · 18 May 2026
- S63US FDA EIR received for Sellersville (9 Jul 2026) · Piramal Pharma Ltd (filed with NSE) · Tier 1: company or exchange filing · 9 Jul 2026
- S64Appointment of Suresh Surana & Associates LLP as statutory auditors (13 Jun 2025) · Piramal Pharma Ltd (filed with NSE) · Tier 1: company or exchange filing · 13 Jun 2025
- S66Changes in KMP and SMP, incl. company secretary (29 Jan 2026) · Piramal Pharma Ltd (filed with NSE) · Tier 1: company or exchange filing · 29 Jan 2026
Changes to this page (v1 · 12 Nov 2026)
- v1 · 12 Nov 2026First version. (first version)
Numbers come only from tier 1 and tier 2 sources. Read how we research.
Disclaimer
For learning only. Cityfort is not a SEBI-registered adviser and does not recommend buying or selling any security. Prices shown are dated and may be out of date.
Investing in securities involves risk, including loss of capital. Before making any investment decision, do your own research and consider consulting a SEBI-registered investment adviser.
Cityfort, its owners and contributors may or may not hold securities of companies covered. Content is not an offer or solicitation to buy or sell any security.
Read the full disclaimerHide the full disclaimer
Cityfort publishes educational content that explains how listed companies work. Cityfort is not registered with the Securities and Exchange Board of India (SEBI) as an Investment Adviser or Research Analyst and does not provide investment advice, recommendations, ratings, price targets or any opinion on whether to buy, sell or hold any security.
All information is taken from publicly available sources, mainly company filings on BSE and NSE, which are listed on each page with dates. We work to keep it accurate and correct errors publicly, but we do not guarantee that it is complete, accurate or up to date. Any market price or price-based ratio shown is dated, may be out of date by the time you read it, and is included only to explain concepts.
Statements by company management are reported as statements, with their date and source; they are not our forecasts.