Financial Services · NSE: CHOLAFIN · BSE: 511243
Cholamandalam Investment and Finance: how the business works
Cholamandalam Investment and Finance (Chola) lends against vehicles and property across India, mostly outside big cities, and earned ₹5,233 crore of profit in FY26.
Follow Cholamandalam Investment and Finance
Email me when Cholamandalam Investment and Finance's page is updated after results.
We store your email address with Kit, our email provider, which also records when you sign up and whether you open or click our emails. We send a confirmation email first. See our privacy policy.
Cholamandalam Investment and Finance Company Limited · Chennai, Tamil Nadu · Founded 1978
Updated for Q2 FY27 · checked
- Total income, FY26
- ₹31,539 cr
- Profit for shareholders, FY26
- ₹5,233 cr
- Business AUM, 30 Sep 2026
- ₹248,045 cr
- Customers, 30 Sep 2026
- 5,684,731
- Promoter group holding, Sep 2026
- 48.93%
The short version
Cholamandalam Investment and Finance in 5 points
1 · What it sells
Cholamandalam Investment and Finance (Chola) lends money mostly against vehicles and property, and also gives home, small-business and gold loans, and its business AUM was ₹248,045 crore at 30 Sep 2026.
2 · Who pays it
Borrowers pay Chola interest, and at 30 Sep 2026 vehicle loans were 52.3% of its business AUM, loans against property 23.2%, home loans 10.2%, unsecured consumer and small enterprise loans 6.9%, SME loans 4.4%, secured business and personal loans 1.6% and gold loans 1.4%.
3 · What it keeps from ₹100
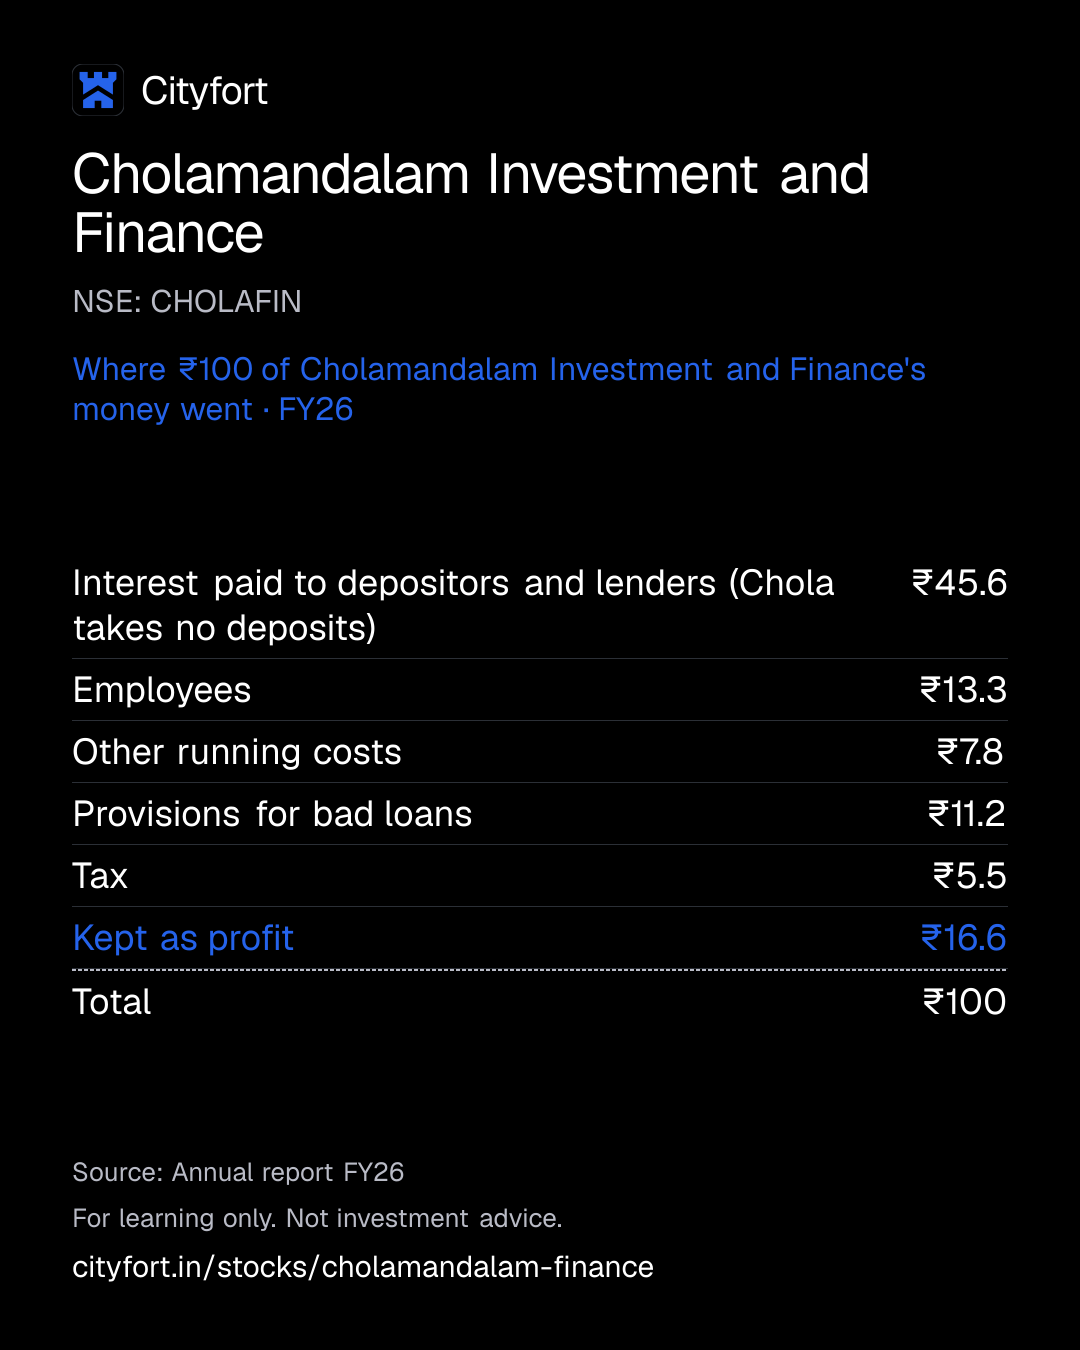
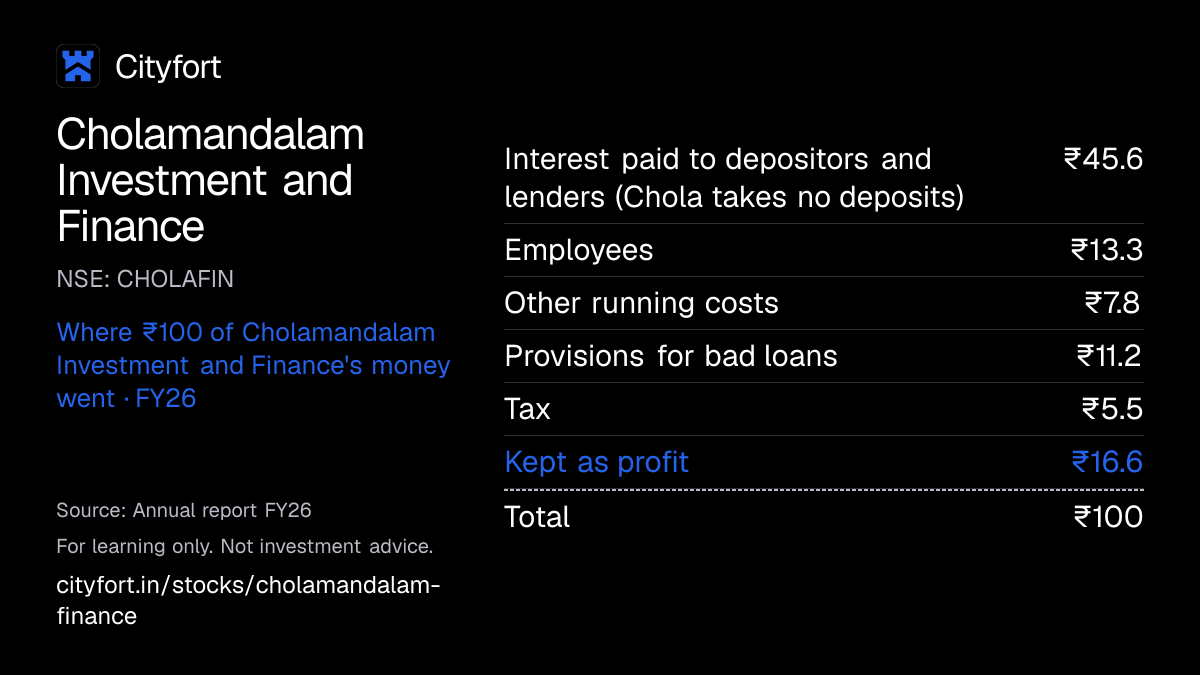
Of every ₹100 that came in to the Chola group during FY26, it kept ₹16.6 as profit after ₹45.6 of interest to its own lenders and ₹11.2 set aside for bad loans, including a ₹200 crore management overlay, and FY26 had no exceptional items.
4 · Where the operating profit comes from
Chola's profit comes mainly from the gap between the interest it earns and the interest it pays, which was ₹13,998 crore of net interest income for Chola alone in FY26, against ₹3,072 crore of fees and other income.
5 · The one thing to watch
Chola's gross stage 3 loans (loans in default) were 3.25% of its loans at 30 Sep 2026, up from 2.48% at 31 Mar 2024, and 4.07% in vehicle loans.
Sources: From Chola's FY26 and FY24 annual reports and its Q2 FY27 investor presentation · checked
01Where the money goes · FY26
Where does ₹100 of Cholamandalam Investment and Finance's money go?
Cholamandalam Investment and Finance · FY26
Receipt for every ₹100
| Interest paid to depositors and lenders (Chola takes no deposits) | ₹45.6 |
|---|---|
| Employees | ₹13.3 |
| Other running costs | ₹7.8 |
| Provisions for bad loans | ₹11.2 |
| Tax | ₹5.5 |
| Kept as profit | ₹16.6 |
| Total | ₹100 |
Each line = amount ÷ total money in × 100. Lines may not add to exactly ₹100 because of rounding.
How this is worked out
Of every ₹100 that came in to the Chola group in FY26. Cityfort calculation from the FY26 consolidated statement of profit and loss (S1): each line ÷ total income of ₹31,539 crore × 100. Fees and other operating income (₹2,670 crore) = revenue from operations minus interest income; other running costs = depreciation ₹284 crore + other expenses ₹2,166 crore. Profit includes a ₹3.73 crore share of joint-venture profit.
Save this receipt as an image
Embed this receipt or the key numbers
Paste this code into a blog or website to show the card you choose, with a link back to this page.
Each week: the next company due to report results, explained in 5 points.
We'll email you once a week with what changed on Cityfort. Facts only, no tips. Unsubscribe any time.
We store your email address with Kit, our email provider, which also records when you sign up and whether you open or click our emails. We send a confirmation email first. See our privacy policy.
02The business in one line
What does Cholamandalam Investment and Finance do?
Borrowers, most of them buying vehicles or borrowing against property, pay Chola interest; most of that money goes on interest to its own lenders, staff and provisions for bad loans, and what's left is profit.
- In FY26 borrowers paid the Chola group ₹28,403 crore of interest. Fees and other operating income added ₹2,670 crore, and other income ₹466 crore.
- Interest paid to banks, bondholders and other lenders took ₹14,384 crore. ₹5,233 crore was left as profit.
03Who pays it
Who pays Cholamandalam Investment and Finance?
Cholamandalam Investment and Finance does not disclose how much each type of customer pays.
Vehicle buyers and owners
Pay interest on loans for commercial vehicles, cars, two-wheelers, tractors and equipment: 52.3% of business AUM at 30 Sep 2026. ICRA puts used vehicles at 26% of the vehicle book (Jun 2026).
Property owners borrowing against property
Pay interest on loans secured on property: 23.2% of business AUM.
Home buyers
Pay interest on home loans: 10.2% of business AUM.
Individuals and small firms with unsecured loans
Pay interest on consumer and small enterprise loans: 6.9% of business AUM.
Small and medium businesses
Pay interest on SME loans (4.4% of business AUM) and secured business and personal loans (1.6%).
Gold loan borrowers
Pay interest on loans against gold: 1.4% of business AUM.
How spread out the customers are
Chola does not disclose income by customer; it had 5,684,731 customers at 30 Sep 2026. The shares above are of business AUM, not of income. Its reported segments give income: vehicle finance was 52.5% of standalone FY26 total income.
Sources (3)
04How it makes money
How does Cholamandalam Investment and Finance make money?
A lender earns the gap between the interest it charges and the interest it pays, less bad loans
Chola borrows from banks and bond investors and lends at higher rates to vehicle buyers, property owners and small businesses. That gap, net interest income, was ₹13,998 crore in FY26 for Chola alone. Running costs took ₹6,574 crore and provisions for bad loans ₹3,536 crore.
Profit per ₹100 of assets (return on assets, as reported)
2.9%2.5%
FY22 to FY26
- Borrow from banks, bond investors and securitisation buyers
- Lend through 1,958 branches, most of them in smaller towns
- Interest earned minus interest paid gives net interest income
- Fees, insurance commission and gains on loans sold add income
- Staff, branches and bad-loan provisions come out of that income
- Profit adds to capital, which supports more borrowing and lending
↺ Step 6 feeds back into step 1.
05Business segments · FY26
Which businesses make up Cholamandalam Investment and Finance?
Vehicle finance
52.5%Loans for new and used commercial vehicles, cars, tractors and construction equipment. ₹3,145 crore profit before tax in FY26 (Chola alone).
Revenue ₹16,511 cr · Operating profit ₹3,145 cr
Loan against property
19%Loans secured on property. ₹2,159 crore profit before tax on ₹5,989 crore of income in FY26.
Revenue ₹5,989 cr · Operating profit ₹2,159 cr
Home loans
10.3%Loans to buy or build homes. ₹857 crore profit before tax in FY26.
Revenue ₹3,241 cr · Operating profit ₹857 cr
Others
15.1%Consumer and small enterprise, SME, secured business and personal, and gold loans. ₹519 crore profit before tax in FY26.
Revenue ₹4,734 cr · Operating profit ₹519 cr
Unallocable
3.1%Income and costs the company does not assign to a business segment. ₹281 crore profit before tax in FY26.
Revenue ₹970 cr · Operating profit ₹281 cr
How the mix changed
- Vehicle finance
- Loan against property
- Home loans
- Others
- Unallocable
Revenue by segment, FY22 to FY26.
₹ crore
See the numbers
06The numbers · company only (standalone) · ₹ crore
How has Cholamandalam Investment and Finance done?
Net interest income
₹13,998 crFY26
Net interest income for Chola alone (interest earned minus interest paid) rose every year, from ₹5,268 crore in FY22 to ₹13,998 crore in FY26, and was ₹4,174 crore in Q2 FY27.
₹ crore · company only (standalone) · interest earned minus interest paid
See the yearly numbers
See the quarterly numbers
Net profit
₹5,220 crFY26
Profit for Chola alone (standalone), plotted here, rose every year from ₹2,147 crore in FY22 to ₹5,220 crore in FY26, close to the group's ₹5,233 crore.
₹ crore · company only (standalone)
See the yearly numbers
See the quarterly numbers
Net interest margin
6.27%FY26†
Net interest margin (Cityfort calculation: net interest income ÷ average total assets) was 6.27% in FY26, while the company's own "net income margin", which also counts fees and other income, was 8.0%.
† NIM on average assets.
% · as reported by the company
See the numbers
Bad loans (gross NPA)
3.05%FY26
Gross stage 3 loans (loans in default under Indian accounting rules, shown in place of gross NPA) fell from 4.37% in FY22 to 2.48% in FY24, then rose to 3.05% in FY26 and 3.25% at 30 Sep 2026.
% of loans · gross and net (after provisions) non-performing assets
See the yearly numbers
See the quarterly numbers
See all yearly numbers
EPS is the group's basic EPS per ₹2 share, as filed; quarterly EPS is shown only for the quarters whose results were read for it. The share count rose from 839,665,330 (Dec 2023) to 857,510,806 (Sep 2026) as the 2023 convertible debentures turned into shares, so per-share figures are not fully like-for-like.
Net interest income = interest earned on loans and investments minus interest paid on deposits and borrowings. Provisions = money set aside for loans that may not be repaid. Financial year runs April to March.
- Lender figures are for Cholamandalam Investment and Finance alone (standalone), as the company reports all its ratios; the business segments are standalone too. The group adds two subsidiaries, a joint venture and an associate: FY26 group profit of ₹5,232.61 crore was 0.25% above the standalone ₹5,219.59 crore (Cityfort calculation from the FY26 annual report).
- Net interest margin is a Cityfort calculation from the annual reports: net interest income ÷ the average of opening and closing standalone total assets. FY22 uses 31 Mar 2021 total assets of ₹74,548.42 crore from the FY22 annual report: ₹5,267.99 crore ÷ ₹78,455.89 crore = 6.71%. Quarters are not shown. The company reports a "net income margin" instead: (total income − finance costs) ÷ its average assets (business AUM plus investments). It was 7.9% in FY22, 7.7% in FY23, 7.5% in FY24, 7.7% in FY25, 8.0% in FY26 and 7.9% in Q2 FY27.
- Interest earned and interest paid are the statutory interest income and finance costs. Other income is total income minus interest income: fees and commission, gains on loans sold (assignment), fair value gains, services and other income. Operating expenses are staff, depreciation and other expenses; operating profit minus provisions equals profit before tax in every year. Cost-to-income (operating expenses ÷ (net interest income + other income)) matches the company's "cost to net income" ratio.
- The gross and net NPA columns show stage 3 loans under Indian accounting rules (Ind AS), as the company labels them; provision cover is its stage 3 coverage. The company also reports gross and net NPA under RBI's Nov 2021 rules, under which an account stays an NPA until all arrears are paid: 4.36% and 2.87% at 31 Mar 2026, and 4.44% and 2.92% at 30 Sep 2026. Those rules took FY22 gross NPA to 6.8%, against 4.37% on the stage 3 basis.
- Q3 FY26 net stage 3 is not shown: the Q3 FY26 results filing could not be read, and the company's Q3 FY26 presentation gives 1.91% on a different base (gross assets).
- CET1 (core equity capital) was first reported for FY23. It was 14.88% at 30 Sep 2026. Tier I capital was 14.73% at 31 Mar 2026 and 16.02% at 30 Sep 2026. The company states RBI's minimums as 15% for CRAR, 10% for Tier I and 9% for CET1.
- Chola does not hold or accept public deposits, so deposits and CASA do not apply. Loans are net loans on the balance sheet. Business AUM, which also counts loans sold to others (assigned), was ₹224,334 crore at 31 Mar 2026 and ₹248,045 crore at 30 Sep 2026; total AUM, which adds investments, was ₹242,630 crore and ₹268,009 crore.
- FY26 and Q4 FY26 provisions include a ₹200 crore management overlay, a buffer for possible losses; it is not an exceptional item. Q3 FY26 loan losses include a ₹64 crore impact from selling home loans to an asset reconstruction company.
- Q3 FY26 group total income (₹8,008.68 crore) and profit (₹1,289.97 crore) are from the Q3 FY26 column of the Q4 FY26 consolidated results.
Sources (14)
- Annual Report FY23 (2022-23)
- Annual Report FY22 (2021-22)
- Annual Report FY26 (2025-26), incl. standalone and consolidated financial statements and BRSR
- Corporate presentation, September 2026 (Q2 FY27)
- Annual Report FY24 (2023-24)
- Annual Report FY25 (2024-25)
- Unaudited standalone and consolidated results, quarter and nine months ended 31 Dec 2024 (Q3 FY25)
- Audited standalone and consolidated results, quarter and year ended 31 Mar 2025 (Q4 FY25)
- Unaudited standalone and consolidated results, quarter ended 30 Jun 2026 (Q1 FY27)
- Unaudited standalone and consolidated results, quarter ended 30 Jun 2025 (Q1 FY26)
- Audited standalone and consolidated results, quarter and half year ended 30 Sep 2025 (Q2 FY26)
- Audited standalone and consolidated results, quarter and half year ended 30 Sep 2026 (Q2 FY27)
- Audited standalone and consolidated results, quarter and year ended 31 Mar 2026 (Q4 FY26)
- Corporate presentation, December 2025 (Q3 FY26)
07Who runs it
Who runs Cholamandalam Investment and Finance, and did they deliver?
Vellayan Subbiah
Executive Chairman
Term from 1 Apr 2025 to 31 Mar 2030, according to a statement from his office that the company filed on 26 Feb 2026.
Ravindra Kumar Kundu
Managing Director and CEO
Gives most of the growth and credit-cost guidance on the earnings calls.
D. Arul Selvan
Chief Financial Officer
P. Sujatha
Company Secretary
What they said, and what happened
4 too early to tell
Said on 4 May 2026
Ravindra Kundu said Chola would keep FY27 growth within its committed range of 20% to 23%.
Too early to tellWhat happened
AUM was 25% higher than a year earlier at 30 Sep 2026, the company said. On 28 Oct 2026 he said the guidance was not being revised.
Said on 4 May 2026
Ravindra Kundu said he expected FY27 net credit cost to fall from 1.6% before the overlay to around 1.5%.
Too early to tellWhat happened
Loan losses and provisions were 1.4% of assets in the first half of FY27, as the company reports it.
Said on 4 May 2026
CFO Arul Selvan said he expected the company's margin measure (it calls it NIM) to hold at about 8% in FY27.
Too early to tellWhat happened
The company's net income margin was 8.0% in the first half of FY27.
Said on 4 May 2026
Ravindra Kundu said return on assets should improve, moving closer to a pre-tax ROA of 3.5%.
Too early to tellWhat happened
Profit before tax was 3.5% of total assets in the first half of FY27, as the company reports it, against 3.3% in FY26.
Sources (5)
- Annual Report FY26 (2025-26), incl. standalone and consolidated financial statements and BRSR
- Clarification on news item about the Executive Chairman (Reg 30(11)), 26 Feb 2026
- Q4 FY26 earnings conference call transcript (4 May 2026)
- Q2 FY27 earnings conference call transcript (28 Oct 2026)
- Corporate presentation, September 2026 (Q2 FY27)
08What could go wrong
What could go wrong for Cholamandalam Investment and Finance?
- Concentration
Most loans are against vehicles
Vehicle loans were 52.3% of business AUM at 30 Sep 2026. Their gross stage 3 share was 4.07%, against 3.25% for all loans. ICRA puts used vehicles at 26% of the vehicle book.
Watch Vehicle-loan stage 3 share each quarter (4.07% at 30 Sep 2026).
- Execution
Bad loans have risen since FY24
Gross stage 3 loans rose from 2.48% at 31 Mar 2024 to 3.25% at 30 Sep 2026; under RBI's NPA rules the figure was 4.44%. ICRA lists 90+ days overdue loans above 5% among triggers for a downgrade.
Watch Gross stage 3 and RBI-basis gross NPA each quarter.
- Execution
Newer and unsecured loans
Unsecured consumer and small enterprise loans were ₹17,216 crore at 30 Sep 2026. Lending through fintech partners stopped from Q1 FY26, Vellayan Subbiah said. SME and secured business loans had stage 3 shares of 3.82% and 4.20%.
Watch Stage 3 shares in SME, secured business and personal, and unsecured loans.
- Debt
Runs on borrowed money
Standalone borrowings were ₹210,867 crore at 31 Mar 2026, against net worth of ₹30,404 crore. ICRA put managed gearing at 7.2 times in FY26. Bank term loans were 42.5% of borrowings.
Watch Credit ratings (ICRA AA+ Positive, CARE AA+ Stable) and ICRA's gearing figure.
- Regulation
RBI rules for large NBFCs
RBI places Chola in the upper layer of NBFCs. The company states its minimum capital ratios as 15% (CRAR), 10% (Tier I) and 9% (CET1). CRAR was 20.62% at 30 Sep 2026.
Watch New RBI directions for upper-layer NBFCs and CRAR each quarter.
- Other
More shares from capital raises
The 2023 CCDs converted into shares by 30 Sep 2026, and the promoter group's holding fell from 50.37% (Dec 2023) to 48.93% (Sep 2026). On 28 Oct 2026 the board approved a QIP of up to ₹5,000 crore, subject to approvals.
Watch The postal ballot result and the size and price of any QIP.
Sources (12)
- Corporate presentation, September 2026 (Q2 FY27)
- ICRA rationale: Cholamandalam Investment and Finance Company Ltd, ratings reaffirmed, rated amount enhanced ([ICRA]AA+ (Positive)/[ICRA]A1+)
- Annual Report FY24 (2023-24)
- Audited standalone and consolidated results, quarter and half year ended 30 Sep 2026 (Q2 FY27)
- Unaudited standalone and consolidated results, quarter and nine months ended 31 Dec 2024 (Q3 FY25)
- Q3 FY26 earnings conference call transcript (2 Feb 2026)
- Annual Report FY26 (2025-26), incl. standalone and consolidated financial statements and BRSR
- CARE Ratings press release: Cholamandalam Investment and Finance Company Ltd (CARE AA+; Stable / CARE A1+)
- Allotment of 30,54,849 equity shares on conversion of 43,000 CCDs (final tranche, 30 Sep 2026)
- Shareholding pattern as of 31 Dec 2023 (XBRL, revised filing)
- Shareholding pattern as of 30 Sep 2026 (XBRL)
- Outcome of board meeting 28 Oct 2026: Q2 FY27 results, press release, approval of QIP up to Rs 5,000 crore
09Supporters and critics
What do supporters and critics point to?
What supporters point to
- Business AUM rose from ₹76,907 crore at 31 Mar 2022 to ₹248,045 crore at 30 Sep 2026.
- Group profit rose every year, from ₹2,154 crore in FY22 to ₹5,233 crore in FY26.
- ICRA rates its long-term debt AA+ with a Positive outlook (2 Sep 2026).
- CRAR was 20.62% at 30 Sep 2026, against the 15% RBI minimum the company cites.
- Cost-to-income fell from 40.9% in FY24 to 38.5% in FY26.
What critics point to
- Gross stage 3 loans rose from 2.48% in FY24 to 3.25% at 30 Sep 2026; on RBI's basis the figure was 4.44%.
- Return on assets fell from 2.9% in FY22 to 2.5% in FY26, as the company reports it.
- ICRA put its managed gearing at 7.2 times in FY26.
- Vehicle loans, 52.3% of business AUM, had a stage 3 share of 4.07% at 30 Sep 2026.
- The board approved a QIP of up to ₹5,000 crore on 28 Oct 2026, days after the 2023 debentures finished converting into shares.
10What to watch next
What should you watch next at Cholamandalam Investment and Finance?
Next event
Q3 FY27 results (date not announced)
Date not announced yet.
Bad loans
Gross stage 3 loans were 3.25% at 30 Sep 2026, up from 2.48% at 31 Mar 2024. Vehicle loans were at 4.07%.
Credit cost
Loan losses and provisions were 1.4% of assets in the first half of FY27. On 4 May 2026 Ravindra Kundu said he expected around 1.5% for FY27; on 28 Oct he said the start-of-year objective was about 1.4%.
Capital raise
The board approved a QIP of up to ₹5,000 crore on 28 Oct 2026, subject to a postal ballot and regulatory approvals.
11Key facts
Key facts about Cholamandalam Investment and Finance
- What does Cholamandalam Investment and Finance do?
- Cholamandalam Investment and Finance (Chola) is a Chennai-based non-bank lender (NBFC) in the Murugappa Group. It lends mainly against vehicles and property, and also gives home, small-business, unsecured and gold loans. Its business AUM (loans it manages) was ₹248,045 crore at 30 Sep 2026.
- How does Cholamandalam Investment and Finance make money?
- Cholamandalam Investment and Finance earns mostly interest on loans. In FY26 group interest income was ₹28,403 crore of its ₹31,539 crore total income, and it paid ₹14,384 crore of interest to its own lenders.
- Who are Cholamandalam Investment and Finance's customers?
- Cholamandalam Investment and Finance had 5,684,731 customers at 30 Sep 2026. Vehicle loans were 52.3% of its business AUM, loans against property 23.2% and home loans 10.2%. The company says 85% of its locations are in Tier-III to Tier-VI towns.
- How big is Cholamandalam Investment and Finance?
- Cholamandalam Investment and Finance's group total income was ₹31,539 crore in FY26 and its profit for shareholders was ₹5,233 crore, up from ₹4,263 crore in FY25.
- Who owns Cholamandalam Investment and Finance?
- At 30 Sep 2026 the promoter group owned 48.93% of Cholamandalam Investment and Finance, including 43.48% held by Cholamandalam Financial Holdings. Foreign investors held 24.87%, Indian institutions 20.38% and individuals and others 5.83%. No promoter shares were pledged.
- Where does Cholamandalam Investment and Finance get the money it lends?
- Cholamandalam Investment and Finance does not take public deposits. Its standalone borrowings were ₹210,867 crore at 31 Mar 2026: bank term loans 42.5%, securitisation 15.0%, secured bonds (NCDs) 13.9%, foreign-currency loans from banks 7.1%, loans from financial institutions 7.1%, subordinated debt 6.5% and commercial paper 5.1%.
- How many of Cholamandalam Investment and Finance's loans are in default?
- Cholamandalam Investment and Finance's gross stage 3 loans (the accounting class for loans in default) were 3.25% of its loans at 30 Sep 2026, and 1.80% after provisions. Under RBI's NPA rules, its gross NPA was 4.44%.
- How many branches does Cholamandalam Investment and Finance have?
- Cholamandalam Investment and Finance had 1,958 branches at 30 Sep 2026, including 308 gold-loan branches, up from 1,761 at 31 Mar 2026.
Sources (4)
Terms on this page
- Credit rating
- FII and DII holding
- Gross and net NPA
- Market capitalisation
- Net interest margin (NIM)
- Net profit
- Promoter holding
- Provision coverage ratio (PCR)
- Public shareholding
- Return on equity (ROE)
Each explains the term in plain English, with the same number from other companies on Cityfort.
Go deeper
More detail from the same filings. Open any section.
12What it sells
12What it sells
What does Cholamandalam Investment and Finance sell?
Vehicle loans
Loans for commercial vehicles, cars, utility vehicles, two-wheelers, tractors and construction equipment, new and used: ₹129,787 crore, 52.3% of business AUM, at 30 Sep 2026.
Loans against property
Loans secured on property, which the company groups with its small-business (MSME) lending: ₹57,447 crore, 23.2% of business AUM, at 30 Sep 2026.
Home loans
Loans to buy or build homes: ₹25,240 crore, 10.2% of business AUM, at 30 Sep 2026.
Consumer and small enterprise loans (unsecured)
Loans without collateral to individuals and small firms: ₹17,216 crore, 6.9% of business AUM, at 30 Sep 2026.
SME and secured business and personal loans
SME loans were ₹10,943 crore (4.4% of business AUM) and secured business and personal loans ₹3,966 crore (1.6%) at 30 Sep 2026.
Gold loans
Loans against gold jewellery, started in FY26: ₹3,446 crore, 1.4% of business AUM, at 30 Sep 2026.
What it does
- Does: Lends from 1,958 branches (30 Sep 2026); the company says 85% of its locations are in Tier-III to Tier-VI towns
- Does: Sells some of its loans to banks (assignment) and keeps managing them; business AUM counts these loans too
- Does: Sells insurance as a corporate agent under an IRDAI composite corporate agency licence
What it does not do
- Does not: It is not a bank and does not hold or accept public deposits
- Does not: It stopped lending through fintech partners from Q1 FY26, Executive Chairman Vellayan Subbiah said on 2 Feb 2026
- Does not: It holds 74.63% of Payswiff Technologies but accounts for it as a joint venture, not a subsidiary
Sources (5)
- Corporate presentation, September 2026 (Q2 FY27)
- Annual Report FY24 (2023-24)
- ICRA rationale: Cholamandalam Investment and Finance Company Ltd, ratings reaffirmed, rated amount enhanced ([ICRA]AA+ (Positive)/[ICRA]A1+)
- Annual Report FY26 (2025-26), incl. standalone and consolidated financial statements and BRSR
- Corporate presentation, March 2026 (Q4 FY26)
13How the money flows
13How the money flows · FY26
How does money flow through Cholamandalam Investment and Finance?
Money in
- Interest income (mostly on loans)₹28,403 cr
- Fees, gains on loans sold and other operating income₹2,670 cr
- Other income₹466 cr
The company
Cholamandalam Investment and Finance
₹31,539 cr came in
Money out
- Interest paid to banks, bondholders and other lenders₹14,384 cr
- Employees₹4,195 cr
- Other running costs (incl. depreciation)₹2,450 cr
- Provisions for bad loans (incl. a ₹200 crore overlay)₹3,536 cr
- Tax₹1,744 cr
- Profit for Chola's shareholders₹5,233 cr
- These are the Chola group's FY26 accounts, including its two subsidiaries and its share of a joint venture's profit.
- Borrowers paid ₹28,403 crore of interest. Fees, gains on loans sold and other operating income added ₹2,670 crore, and other income ₹466 crore.
- Chola paid ₹14,384 crore of interest to the banks, bondholders and other lenders that fund it.
- Staff cost ₹4,195 crore and other running costs ₹2,450 crore. ₹3,536 crore was set aside for loans that may not be repaid.
- After ₹1,744 crore of tax, ₹5,233 crore was profit for shareholders.
14What it needs to run
14What it needs to run
What does Cholamandalam Investment and Finance need to run?
Borrowed money
Standalone borrowings were ₹210,867 crore at 31 Mar 2026, against net worth of ₹30,404 crore. Bank term loans were 42.5% of borrowings, securitisation (pools of loans sold to trusts, still counted as borrowing) 15.0% and secured bonds 13.9%.
Credit ratings
ICRA rates its long-term debt AA+ with a Positive outlook (2 Sep 2026); CARE rates it AA+ (Stable) (27 Aug 2026). Both rate its short-term debt A1+.
Capital
Capital adequacy (CRAR: own money as a share of risk-weighted loans) was 20.62% at 30 Sep 2026, with Tier I capital at 16.02%. The company states RBI's minimums as 15% and 10%.
Branches
1,958 branches at 30 Sep 2026, including 308 gold-loan branches. ICRA says about 81% of branches are in rural areas.
People
51,320 permanent employees at 31 Mar 2026, according to its FY26 sustainability report (BRSR).
RBI registration
Registered with RBI as an investment and credit company (NBFC-ICC) with a factoring licence, and placed in the upper layer (NBFC-UL), large NBFCs under stricter rules than smaller NBFCs.
Sources (4)
- Annual Report FY26 (2025-26), incl. standalone and consolidated financial statements and BRSR
- ICRA rationale: Cholamandalam Investment and Finance Company Ltd, ratings reaffirmed, rated amount enhanced ([ICRA]AA+ (Positive)/[ICRA]A1+)
- CARE Ratings press release: Cholamandalam Investment and Finance Company Ltd (CARE AA+; Stable / CARE A1+)
- Corporate presentation, September 2026 (Q2 FY27)
15Where growth could come from
15Where growth could come from
Where could Cholamandalam Investment and Finance's growth come from?
On the Q4 FY26 call (4 May 2026), MD Ravindra Kundu said Chola would maintain its "committed growth trajectory of 20% to 23%" for FY27. He expected net credit cost to fall from 1.6% before the overlay to around 1.5%. On the Q2 FY27 call (28 Oct 2026) he said the guidance was not being revised. He added that the objective at the start of the year was about 25% growth with net credit cost of about 1.4%. Asked on the same call about growth over the next couple of years, CFO Arul Selvan said "we still hold to that 20% to 23% on a steady-state basis".
Vehicle loans
Working₹129,787 cr, +21% in a year (Sep 2026)
The largest book, 52.3% of business AUM. Vehicle loans were 50% of Q2 FY27 disbursements.
Status: Working, on track against what the company said.
Loans against property
Working₹57,447 cr, +24% in a year (Sep 2026)
The second-largest book, 23.2% of business AUM at 30 Sep 2026.
Status: Working, on track against what the company said.
Home loans
Working₹25,240 cr, +24% in a year (Sep 2026)
10.2% of business AUM at 30 Sep 2026; gross stage 3 was 1.37%.
Status: Working, on track against what the company said.
SME loans
Working₹10,943 cr, +45% in a year (Sep 2026)
4.4% of business AUM at 30 Sep 2026, with gross stage 3 of 3.82%.
Status: Working, on track against what the company said.
Unsecured consumer and small enterprise loans
Mixed₹17,216 cr, +23% in a year (Sep 2026)
Vellayan Subbiah said on 2 Feb 2026 that lending through fintech partners stopped from Q1 FY26. ICRA's 2 Sep 2026 rating report expects unsecured loans to be capped at 8–10% of AUM.
Status: Mixed, partly on track.
Gold loans
New₹3,446 cr, from ₹456 cr a year earlier (Sep 2026)
Started in FY26; 308 gold-loan branches at 30 Sep 2026.
Status: New, recently announced.
Status compares progress with what the company itself said it would do: Working = on track against what the company said; Mixed = partly on track; Behind = behind the company's own plan; New = recently announced; Early = too early to judge.
Sources (7)
- Q4 FY26 earnings conference call transcript (4 May 2026)
- Q2 FY27 earnings conference call transcript (28 Oct 2026)
- Corporate presentation, September 2026 (Q2 FY27)
- Outcome of board meeting 28 Oct 2026: Q2 FY27 results, press release, approval of QIP up to Rs 5,000 crore
- Q3 FY26 earnings conference call transcript (2 Feb 2026)
- ICRA rationale: Cholamandalam Investment and Finance Company Ltd, ratings reaffirmed, rated amount enhanced ([ICRA]AA+ (Positive)/[ICRA]A1+)
- Corporate presentation, March 2026 (Q4 FY26)
16Financial strength: capital, bad loans, deposits
16Financial strength · FY26
How strong is Cholamandalam Investment and Finance's balance sheet?
- Loans given (advances)₹2.18 lakh cr
- Capital adequacy (CRAR)
- 19.21%
- capital as a share of risk-weighted loans; regulators set a minimum
- Core equity (CET1)
- 14.4%
- the highest-quality part of that capital
- Gross NPA
- 3.05%
- loans not being repaid, as % of all loans
- Net NPA
- 1.63%
- the same, after money already set aside
- Provision cover
- 47.29%
- share of bad loans already provided for
- Cost to income
- 38.5%
- ₹ of running costs per ₹100 of income after interest paid
- Return on assets
- 2.5%
- profit as % of everything the lender owns
- Return on equity
- 19.7%
- profit as % of shareholders' money
Figures as on FY26 year end (standalone, as banks report these ratios). Reported by the company; see the dates on each source.
17Who owns it
17Who owns it · Q2 FY27
Who owns Cholamandalam Investment and Finance?
- Promoters (founders or parent company)48.9%
- Foreign institutions (FII)24.9%
- Indian institutions (DII)20.4%
- Public and others5.8%
Promoter pledge
No promoter shares were pledged in Q2 FY27.
How ownership changed
* Pledged = share of the promoters' own holding reported as pledged. In older filings this can include shares “otherwise encumbered”; the governance flags say when.
Sources (13)
- Shareholding pattern as of 30 Sep 2026 (XBRL)
- Shareholding pattern as of 30 Jun 2026 (XBRL)
- Shareholding pattern as of 31 Mar 2026 (XBRL)
- Shareholding pattern as of 31 Dec 2025 (XBRL, revised filing)
- Shareholding pattern as of 30 Sep 2025 (XBRL)
- Shareholding pattern as of 30 Jun 2025 (XBRL)
- Shareholding pattern as of 31 Mar 2025 (XBRL)
- Shareholding pattern as of 31 Dec 2024 (XBRL)
- Shareholding pattern as of 30 Sep 2024 (XBRL)
- Shareholding pattern as of 30 Jun 2024 (XBRL)
- Shareholding pattern as of 31 Mar 2024 (XBRL, revised filing)
- Shareholding pattern as of 31 Dec 2023 (XBRL, revised filing)
- Corporate presentation, September 2026 (Q2 FY27)
18What it does with profit
18What it does with profit
What does Cholamandalam Investment and Finance do with its profit?
Dividend per share
₹2.00FY26
Dividend paid for each share, by financial year.
₹ per share
See the numbers
Money raised · 10 Oct 2023
Qualified institutional placement (QIP) of ₹4,000 crore: 16,949,152 new shares at ₹1,180 each (₹2,000 crore) and 200,000 compulsorily convertible debentures (CCDs) of ₹100,000 each (₹2,000 crore) at 7.5% interest. The last 43,000 CCDs converted into 3,054,849 shares on 30 Sep 2026.
₹4,000 cr
19Governance signals
19Governance signals
What do Cholamandalam Investment and Finance's governance filings show?
- Auditor
- KKC & Associates LLP and B.K. Khare & Co (joint statutory auditors, appointed at the 26 Jul 2024 AGM for three years), since 2024
- Auditor changes
- None in the period covered
- Audit qualifications
- None reported
- Related-party dealings
- Cholamandalam Financial Holdings, the Murugappa Group holding company, owned 43.48% at 30 Sep 2026; the whole promoter group owned 48.93%. Chola fully owns Cholamandalam Securities and Cholamandalam Leasing (formerly Cholamandalam Home Finance), and holds 74.63% of Payswiff Technologies, which it accounts for as a joint venture.
- Credit rating
- ICRA AA+ (outlook Positive), 2 Sep 2026
A credit rating describes the company's ability to repay debt. It is not a rating of the share.
Flags to know about
other · 26 Feb 2026
Company filed a denial of a report on its Executive Chairman
On 26 Feb 2026 the company filed a statement from Vellayan Subbiah's office about a Moneycontrol report that he would exit Chola as part of a Murugappa family settlement. The statement called the speculation "factually incorrect and entirely baseless" and said he continues as Executive Chairman.
disclosure
Three shareholding patterns refiled in revised form
The shareholding patterns for 31 Dec 2023, 31 Mar 2024 and 31 Dec 2025 were refiled as revised versions on 16 May 2024, 21 Jun 2024 and 25 Aug 2026. This page uses the revised versions.
Sources (8)
- Annual Report FY26 (2025-26), incl. standalone and consolidated financial statements and BRSR
- Corporate presentation, September 2026 (Q2 FY27)
- Shareholding pattern as of 30 Sep 2026 (XBRL)
- ICRA rationale: Cholamandalam Investment and Finance Company Ltd, ratings reaffirmed, rated amount enhanced ([ICRA]AA+ (Positive)/[ICRA]A1+)
- Clarification on news item about the Executive Chairman (Reg 30(11)), 26 Feb 2026
- Shareholding pattern as of 31 Dec 2023 (XBRL, revised filing)
- Shareholding pattern as of 31 Mar 2024 (XBRL, revised filing)
- Shareholding pattern as of 31 Dec 2025 (XBRL, revised filing)
20What the market paid
20What the market paid · price as of 11 Nov 2026
What did the market pay for Cholamandalam Investment and Finance on 11 Nov 2026?
Price as of 11 Nov 2026 (shown for education; prices change daily).
Price as of 11 Nov 2026: ₹1,814.80, the NSE closing price. Market value: ₹155,621 crore, a Cityfort calculation from the 11 Nov 2026 NSE closing price and 857,510,806 shares in the Sep 2026 shareholding pattern. P/E divides the price by one year's profit per share: FY26 group EPS of ₹61.98 gives 29.3 (Cityfort calculation from the FY26 annual report). P/B divides market value by book value (shareholders' money): Chola's standalone net worth of ₹34,474 crore at 30 Sep 2026, from the Q2 FY27 presentation, gives 4.51 (Cityfort calculation). EV/EBITDA is not shown, because interest is a lender's main cost.
- Share price
- ₹1,814.80
- Market value (market cap)
- ₹155,621 cr
- P/E
- 29.3×
- P/B
- 4.5×
Source: NSE full bhavcopy with delivery, 11 Nov 2026 (CHOLAFIN EQ close); Shareholding pattern as of 30 Sep 2026 (XBRL); Annual Report FY26 (2025-26), incl. standalone and consolidated financial statements and BRSR and 1 more
21How it got here
21How it got here
How did Cholamandalam Investment and Finance get here?
1978
Milestone
Incorporated in Chennai
Incorporated in 1978 in Chennai; part of the Murugappa Group.
2021
Milestone
RBI's stricter NPA rules
RBI's Nov 2021 rules on classifying bad loans lifted FY22 gross NPA (RBI basis) to 6.8%; gross stage 3 under accounting rules was 4.37%.
2022
Business-model change
New consumer and small-business loans
Consumer and small enterprise loans grew from ₹573 crore at 31 Mar 2022 to ₹5,527 crore a year later; SME and secured business loans also grew.
2023
Milestone
₹4,000 crore QIP
On 10 Oct 2023 it raised ₹2,000 crore in new shares and ₹2,000 crore in debentures that later converted into shares.
2025
Business-model change
Stopped lending through fintech partners
Lending through fintech relationships stopped from Q1 FY26, Executive Chairman Vellayan Subbiah said on 2 Feb 2026.
2025
Business-model change
Started gold loans
Gold loans began in FY26; they reached ₹3,446 crore and 308 branches by 30 Sep 2026.
2026
Milestone
Debentures fully converted; new QIP approved
The last 43,000 CCDs from 2023 converted into shares on 30 Sep 2026. On 28 Oct 2026 the board approved a QIP of up to ₹5,000 crore, subject to approvals.
Sources (7)
- Annual Report FY26 (2025-26), incl. standalone and consolidated financial statements and BRSR
- Corporate presentation, September 2026 (Q2 FY27)
- Corporate presentation, March 2026 (Q4 FY26)
- Annual Report FY24 (2023-24)
- Q3 FY26 earnings conference call transcript (2 Feb 2026)
- Allotment of 30,54,849 equity shares on conversion of 43,000 CCDs (final tranche, 30 Sep 2026)
- Outcome of board meeting 28 Oct 2026: Q2 FY27 results, press release, approval of QIP up to Rs 5,000 crore
22Sources and changes
Where every number on this page comes from
Sources (36 documents)
- S1Annual Report FY26 (2025-26), incl. standalone and consolidated financial statements and BRSR · Company (filed with NSE/BSE) · Tier 1: company or exchange filing · 6 Jul 2026
- S2Annual Report FY25 (2024-25) · Company (filed with NSE/BSE) · Tier 1: company or exchange filing · 9 Jul 2025
- S3Annual Report FY24 (2023-24) · Company (filed with NSE/BSE) · Tier 1: company or exchange filing · 4 Jul 2024
- S4Annual Report FY23 (2022-23) · Company (filed with NSE/BSE) · Tier 1: company or exchange filing · 10 Jul 2023
- S5Annual Report FY22 (2021-22) · Company (filed with NSE/BSE) · Tier 1: company or exchange filing · 7 Jul 2022
- S6Audited standalone and consolidated results, quarter and half year ended 30 Sep 2026 (Q2 FY27) · Company (filed with NSE/BSE) · Tier 1: company or exchange filing · 28 Oct 2026
- S7Unaudited standalone and consolidated results, quarter ended 30 Jun 2026 (Q1 FY27) · Company (filed with NSE/BSE) · Tier 1: company or exchange filing · 28 Jul 2026
- S8Audited standalone and consolidated results, quarter and year ended 31 Mar 2026 (Q4 FY26) · Company (filed with NSE/BSE) · Tier 1: company or exchange filing · 30 Apr 2026
- S9Audited standalone and consolidated results, quarter and half year ended 30 Sep 2025 (Q2 FY26) · Company (filed with NSE/BSE) · Tier 1: company or exchange filing · 6 Nov 2025
- S10Unaudited standalone and consolidated results, quarter ended 30 Jun 2025 (Q1 FY26) · Company (filed with NSE/BSE) · Tier 1: company or exchange filing · 31 Jul 2025
- S11Audited standalone and consolidated results, quarter and year ended 31 Mar 2025 (Q4 FY25) · Company (filed with NSE/BSE) · Tier 1: company or exchange filing · 25 Apr 2025
- S12Unaudited standalone and consolidated results, quarter and nine months ended 31 Dec 2024 (Q3 FY25) · Company (filed with NSE/BSE) · Tier 1: company or exchange filing · 31 Jan 2025
- S13Corporate presentation, September 2026 (Q2 FY27) · Company (filed with NSE/BSE) · Tier 1: company or exchange filing · 28 Oct 2026
- S15Corporate presentation, March 2026 (Q4 FY26) · Company (filed with NSE/BSE) · Tier 1: company or exchange filing · 30 Apr 2026
- S16Corporate presentation, December 2025 (Q3 FY26) · Company (filed with NSE/BSE) · Tier 1: company or exchange filing · 30 Jan 2026
- S17Q2 FY27 earnings conference call transcript (28 Oct 2026) · Company · Tier 1: company or exchange filing · 28 Oct 2026
- S19Q4 FY26 earnings conference call transcript (4 May 2026) · Company · Tier 1: company or exchange filing · 4 May 2026
- S20Q3 FY26 earnings conference call transcript (2 Feb 2026) · Company · Tier 1: company or exchange filing · 2 Feb 2026
- S21Outcome of board meeting 28 Oct 2026: Q2 FY27 results, press release, approval of QIP up to Rs 5,000 crore · NSE (company filing) · Tier 1: company or exchange filing · 28 Oct 2026
- S22ICRA rationale: Cholamandalam Investment and Finance Company Ltd, ratings reaffirmed, rated amount enhanced ([ICRA]AA+ (Positive)/[ICRA]A1+) · ICRA · Tier 2: rating agency or regulator · 2 Sep 2026
- S23CARE Ratings press release: Cholamandalam Investment and Finance Company Ltd (CARE AA+; Stable / CARE A1+) · CARE Ratings · Tier 2: rating agency or regulator · 27 Aug 2026
- S24Shareholding pattern as of 31 Dec 2023 (XBRL, revised filing) · NSE (company filing) · Tier 1: company or exchange filing · 16 May 2024
- S25Shareholding pattern as of 31 Mar 2024 (XBRL, revised filing) · NSE (company filing) · Tier 1: company or exchange filing · 21 Jun 2024
- S26Shareholding pattern as of 30 Jun 2024 (XBRL) · NSE (company filing) · Tier 1: company or exchange filing · 19 Jul 2024
- S27Shareholding pattern as of 30 Sep 2024 (XBRL) · NSE (company filing) · Tier 1: company or exchange filing · 21 Oct 2024
- S28Shareholding pattern as of 31 Dec 2024 (XBRL) · NSE (company filing) · Tier 1: company or exchange filing · 21 Jan 2025
- S29Shareholding pattern as of 31 Mar 2025 (XBRL) · NSE (company filing) · Tier 1: company or exchange filing · 21 Apr 2025
- S30Shareholding pattern as of 30 Jun 2025 (XBRL) · NSE (company filing) · Tier 1: company or exchange filing · 21 Jul 2025
- S31Shareholding pattern as of 30 Sep 2025 (XBRL) · NSE (company filing) · Tier 1: company or exchange filing · 21 Oct 2025
- S32Shareholding pattern as of 31 Dec 2025 (XBRL, revised filing) · NSE (company filing) · Tier 1: company or exchange filing · 25 Aug 2026
- S33Shareholding pattern as of 31 Mar 2026 (XBRL) · NSE (company filing) · Tier 1: company or exchange filing · 20 Apr 2026
- S34Shareholding pattern as of 30 Jun 2026 (XBRL) · NSE (company filing) · Tier 1: company or exchange filing · 20 Jul 2026
- S35Shareholding pattern as of 30 Sep 2026 (XBRL) · NSE (company filing) · Tier 1: company or exchange filing · 21 Oct 2026
- S36NSE full bhavcopy with delivery, 11 Nov 2026 (CHOLAFIN EQ close) · NSE · Tier 1: company or exchange filing · 11 Nov 2026
- S37Allotment of 30,54,849 equity shares on conversion of 43,000 CCDs (final tranche, 30 Sep 2026) · NSE (company filing) · Tier 1: company or exchange filing · 30 Sep 2026
- S38Clarification on news item about the Executive Chairman (Reg 30(11)), 26 Feb 2026 · NSE (company filing) · Tier 1: company or exchange filing · 26 Feb 2026
Changes to this page (v1 · 12 Nov 2026)
- v1 · 12 Nov 2026First version. (first version)
Numbers come only from tier 1 and tier 2 sources. Read how we research.
Disclaimer
For learning only. Cityfort is not a SEBI-registered adviser and does not recommend buying or selling any security. Prices shown are dated and may be out of date.
Investing in securities involves risk, including loss of capital. Before making any investment decision, do your own research and consider consulting a SEBI-registered investment adviser.
Cityfort, its owners and contributors may or may not hold securities of companies covered. Content is not an offer or solicitation to buy or sell any security.
Read the full disclaimerHide the full disclaimer
Cityfort publishes educational content that explains how listed companies work. Cityfort is not registered with the Securities and Exchange Board of India (SEBI) as an Investment Adviser or Research Analyst and does not provide investment advice, recommendations, ratings, price targets or any opinion on whether to buy, sell or hold any security.
All information is taken from publicly available sources, mainly company filings on BSE and NSE, which are listed on each page with dates. We work to keep it accurate and correct errors publicly, but we do not guarantee that it is complete, accurate or up to date. Any market price or price-based ratio shown is dated, may be out of date by the time you read it, and is included only to explain concepts.
Statements by company management are reported as statements, with their date and source; they are not our forecasts.