Financial Services · NSE: GROWW · BSE: 544603
Groww: how the business works
Groww runs an app on which people in India trade shares and derivatives and invest in mutual funds, and earned ₹4,645 crore of revenue in FY26.
Follow Groww
Email me when Groww's page is updated after results.
We store your email address with Kit, our email provider, which also records when you sign up and whether you open or click our emails. We send a confirmation email first. See our privacy policy.
Billionbrains Garage Ventures Limited · Bengaluru, Karnataka · Founded 2018
Updated for Q2 FY27 · checked
- Revenue, FY26
- ₹4,645 cr
- Profit, FY26
- ₹2,083 cr
- Active users, Q2 FY27
- 1.82 crore
- Employees, 31 Mar 2026
- 1,802
- Promoter holding, 30 Sep 2026
- 27.13%
The short version
Groww in 5 points
1 · What it sells
Groww runs an investing app on which people in India trade shares and derivatives and buy mutual funds, and it also lends to them, with revenue of ₹4,645 crore in FY26.
2 · Who pays it
In FY26, 81.2% of Groww's revenue was fees and commissions, 8.1% interest on deposits placed with exchanges, 5.5% interest on margin trading loans and 5.2% interest on Groww Creditserv's loans.
3 · What it keeps from ₹100
Of every ₹100 that came in during FY26, Groww kept ₹43.3 as profit with no one-off items that year; ₹3.6 of the ₹100 was other income outside its operations, and EBITDA was 59.1% of revenue.
4 · Where the operating profit comes from
Groww reports one business segment; ICRA's 30 Jul 2026 report says about 73% of FY26 broking revenue came from derivatives, and the company said its credit business made 4.1% of consolidated profit in Q4 FY26.
5 · The one thing to watch
Groww's margin trading book rose from ₹1,668 crore to ₹4,351 crore in the year to 30 Sep 2026, while average daily equity derivatives premium turnover fell from ₹16,493 crore in Q4 FY26 to ₹12,322 crore in Q2 FY27.
Sources: From Groww's FY26 annual report, RHP, Q2 FY27 results, shareholders' letters and KPI handbook, and ICRA's rating report · checked
Sources (4)
01Where the money goes · FY26
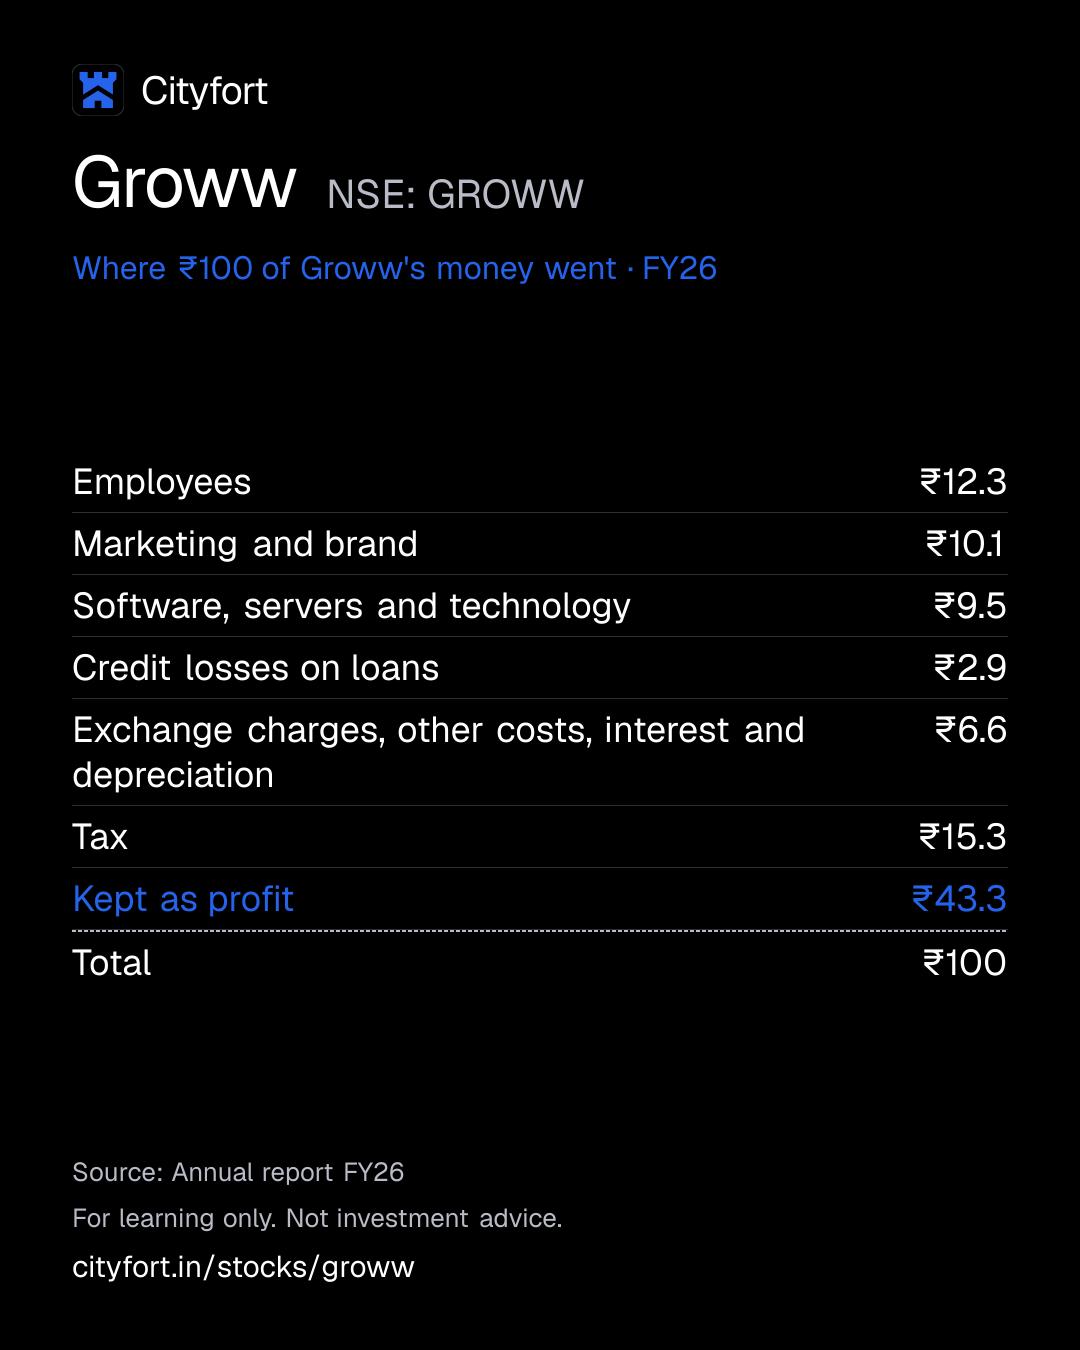
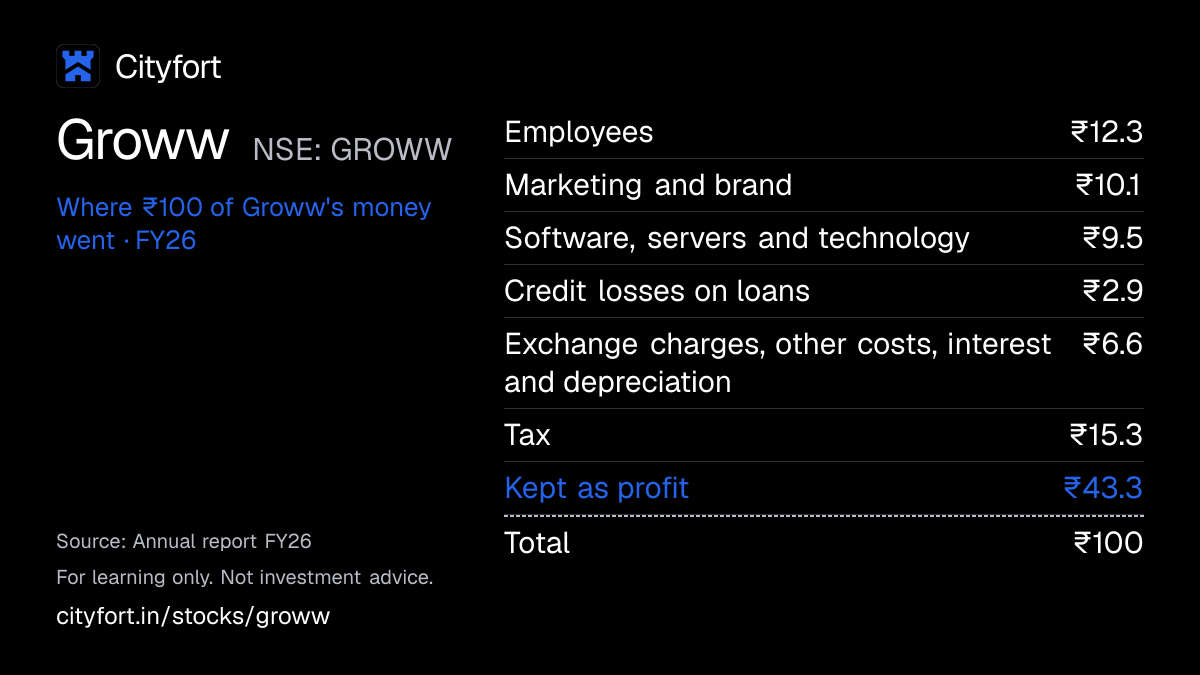
Where does ₹100 of Groww's money go?
Groww · FY26
Receipt for every ₹100
| Employees | ₹12.3 |
|---|---|
| Marketing and brand | ₹10.1 |
| Software, servers and technology | ₹9.5 |
| Credit losses on loans | ₹2.9 |
| Exchange charges, other costs, interest and depreciation | ₹6.6 |
| Tax | ₹15.3 |
| Kept as profit | ₹43.3 |
| Total | ₹100 |
Each line = amount ÷ total money in × 100. Lines may not add to exactly ₹100 because of rounding.
How this is worked out
Each line = line ÷ total money in × 100 (Cityfort calculation from the FY26 annual report). Money in is ₹4,815.88 crore: revenue ₹4,644.58 crore plus other income ₹171.30 crore, which is ₹3.6 of every ₹100. FY26 had no exceptional items.
Save this receipt as an image
Embed this receipt or the key numbers
Paste this code into a blog or website to show the card you choose, with a link back to this page.
Each week: the next company due to report results, explained in 5 points.
We'll email you once a week with what changed on Cityfort. Facts only, no tips. Unsubscribe any time.
We store your email address with Kit, our email provider, which also records when you sign up and whether you open or click our emails. We send a confirmation email first. See our privacy policy.
02The business in one line
What does Groww do?
Investors pay Groww brokerage and fees to trade on its app; the biggest costs are tax, staff, marketing and technology, and in FY26 ₹43.3 of every ₹100 that came in was profit.
- Fees and commissions were 81.2% of FY26 revenue. Interest on deposits placed with exchanges, margin trading loans and personal loans made up the rest.
- Profit was ₹2,083 crore in FY26. FY24 was a ₹805 crore loss, after a one-time ₹1,340 crore US tax on merging its US parent into the Indian company.
03Who pays it
Who pays Groww?
Investors and traders on the app (fees and commissions)
81.2%
of revenue
Brokerage and other charges on stock and derivative trades, and other fees: ₹3,773.25 crore in FY26. Broking alone was 84.50% of revenue in FY25, the RHP says.
Banks and securities: interest on money placed with exchanges
8.1%
of revenue
Interest on deposits and securities earmarked with stock exchanges and clearing corporations: ₹374.20 crore in FY26.
Margin trading clients
5.5%
of revenue
Interest on money lent to clients to buy shares, booked in the broking arm: ₹257.66 crore in FY26.
Borrowers of Groww Creditserv
5.2%
of revenue
Interest on personal loans and loans against shares and mutual funds: ₹239.47 crore in FY26.
- Investors and traders on the app (fees and commissions)81.2%
- Banks and securities: interest on money placed with exchanges8.1%
- Margin trading clients5.5%
- Borrowers of Groww Creditserv5.2%
How spread out the customers are
Shares are of FY26 revenue from operations (₹4,644.58 crore) by type, as the annual report's revenue note splits it; Cityfort calculation. The company had 1.82 crore active users in Q2 FY27.
Sources (3)
04How it makes money
How does Groww make money?
Between Q2 FY26 and Q2 FY27 Groww's revenue grew faster than its costs, so more of each ₹100 of revenue was left as operating profit.
Between Q2 FY26 and Q2 FY27 revenue rose 47.4% and total expenses 28.5% (Cityfort calculation from the Q2 FY27 results). Staff, servers and marketing are spread over more users and trades. Lending adds interest income, but also credit losses.
EBITDA margin, quarter (Cityfort calculation)
59.2%64.5%
Q2 FY26 to Q2 FY27
- Users open accounts and invest or trade on the app: 1.82 crore active users in Q2 FY27.
- Each trade earns brokerage and other charges; broking was 84.50% of FY25 revenue.
- Money placed with exchanges, and loans to clients, earn interest.
- Staff, servers and marketing costs are spread across more users and orders.
- EBITDA margin rose from 59.2% in Q2 FY26 to 64.5% in Q2 FY27.
- IPO money went into cloud, marketing, margin trading, Groww Creditserv’s capital and acquisitions.
↺ Step 6 feeds back into step 1.
05The numbers · Consolidated · ₹ crore
How has Groww done?
Revenue
₹4,645 crFY26
Revenue rose every year, from ₹1,142 crore in FY23 to ₹4,645 crore in FY26, and was ₹1,502 crore in Q2 FY27 against ₹1,019 crore a year earlier.
₹ crore
See the numbers
Net profit
₹2,083 crFY26
FY24 was a ₹805 crore loss after a one-time ₹1,340 crore US tax on merging Groww Inc. into the Indian company, and Q3 FY25 profit was raised by a ₹424.68 crore reversal of a cancelled staff incentive.
₹ crore
See the numbers
Net profit for every ₹100 of revenue
₹44.9FY26
EBITDA margin (Cityfort calculation on reported profit before tax) was 59.1% in FY26; FY24 was −29.9% after the merger tax, or 21.4% before it (Cityfort calculation), and Q3 FY25 tops 100% because of the incentive reversal.
Net margin: ₹ of net profit per ₹100 of revenue
See the numbers
Free cash flow
−₹32.7 crFY26
Operating cash flow was negative from FY25 (−₹962 crore, with ₹1,905 crore of taxes paid including the merger tax) and was −₹828 crore in H1 FY27 as loans to clients rose ₹1,915 crore.
₹ crore · cash from operations minus spending on plants and equipment
See the numbers
See all yearly numbers
EBITDA = profit before interest, tax and wear-and-tear of assets. Financial year runs April to March (March year end). Net profit is the share belonging to the company's owners.
Sources (12)
- Red Herring Prospectus dated 29 Oct 2025 (restated consolidated financial information FY23-FY25 and Q1 FY26)
- Annual Report FY26 (2025-26), standalone and consolidated financial statements
- Q4 FY26 and FY26 audited results, with board outcome (secretarial auditor, director resignation)
- Q2 FY26 results, machine-readable re-filing of the 21 Nov 2025 results
- Q3 FY26 results (quarter and nine months to 31 Dec 2025)
- Q1 FY27 results (quarter to 30 Jun 2026)
- Q2 FY27 results (quarter and six months to 30 Sep 2026), consolidated and standalone
- Q2 FY26 consolidated results, integrated filing (XBRL)
- Q3 FY26 consolidated results, integrated filing (XBRL)
- Q4 FY26 consolidated results, integrated filing (XBRL)
- Q1 FY27 consolidated results, integrated filing (XBRL)
- Q2 FY27 consolidated results, integrated filing (XBRL)
06Who runs it
Who runs Groww, and did they deliver?
Lalit Keshre
Co-founder, Whole-time Director and CEO
Held 8.58% of the shares at 30 Sep 2026.
Ishan Bansal
Co-founder, Whole-time Director and CFO
Held 4.10% of the shares at 30 Sep 2026.
Harsh Jain
Co-founder and Whole-time Director
Held 6.23% of the shares at 30 Sep 2026.
Neeraj Singh
Co-founder and Whole-time Director
Held 5.78% of the shares at 30 Sep 2026.
Gaurang Shah
Chairman and Independent Director
What they said, and what happened
1 delivered · 2 too early to tell
Said on 29 Oct 2025
The RHP set out uses for ₹1,015.98 crore of net IPO proceeds: cloud infrastructure, brand and marketing, capital for Groww Creditserv, margin trading funding, and acquisitions and general corporate purposes.
DeliveredWhat happened
By 30 Sep 2026, ₹1,014.99 crore had been used. Each named object was fully used; ₹0.99 crore for acquisitions and general purposes was unused.
Said on 20 Apr 2026
The company said in its Q4 FY26 shareholder letter that Fisdom "is in early stages of integration and scale. We expect it to be profitable in FY28."
Too early to tellWhat happened
Fisdom lost ₹10.2 crore in Q4 FY26. The Q2 FY27 letter said its integration was completed during that quarter; FY28 runs to Mar 2028.
Said on 20 Apr 2026
In the same letter the company said Groww Asset Management needs to grow its assets 5 to 6 times to be profitable, which it expected over the next few years. Assets were ₹4,170 crore then.
Too early to tellWhat happened
Assets managed reached ₹7,179 crore at 30 Sep 2026; the fund house lost ₹8.29 crore in Q2 FY27.
Sources (7)
- Annual Report FY26 (2025-26), standalone and consolidated financial statements
- Shareholding pattern, 30 Sep 2026 (XBRL)
- Red Herring Prospectus dated 29 Oct 2025 (restated consolidated financial information FY23-FY25 and Q1 FY26)
- Q2 FY27 results (quarter and six months to 30 Sep 2026), consolidated and standalone
- Shareholder letter Q4 FY26
- Shareholders' letter Q2 FY27
- KPI Handbook Q2 FY27 (Excel: operational, financial and Groww AMC KPIs, summary P&L)
07What could go wrong
What could go wrong for Groww?
- Concentration
Most broking revenue comes from derivatives
ICRA says derivatives were about 73% of broking revenue in FY26, and futures and options more than 80% of broking income in FY23–FY25. Average daily equity derivatives premium turnover was ₹12,322 crore in Q2 FY27, against ₹16,493 crore in Q4 FY26.
Watch Equity derivatives premium turnover and equity derivatives active users (0.158 crore in Q2 FY27) in each KPI handbook.
- Regulation
SEBI rule and tax changes on trading
ICRA and CARE note changes to weekly expiries, lot sizes and securities transaction tax. The company linked a 14.3% fall in equity derivatives revenue from Q1 to Q2 FY27 mostly to SEBI's Closing Auction System, in force from 3 Aug 2026.
Watch New SEBI rules on derivatives, and the effect the company reports in its next shareholders' letter.
- Execution
Credit losses on a growing loan book
Loans to clients rose from ₹1,690.70 crore at 31 Mar 2025 to ₹6,134.29 crore at 30 Sep 2026. Credit losses rose from ₹71.60 crore in FY25 to ₹140.06 crore in FY26. Expected losses were 4.9% of gross unsecured loans at 31 Mar 2026 (Cityfort calculation from the FY26 annual report).
Watch The impairment line in each results filing, and Groww Creditserv's unsecured loans (₹1,377 crore at 30 Sep 2026).
- Cash and liquidity
Operating cash flow below profit
Operating cash flow was −₹962.16 crore in FY25, −₹20.60 crore in FY26 and −₹827.73 crore in H1 FY27, while profit was positive. Taxes paid, including the merger tax, and loans to clients (up ₹1,915.32 crore in H1 FY27) were the main reasons.
Watch Operating cash flow and the change in loans in the half-year and annual cash flow statements.
- Governance
Pledged promoter-group shares
21,341,308 shares, 1.25% of the promoter group's holding, were pledged at 30 Sep 2026, up from 0.17% in Nov 2025. They belong to four non-founder members of the promoter group.
Watch The pledge in each quarter's shareholding pattern, and the exchanges' decision on reclassifying 41 promoter-group members.
- Technology
Technology outages
The company said its platform was interrupted "for a few minutes" in the Cloudflare outage of 6 Dec 2025. In Q2 FY27 it made a one-time client reimbursement of ₹10–13 crore after delayed expiry-day files at a third-party market infrastructure institution.
Watch Outage disclosures and one-time costs in the shareholders' letters.
- Execution
Loss-making newer businesses
Groww Asset Management lost ₹8.29 crore in Q2 FY27, and Fisdom lost ₹10.2 crore in Q4 FY26. The company has said when it expects each to become profitable (see promises).
Watch Assets managed by Groww Mutual Fund (₹7,179 crore at 30 Sep 2026) and the losses in each KPI handbook.
Sources (14)
- ICRA rationale: Billionbrains Garage Ventures, issuer rating upgraded to [ICRA]AA (Stable)
- ICRA rationale: issuer rating [ICRA]AA- (Stable) reaffirmed (attached to the company's exchange filing)
- KPI Handbook Q2 FY27 (Excel: operational, financial and Groww AMC KPIs, summary P&L)
- CARE Ratings press release: issuer rating CARE AA; Stable assigned
- Shareholders' letter Q2 FY27
- Annual Report FY26 (2025-26), standalone and consolidated financial statements
- Q2 FY27 results (quarter and six months to 30 Sep 2026), consolidated and standalone
- Red Herring Prospectus dated 29 Oct 2025 (restated consolidated financial information FY23-FY25 and Q1 FY26)
- Shareholding pattern, 30 Sep 2026 (XBRL)
- Shareholding pattern before listing, 11 Nov 2025 (XBRL)
- Application to stock exchanges for promoter-group reclassification (Reg 31A)
- Clarification on news of the Cloudflare outage affecting the platform
- Q2 FY27 earnings call transcript (call 14 Oct 2026)
- Shareholder letter Q4 FY26
08Supporters and critics
What do supporters and critics point to?
What supporters point to
- Revenue rose from ₹1,141.53 crore in FY23 to ₹4,644.58 crore in FY26, and profit was ₹2,083.00 crore in FY26.
- Q2 FY27 profit was ₹725.65 crore, up 54.0% from ₹471.34 crore a year earlier (Cityfort calculation).
- ICRA says Groww's broking arm has ranked first by NSE active clients since Q2 FY24, with about 29% share in Jun 2026.
- Borrowings were ₹21.00 crore against equity of ₹11,568.01 crore at 30 Sep 2026, and ICRA upgraded the rating to [ICRA]AA in Jul 2026.
- The margin trading book rose from ₹1,668 crore to ₹4,351 crore in the year to 30 Sep 2026.
What critics point to
- ICRA says derivatives were about 73% of broking revenue in FY26, and equity derivatives revenue fell 14.3% from Q1 to Q2 FY27.
- Operating cash flow was negative in FY25, FY26 and H1 FY27 (−₹827.73 crore), as loans to clients grew.
- Credit losses rose from ₹71.60 crore in FY25 to ₹140.06 crore in FY26.
- Groww Asset Management and Fisdom were loss-making in their latest reported quarters.
- 1.25% of the promoter group's shares were pledged at 30 Sep 2026, up from 0.17% in Nov 2025.
09What to watch next
What should you watch next at Groww?
Next event
Q3 FY27 results (date not announced as of 11 Nov 2026; Q3 FY26 results came on 14 Jan 2026)
Date not announced yet.
Derivatives after SEBI's changes
Equity derivatives revenue fell 14.3% from Q1 to Q2 FY27; the company linked it mostly to the Closing Auction System.
Loans and credit losses
Margin trading book ₹4,351 crore, Groww Creditserv secured loans ₹412 crore and unsecured ₹1,377 crore at 30 Sep 2026; FY26 credit losses were ₹140.06 crore.
Promoter-group reclassification
The application to reclassify 41 promoter-group members as public, filed on 14 Oct 2026, had no exchange decision filed by 11 Nov 2026.
10Key facts
Key facts about Groww
- What does Groww do?
- Groww is the brand of Billionbrains Garage Ventures, a Bengaluru company whose app lets people in India trade shares, futures and options and commodities, invest in mutual funds and take loans. Groww had 1.82 crore active users in Q2 FY27, by the company's own definition.
- How does Groww make money?
- In FY26, 81.2% of Groww's ₹4,644.58 crore revenue was fees and commissions, mostly brokerage on trades. Interest on deposits placed with exchanges was 8.1%, interest on margin trading loans 5.5% and interest on Groww Creditserv's loans 5.2%.
- Who are Groww's customers?
- Groww's customers are individual investors and traders in India. Groww had 2.41 crore total transacting users and 1.82 crore active users in Q2 FY27. The RHP says that at 30 Jun 2025 its customers were in 98.36% of Indian pin codes, and about 81% of active users lived outside Delhi NCR and the top five cities.
- How big is Groww?
- Groww's revenue was ₹4,644.58 crore in FY26, up from ₹3,901.72 crore in FY25. Profit was ₹2,083.00 crore in FY26, against ₹1,824.37 crore in FY25. In Q2 FY27 Groww's revenue was ₹1,501.53 crore and its profit ₹725.65 crore.
- Who owns Groww?
- On 30 Sep 2026 Groww's promoter group, which includes its four co-founders, held 27.13% of Billionbrains Garage Ventures. Pre-IPO foreign investors such as Peak XV, YC Holdings and Ribbit held 41.46%, Indian institutions 12.73%, foreign portfolio investors 10.90% and other shareholders 7.77%. 1.25% of the promoter group's shares were pledged, none of them the founders'.
- Why did Groww report a loss in FY24?
- Groww lost ₹804.94 crore in FY24 because of a one-time ₹1,339.68 crore US tax on merging its US parent, Groww Inc., into the Indian company; NCLT Bengaluru approved the merger on 28 Mar 2024. Groww's FY24 costs also included a ₹778.60 crore one-time management incentive.
- Is Groww an NBFC?
- Groww's lending subsidiary, Groww Creditserv Technology, is a non-deposit-taking NBFC in the RBI's Middle Layer. Its loan interest was ₹239.47 crore, 5.2% of Groww's FY26 revenue. Groww's margin trading loans sit in its broking arm, Groww Invest Tech, and earned ₹257.66 crore of interest in FY26.
- When did Groww list on the stock exchanges?
- Billionbrains Garage Ventures (Groww) listed on NSE and BSE on 12 Nov 2025 after an IPO at ₹100 a share. The Groww IPO had ₹1,060 crore of new shares and 557,230,051 shares sold by existing shareholders.
- Does Groww have debt or pay a dividend?
- Groww's borrowings were ₹21.00 crore at 30 Sep 2026, against shareholders' equity of ₹11,568.01 crore. Groww has not paid a dividend, and its board did not recommend one for FY26.
Sources (7)
- Annual Report FY26 (2025-26), standalone and consolidated financial statements
- KPI Handbook Q2 FY27 (Excel: operational, financial and Groww AMC KPIs, summary P&L)
- Red Herring Prospectus dated 29 Oct 2025 (restated consolidated financial information FY23-FY25 and Q1 FY26)
- Q2 FY27 results (quarter and six months to 30 Sep 2026), consolidated and standalone
- Shareholding pattern, 30 Sep 2026 (XBRL)
- NSE public issue page data for GROWW: issue details and bid details (updated 07-Nov-2025 19:00)
- ICRA rationale: Billionbrains Garage Ventures, issuer rating upgraded to [ICRA]AA (Stable)
Terms on this page
- Capital expenditure (capex)
- Credit rating
- EBITDA
- FII and DII holding
- Free cash flow
- Market capitalisation
- Net debt
- Net profit
- Operating margin
- Promoter holding
Each explains the term in plain English, with the same number from other companies on Cityfort.
Go deeper
More detail from the same filings. Open any section.
11What it sells
11What it sells
What does Groww sell?
Stock broking (Groww Invest Tech)
Buying and selling shares and applying for IPOs. Brokerage is 70–75% of stocks revenue; the rest is charges such as depository and pledge fees. Average daily stock turnover was ₹14,430 crore in Q2 FY27.
Derivatives trading
Futures and options on shares and indices, and on commodities. ICRA says derivatives were about 73% of broking revenue in FY26. Average daily equity derivatives premium turnover was ₹12,322 crore in Q2 FY27.
Mutual funds on the app
Users invest in mutual funds through the app. Mutual fund assets held through Groww were ₹205,905 crore at 30 Sep 2026; SIP inflows were ₹34,028 crore in FY25.
Margin trading funding (in the broking arm)
Groww pays part of the price of shares a client buys and charges interest. The book was ₹4,351 crore at 30 Sep 2026; interest earned was ₹257.66 crore in FY26.
Loans (Groww Creditserv, an NBFC)
Personal loans and loans against shares and mutual funds. At 30 Sep 2026 unsecured loans were ₹1,377 crore and secured loans ₹412 crore, net of expected losses.
Groww Mutual Fund (Groww Asset Management)
Its own fund house, bought from Sammaan Capital (formerly Indiabulls Housing Finance) in May 2023 (control from 3 May 2023, RHP restated accounts). It managed ₹7,179 crore at 30 Sep 2026.
Wealth services (Fisdom)
A wealth platform bought for ₹961.05 crore, paid by 3 Oct 2025. Wealth assets were ₹10,790 crore at 30 Sep 2026.
Think of it like this
Like a shop counter for the stock market: the exchanges hold the goods, and Groww earns a charge each time a customer buys or sells through its app.
What it does
- Does: Earns brokerage and charges on stock and derivative trades: fees and commissions were ₹3,773.25 crore in FY26.
- Does: Lends to clients against shares (margin trading) and through its NBFC, Groww Creditserv.
- Does: Works only in India: the filings report one segment, "App based technology platform", and one geography.
What it does not do
- Does not: Is not a bank: Groww Creditserv is a non-deposit-taking NBFC, so it does not take deposits from the public.
- Does not: Does not run a stock exchange: it is a broker, and its clients’ trades are made on exchanges such as NSE and BSE.
- Does not: Does not pay a dividend: none has been paid, and the board did not recommend one for FY26.
Sources (6)
- Shareholders' letter Q2 FY27
- KPI Handbook Q2 FY27 (Excel: operational, financial and Groww AMC KPIs, summary P&L)
- ICRA rationale: Billionbrains Garage Ventures, issuer rating upgraded to [ICRA]AA (Stable)
- Red Herring Prospectus dated 29 Oct 2025 (restated consolidated financial information FY23-FY25 and Q1 FY26)
- Annual Report FY26 (2025-26), standalone and consolidated financial statements
- Q2 FY27 results (quarter and six months to 30 Sep 2026), consolidated and standalone
12How the money flows
12How the money flows · FY26
How does money flow through Groww?
Money in
- Fees and commissions (mostly brokerage)₹3,773 cr
- Interest on deposits and securities placed with exchanges₹374 cr
- Interest on margin trading loans₹258 cr
- Interest on Groww Creditserv's loans₹239 cr
- Other income₹171 cr
The company
Groww
₹4,816 cr came in
Money out
- Employees (incl. ₹79.06 crore share-based pay)₹591 cr
- Marketing and brand₹487 cr
- Software, servers and technology₹459 cr
- Credit losses on loans₹140 cr
- Exchange charges, other costs, interest, depreciation and associate loss₹317 cr
- Tax₹738 cr
- Net profit₹2,083 cr
- In FY26 Groww earned ₹3,773 crore of fees and commissions, mostly brokerage on trades made on its app.
- It earned ₹374 crore of interest on money placed with exchanges, ₹258 crore on margin trading loans and ₹239 crore on Groww Creditserv's loans.
- It spent ₹591 crore on staff, ₹487 crore on marketing and ₹459 crore on software and servers.
- Credit losses on loans took ₹140 crore, and exchange charges, other costs, interest and depreciation ₹317 crore.
- After ₹738 crore of tax, ₹2,083 crore was left as profit.
13What it needs to run
13What it needs to run
What does Groww need to run?
Licences
SEBI registration as a stock broker for Groww Invest Tech, RBI registration as an NBFC for Groww Creditserv, and SEBI approval for Groww Mutual Fund.
Technology
Software, servers and technology cost ₹459.37 crore in FY26, ₹9.5 of every ₹100 that came in.
Deposits with exchanges
₹6,371.58 crore of fixed deposits were lien-marked (held as security) for clearing corporations and exchanges at 31 Mar 2026.
Money to lend
Loans to clients (margin trading and Groww Creditserv) were ₹6,134.29 crore at 30 Sep 2026. Borrowings were ₹21.00 crore.
People
The group had 1,802 employees at 31 Mar 2026; 552 of them, 30.6%, were women.
14Competitors and what protects it
14Competitors and what protects it
Who does Groww compete with?
Angel One Ltd
NSE: ANGELONE
A listed broker the RHP compared Groww with in its Basis for Offer Price; the RHP prints Angel One's FY25 revenue as ₹5,238.38 crore.
Motilal Oswal Financial Services
A listed broking and wealth firm in the same RHP peer comparison.
Zerodha
Named in the RHP's risk factors, quoting the company-commissioned Redseer report, among domestic investment and wealth management players.
Upstox
Named in the same RHP list of domestic investment and wealth management players.
What protects the business
Each strength is scored 1 (weak) to 5 (strong) for the business, with the reason. It is not a rating of the share.
- Number of active clients4 of 5
ICRA's Jul 2026 report says Groww's broking arm has ranked first among brokers by NSE active clients since Q2 FY24, with about 29% share in Jun 2026.
- Reach beyond big cities3 of 5
The RHP says that at 30 Jun 2025 customers were in 98.36% of Indian pin codes, and about 81% of active users lived outside Delhi NCR and the top five cities.
- Capital and credit rating3 of 5
Equity was ₹11,568.01 crore against ₹21.00 crore of borrowings at 30 Sep 2026. ICRA upgraded the issuer rating to [ICRA]AA (Stable) on 30 Jul 2026; CARE assigned CARE AA; Stable in Apr 2026.
Weak spot
Dependence on derivatives trading
ICRA says derivatives were about 73% of broking revenue in FY26. Equity derivatives revenue fell 14.3% from Q1 to Q2 FY27, which the company linked mostly to SEBI's Closing Auction System from 3 Aug 2026.
Sources (5)
- Red Herring Prospectus dated 29 Oct 2025 (restated consolidated financial information FY23-FY25 and Q1 FY26)
- ICRA rationale: Billionbrains Garage Ventures, issuer rating upgraded to [ICRA]AA (Stable)
- Q2 FY27 results (quarter and six months to 30 Sep 2026), consolidated and standalone
- CARE Ratings press release: issuer rating CARE AA; Stable assigned
- Shareholders' letter Q2 FY27
15Where growth could come from
15Where growth could come from
Where could Groww's growth come from?
The company said in its Q1 FY27 shareholders' letter (15 Jul 2026): "we believe that the operating leverage from economies of scale will continue to play out as we grow."
Margin trading funding
WorkingBook ₹1,668 cr → ₹4,351 cr, Sep 2025–Sep 2026
Groww pays part of the price of shares clients buy and earns interest. The Q2 FY27 letter puts its share of the industry's margin trading book at 2.7%, up from 1.6% a year earlier.
Status: Working, on track against what the company said.
Commodity derivatives
NewActive users 0.003 cr → 0.051 cr, Q2 FY26–Q2 FY27
The company said its retail share of commodity derivatives notional turnover was 28.6% in Q1 FY27. In Q2 FY27 commodity derivatives' share of total income rose 6.0 percentage points from a year earlier.
Status: New, recently announced.
Lending through Groww Creditserv
EarlySecured loans ₹59 cr → ₹412 cr; unsecured ₹1,189 cr → ₹1,377 cr, Sep 2025–Sep 2026
Personal loans and loans against shares and mutual funds. The Q4 FY26 letter said the credit business made 4.1% of consolidated profit in that quarter.
Status: Early, too early to judge.
Groww Mutual Fund
EarlyAssets managed ₹2,928 cr → ₹7,179 cr, Sep 2025–Sep 2026
Still loss-making: a ₹8.29 crore loss in Q2 FY27. State Street Global Advisors (SSGA) took a 22.94% economic interest on 4 Aug 2026.
Status: Early, too early to judge.
Wealth services (Fisdom)
NewWealth assets ₹8,356 cr → ₹10,790 cr, Mar–Sep 2026
The company said Fisdom's integration was completed in Q2 FY27. Fisdom lost ₹10.2 crore in Q4 FY26.
Status: New, recently announced.
Status compares progress with what the company itself said it would do: Working = on track against what the company said; Mixed = partly on track; Behind = behind the company's own plan; New = recently announced; Early = too early to judge.
Sources (6)
16Financial strength and debt
16Financial strength · 30 Sep 2026
How much debt does Groww have?
- Total debt₹21 cr
- Cash and investments₹265 cr
- Net cash (cash minus debt)₹244 cr
- Net worth (shareholders' money)₹11,568 cr
- Debt to equity
- 0×
- ₹ of debt for every ₹1 of shareholders' money
- Cash here is cash and cash equivalents only (₹265.35 crore). Other bank balances of ₹6,683.10 crore are left out: at 31 Mar 2026, ₹6,371.58 crore of fixed deposits were lien-marked for clearing corporations and exchanges.
- Trade payables of ₹7,607.22 crore at 30 Sep 2026 are mostly money owed to clients.
- Investments were ₹3,395.53 crore and loans to clients ₹6,134.29 crore at 30 Sep 2026. Lease liabilities of ₹56.04 crore are not counted as borrowings.
- Net debt (borrowings − cash and cash equivalents) and debt to equity (0.002) are Cityfort calculations from the Q2 FY27 results.
- The company's own "cash balance" (fixed deposits, mutual funds, government securities and bonds) was ₹3,849 crore at 30 Sep 2026, its Q2 FY27 letter says.
- Goodwill was ₹1,238.74 crore, mostly from the Fisdom purchase; ICRA put tangible net worth at ₹8,413 crore at 31 Mar 2026.
Sources (5)
- Q2 FY27 results (quarter and six months to 30 Sep 2026), consolidated and standalone
- Annual Report FY26 (2025-26), standalone and consolidated financial statements
- Red Herring Prospectus dated 29 Oct 2025 (restated consolidated financial information FY23-FY25 and Q1 FY26)
- Shareholders' letter Q2 FY27
- ICRA rationale: Billionbrains Garage Ventures, issuer rating upgraded to [ICRA]AA (Stable)
17Who owns it
17Who owns it · Q2 FY27
Who owns Groww?
- Promoters (founders or parent company)27.1%, of which pledged 0.3%
- Foreign institutions (FII)10.9%
- Indian institutions (DII)12.7%
- Public and others49.2%
- Pledged: 1.3% of promoter shares (0.3% of all shares)0.3%
Promoter shares pledged
1.3% of promoter shares
A pledge means promoters gave shares as security for a loan. If the loan isn't repaid, the lender can sell them.
How ownership changed
* Pledged = share of the promoters' own holding reported as pledged. In older filings this can include shares “otherwise encumbered”; the governance flags say when.
† Others = Pre-IPO foreign investors (Peak XV, YC, Ribbit, Tiger and others).
18What it does with profit
18What it does with profit
What does Groww do with its profit?
Money raised · 12 Nov 2025
IPO fresh issue: 106,000,000 new shares at ₹100, ₹1,060 crore gross and ₹1,015.98 crore net. The shares listed on 12 Nov 2025.
₹1,060 cr
Money raised · 4 Aug 2026
SSGA's investment in Groww Asset Management completed: ₹381.35 crore paid to Groww for existing shares and ₹198.68 crore for new shares in Groww Asset Management.
₹580 cr
19Governance signals
19Governance signals
What do Groww's governance filings show?
- Auditor
- B S R & Co. LLP, since 2023
- Auditor changes
- None in the period covered
- Audit qualifications
- None reported
- Related-party dealings
- The FY26 annual report says there were no materially significant related-party transactions that could conflict with the company's interests. In Jul 2026 the board noted a delay in filing the half-yearly related-party disclosure (see the flags).
- Credit rating
- ICRA (issuer rating; CARE also assigned CARE AA; Stable on 14 Apr 2026) [ICRA]AA, upgraded from [ICRA]AA- (outlook Stable), 30 Jul 2026
A credit rating describes the company's ability to repay debt. It is not a rating of the share.
Flags to know about
pledge · 30 Sep 2026
Some promoter-group shares are pledged
21,341,308 shares, 1.25% of the promoter group's holding, were pledged at 30 Sep 2026. They belong to Vikas Singh and three trusts (Fortune First, Thousand Oaks and Mufasa); none of the four founders' shares were pledged.
delayed filing · 16 Jul 2026
Late related-party disclosure
The exchanges noted a delay in filing the half-yearly related-party transaction disclosure under Regulation 23(9). On 16 Jul 2026 the company said its board took note of the delay and advised strengthening the internal process. The filing does not state an amount.
other · 14 Oct 2026
Promoter-group members ask to become public shareholders
41 promoter-group members (relatives and related entities, not the four founders) asked to be reclassified as public. The company applied to the exchanges on 14 Oct 2026; Vikas Singh is among the applicants, the three pledged trusts are not.
other · 14 Oct 2026
Insider-trading code breach reported
On 14 Oct 2026 the company reported that a finance manager, a designated person, made an "inadvertent" contra trade of 2 shares on 26 Aug 2026, against its insider-trading code.
surveillance · 21 Dec 2025
Exchange query on trading volume
NSE asked about a rise in trading volume in Dec 2025. The company replied on 21 Dec 2025 that the movement was "purely market-driven".
auditor · 20 Apr 2026
Secretarial auditor appointed; statutory auditor unchanged
The exchange item titled "Change in Auditors" (20 Apr 2026) is the appointment of Nilesh Shah & Associates as secretarial auditor. B S R & Co. LLP stays statutory auditor for FY24–FY28; the FY26 audit report was unmodified.
regulatory · 29 Oct 2025
Regulatory items listed in the RHP
The RHP's items include SEBI administrative warnings and deficiency letters, mostly to Groww Asset Management (some from before Groww bought it), and a SEBI settlement order of 28 Jun 2024 in an Indiabulls Mutual Fund matter. Groww Invest Tech settled two SEBI show-cause notices (11 Oct and 25 Nov 2024) without admitting or denying any of the alleged violations, for ₹0.341 crore and ₹0.478 crore, by orders of 13–14 May 2025. BSE issued it a show-cause notice on 30 May 2025; the RHP said it was pending at the RHP date (29 Oct 2025). A SEBI show-cause notice of 3 Oct 2024 went to Finwizard (Fisdom), a year before Groww bought it. IRDAI imposed a penalty on 14 Jun 2024 (₹0.005 crore).
other · 29 Oct 2025
Pending tax cases
The RHP lists 4 tax proceedings pending against the company, ₹139.14 crore in total: 2 direct tax cases (₹48.58 crore) and 2 indirect tax cases (₹90.56 crore).
disclosure · 30 Jul 2026
Only four audited years
FY23–FY25 figures come from the restated statements in the RHP and FY26 from the annual report. FY22 figures are not in the RHP or any exchange filing; Groww Inc., not this company, was the group’s parent then.
Sources (11)
- Annual Report FY26 (2025-26), standalone and consolidated financial statements
- Board comments on delay in filing the related-party transaction disclosure (Reg 23(9))
- ICRA rationale: Billionbrains Garage Ventures, issuer rating upgraded to [ICRA]AA (Stable)
- CARE Ratings press release: issuer rating CARE AA; Stable assigned
- Shareholding pattern, 30 Sep 2026 (XBRL)
- Receipt of requests for reclassification of promoter-group members to public (Reg 31A)
- Application to stock exchanges for promoter-group reclassification (Reg 31A)
- Report of insider-trading code violation (contra trade by a designated person)
- Reply to NSE on increase in trading volume
- Q4 FY26 and FY26 audited results, with board outcome (secretarial auditor, director resignation)
- Red Herring Prospectus dated 29 Oct 2025 (restated consolidated financial information FY23-FY25 and Q1 FY26)
20What the market paid
20What the market paid · price as of 11 Nov 2026
What did the market pay for Groww on 11 Nov 2026?
Price as of 11 Nov 2026 (shown for education; prices change daily).
Price as of 11 Nov 2026: ₹221.22, the NSE closing price; the IPO price was ₹100 in Nov 2025. Market value: ₹138,785 crore on 6,273,596,631 shares (shareholding pattern of 30 Sep 2026), a Cityfort calculation. P/E is the price divided by one year's profit per share: 63.8 on FY26 basic EPS of ₹3.47, or 51.5 on the last four quarters' profit of ₹2,693.98 crore. P/B divides market value by shareholders' equity: 12.0 on ₹11,568.01 crore at 30 Sep 2026. Both ratios are Cityfort calculations. EV/EBITDA is not shown, because deposits held for exchanges make cash hard to define.
- Share price
- ₹221.22
- Market value (market cap)
- ₹138,785 cr
- P/E
- 63.8×
- P/B
- 12×
Source: NSE capital market bhavcopy, 11 Nov 2026 (GROWW close 221.22); Shareholding pattern, 30 Sep 2026 (XBRL); Annual Report FY26 (2025-26), standalone and consolidated financial statements and 2 more
Sources (5)
- NSE capital market bhavcopy, 11 Nov 2026 (GROWW close 221.22)
- Shareholding pattern, 30 Sep 2026 (XBRL)
- Annual Report FY26 (2025-26), standalone and consolidated financial statements
- Q2 FY27 results (quarter and six months to 30 Sep 2026), consolidated and standalone
- Q4 FY26 and FY26 audited results, with board outcome (secretarial auditor, director resignation)
21How it got here
21How it got here
How did Groww get here?
2018
Milestone
Indian company incorporated
Billionbrains Garage Ventures was incorporated in Jan 2018 as a subsidiary of Groww Inc., a US (Delaware) company.
2024
Business-model change
US parent merged into the Indian company
NCLT Bengaluru approved the merger of Groww Inc. into the Indian company on 28 Mar 2024. FY24 carries a one-time ₹1,339.68 crore US tax on it.
2025
Milestone
Fisdom bought
The agreement to buy Finwizard Technology (Fisdom) was signed on 16 May 2025; ₹961.05 crore was paid by 3 Oct 2025.
2025
Milestone
Listed on NSE and BSE
The IPO ran 4–7 Nov 2025 at ₹100 a share (band ₹95–100), and the shares listed on 12 Nov 2025. NSE data showed bids for 17.60 times the shares on offer (as of 7 Nov 2025, 19:00).
2026
Milestone
Credit rating upgraded
ICRA upgraded the issuer rating from [ICRA]AA- to [ICRA]AA (Stable) on 30 Jul 2026.
2026
Milestone
SSGA invests in Groww Asset Management
Completed on 4 Aug 2026 for ₹580.03 crore. SSGA holds 22.94% economic interest and 4.85% of voting rights.
Sources (6)
- ICRA rationale: Billionbrains Garage Ventures, issuer rating upgraded to [ICRA]AA (Stable)
- Red Herring Prospectus dated 29 Oct 2025 (restated consolidated financial information FY23-FY25 and Q1 FY26)
- Q2 FY27 results (quarter and six months to 30 Sep 2026), consolidated and standalone
- NSE public issue page data for GROWW: issue details and bid details (updated 07-Nov-2025 19:00)
- Reg 30 disclosure: SSGA investment in Groww Asset Management (SSPA, 14 Jan 2026)
- Update: SSGA investment in Groww AMC completed
Used in a free classroom lesson: Project: an IPO filing profile from one RHP.
22Sources and changes
Where every number on this page comes from
Sources (35 documents)
- S1Annual Report FY26 (2025-26), standalone and consolidated financial statements · NSE (company filing) · Tier 1: company or exchange filing · 30 Jul 2026
- S2Red Herring Prospectus dated 29 Oct 2025 (restated consolidated financial information FY23-FY25 and Q1 FY26) · NSE (IPO documents) · Tier 1: company or exchange filing · 29 Oct 2025
- S3Q2 FY27 results (quarter and six months to 30 Sep 2026), consolidated and standalone · NSE (company filing) · Tier 1: company or exchange filing · 14 Oct 2026
- S4Q1 FY27 results (quarter to 30 Jun 2026) · NSE (company filing) · Tier 1: company or exchange filing · 15 Jul 2026
- S5Q4 FY26 and FY26 audited results, with board outcome (secretarial auditor, director resignation) · NSE (company filing) · Tier 1: company or exchange filing · 20 Apr 2026
- S6Q3 FY26 results (quarter and nine months to 31 Dec 2025) · NSE (company filing) · Tier 1: company or exchange filing · 14 Jan 2026
- S7Q2 FY26 results, machine-readable re-filing of the 21 Nov 2025 results · NSE (company filing) · Tier 1: company or exchange filing · 12 Dec 2025
- S8Q2 FY27 consolidated results, integrated filing (XBRL) · NSE (company filing) · Tier 1: company or exchange filing · 14 Oct 2026
- S9Q1 FY27 consolidated results, integrated filing (XBRL) · NSE (company filing) · Tier 1: company or exchange filing · 15 Jul 2026
- S10Q4 FY26 consolidated results, integrated filing (XBRL) · NSE (company filing) · Tier 1: company or exchange filing · 21 Apr 2026
- S11Q3 FY26 consolidated results, integrated filing (XBRL) · NSE (company filing) · Tier 1: company or exchange filing · 14 Jan 2026
- S12Q2 FY26 consolidated results, integrated filing (XBRL) · NSE (company filing) · Tier 1: company or exchange filing · 21 Nov 2025
- S13Shareholders' letter Q2 FY27 · NSE (company filing) · Tier 1: company or exchange filing · 14 Oct 2026
- S14Shareholders' letter Q1 FY27 · NSE (company filing) · Tier 1: company or exchange filing · 15 Jul 2026
- S15Shareholder letter Q4 FY26 · Company (groww.in investor relations) · Tier 1: company or exchange filing · 20 Apr 2026
- S16KPI Handbook Q2 FY27 (Excel: operational, financial and Groww AMC KPIs, summary P&L) · Company (groww.in investor relations) · Tier 1: company or exchange filing · 14 Oct 2026
- S17Q2 FY27 earnings call transcript (call 14 Oct 2026) · NSE (company filing) · Tier 1: company or exchange filing · 16 Oct 2026
- S21Shareholding pattern, 30 Sep 2026 (XBRL) · NSE (company filing) · Tier 1: company or exchange filing · 7 Oct 2026
- S22Shareholding pattern, 30 Jun 2026 (XBRL) · NSE (company filing) · Tier 1: company or exchange filing · 28 Jul 2026
- S23Shareholding pattern, 31 Mar 2026 (XBRL, as disseminated 28 Jul 2026) · NSE (company filing) · Tier 1: company or exchange filing · 28 Jul 2026
- S24Shareholding pattern, 31 Dec 2025 (XBRL) · NSE (company filing) · Tier 1: company or exchange filing · 19 Jan 2026
- S25Shareholding pattern before listing, 11 Nov 2025 (XBRL) · NSE (company filing) · Tier 1: company or exchange filing · 14 Nov 2025
- S26ICRA rationale: Billionbrains Garage Ventures, issuer rating upgraded to [ICRA]AA (Stable) · ICRA · Tier 2: rating agency or regulator · 30 Jul 2026
- S27ICRA rationale: issuer rating [ICRA]AA- (Stable) reaffirmed (attached to the company's exchange filing) · ICRA (via NSE company filing) · Tier 2: rating agency or regulator · 28 Nov 2025
- S28CARE Ratings press release: issuer rating CARE AA; Stable assigned · CARE Ratings · Tier 2: rating agency or regulator · 14 Apr 2026
- S29NSE capital market bhavcopy, 11 Nov 2026 (GROWW close 221.22) · NSE · Tier 1: company or exchange filing · 11 Nov 2026
- S31NSE public issue page data for GROWW: issue details and bid details (updated 07-Nov-2025 19:00) · NSE · Tier 1: company or exchange filing · 7 Nov 2025
- S32Reg 30 disclosure: SSGA investment in Groww Asset Management (SSPA, 14 Jan 2026) · NSE (company filing) · Tier 1: company or exchange filing · 14 Jan 2026
- S33Update: SSGA investment in Groww AMC completed · NSE (company filing) · Tier 1: company or exchange filing · 4 Aug 2026
- S34Board comments on delay in filing the related-party transaction disclosure (Reg 23(9)) · NSE (company filing) · Tier 1: company or exchange filing · 16 Jul 2026
- S35Receipt of requests for reclassification of promoter-group members to public (Reg 31A) · NSE (company filing) · Tier 1: company or exchange filing · 12 Oct 2026
- S36Application to stock exchanges for promoter-group reclassification (Reg 31A) · NSE (company filing) · Tier 1: company or exchange filing · 14 Oct 2026
- S37Report of insider-trading code violation (contra trade by a designated person) · NSE (company filing) · Tier 1: company or exchange filing · 14 Oct 2026
- S38Clarification on news of the Cloudflare outage affecting the platform · NSE (company filing) · Tier 1: company or exchange filing · 6 Dec 2025
- S40Reply to NSE on increase in trading volume · NSE (company filing) · Tier 1: company or exchange filing · 21 Dec 2025
Changes to this page (v1 · 12 Nov 2026)
- v1 · 12 Nov 2026First version. (first version)
Numbers come only from tier 1 and tier 2 sources. Read how we research.
Disclaimer
For learning only. Cityfort is not a SEBI-registered adviser and does not recommend buying or selling any security. Prices shown are dated and may be out of date.
Investing in securities involves risk, including loss of capital. Before making any investment decision, do your own research and consider consulting a SEBI-registered investment adviser.
Cityfort, its owners and contributors may or may not hold securities of companies covered. Content is not an offer or solicitation to buy or sell any security.
Read the full disclaimerHide the full disclaimer
Cityfort publishes educational content that explains how listed companies work. Cityfort is not registered with the Securities and Exchange Board of India (SEBI) as an Investment Adviser or Research Analyst and does not provide investment advice, recommendations, ratings, price targets or any opinion on whether to buy, sell or hold any security.
All information is taken from publicly available sources, mainly company filings on BSE and NSE, which are listed on each page with dates. We work to keep it accurate and correct errors publicly, but we do not guarantee that it is complete, accurate or up to date. Any market price or price-based ratio shown is dated, may be out of date by the time you read it, and is included only to explain concepts.
Statements by company management are reported as statements, with their date and source; they are not our forecasts.