Capital Goods · NSE: INDOMIM · BSE: 544837
Indo-MIM: how the business works
Indo-MIM makes small, complex metal parts for makers of cars, firearms, medical devices and aircraft, mostly outside India; its FY26 revenue was ₹4,193 crore.
Follow Indo-MIM
Email me when Indo-MIM's page is updated after results.
We store your email address with Kit, our email provider, which also records when you sign up and whether you open or click our emails. We send a confirmation email first. See our privacy policy.
INDO-MIM Limited · Hoskote, Bengaluru, Karnataka · Founded 1996
Updated for Q2 FY27 · checked
- Revenue, FY26
- ₹4,193 cr
- Profit, FY26
- ₹533.5 cr
- Plants in 4 countries
- 15
- Incorporated
- 1996
- Promoter group, Sep 2026
- 77.65%
The short version
Indo-MIM in 5 points
1 · What it sells
Indo-MIM makes small, complex metal parts, mainly by metal injection moulding, for makers of cars, firearms, medical devices, consumer goods and aircraft, and its FY26 revenue from operations was ₹4,193.0 crore.
2 · Who pays it
In FY26, automotive customers paid 24.61% of Indo-MIM's revenue, firearm-parts customers 18.69%, medical 18.08%, aerospace 11.96%, consumer 10.80%, and metal powder, tools and traded products made up 15.86%.
3 · What it keeps from ₹100
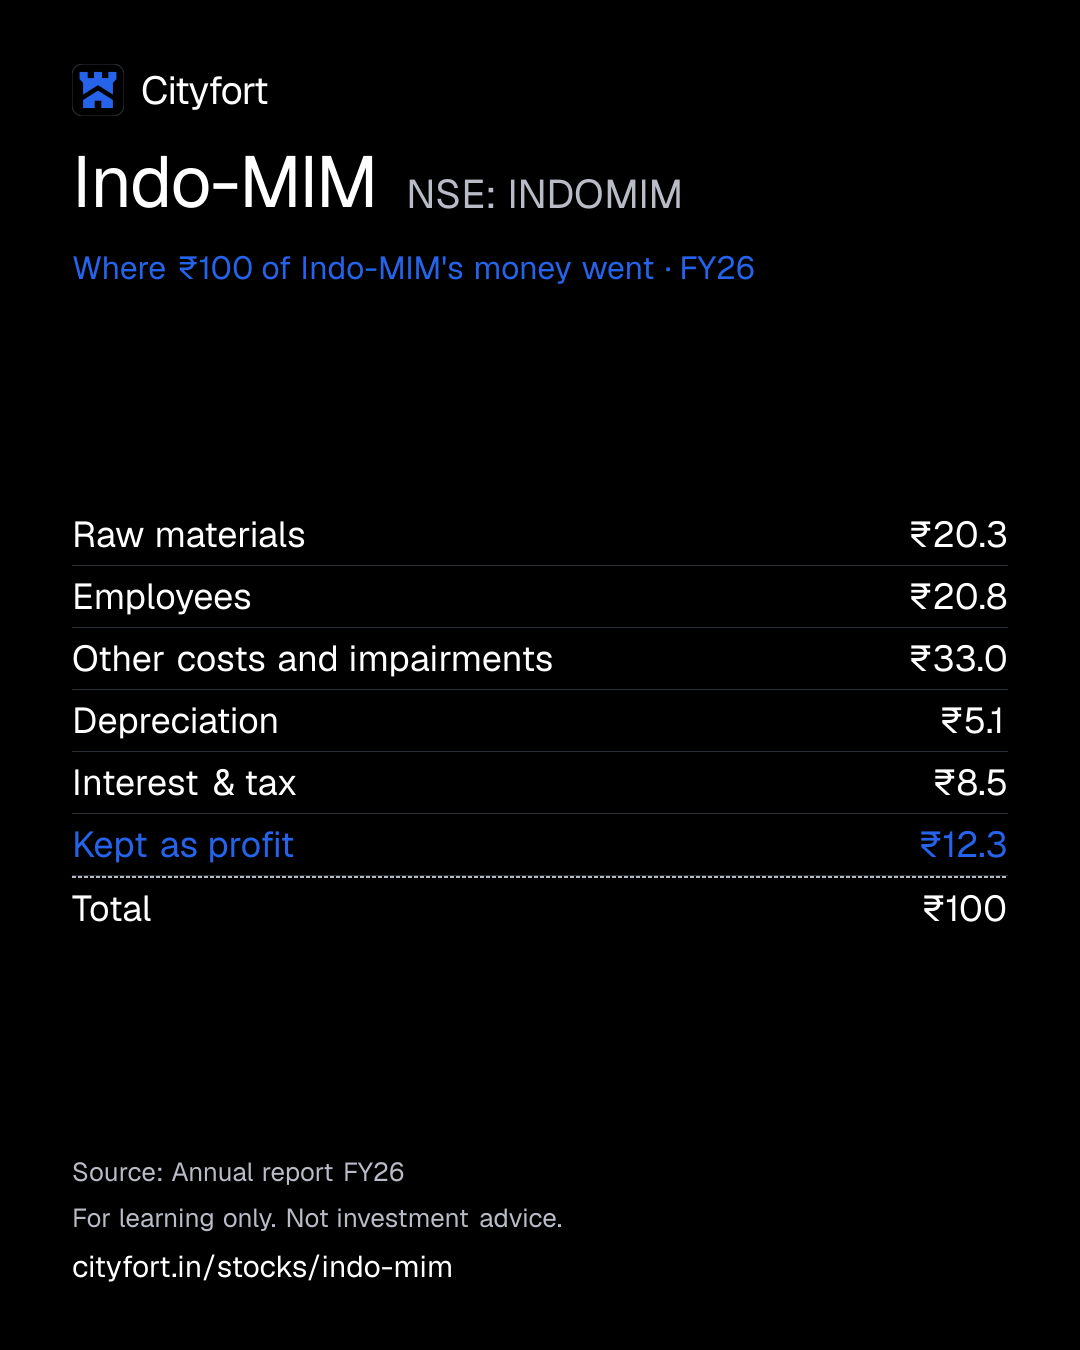
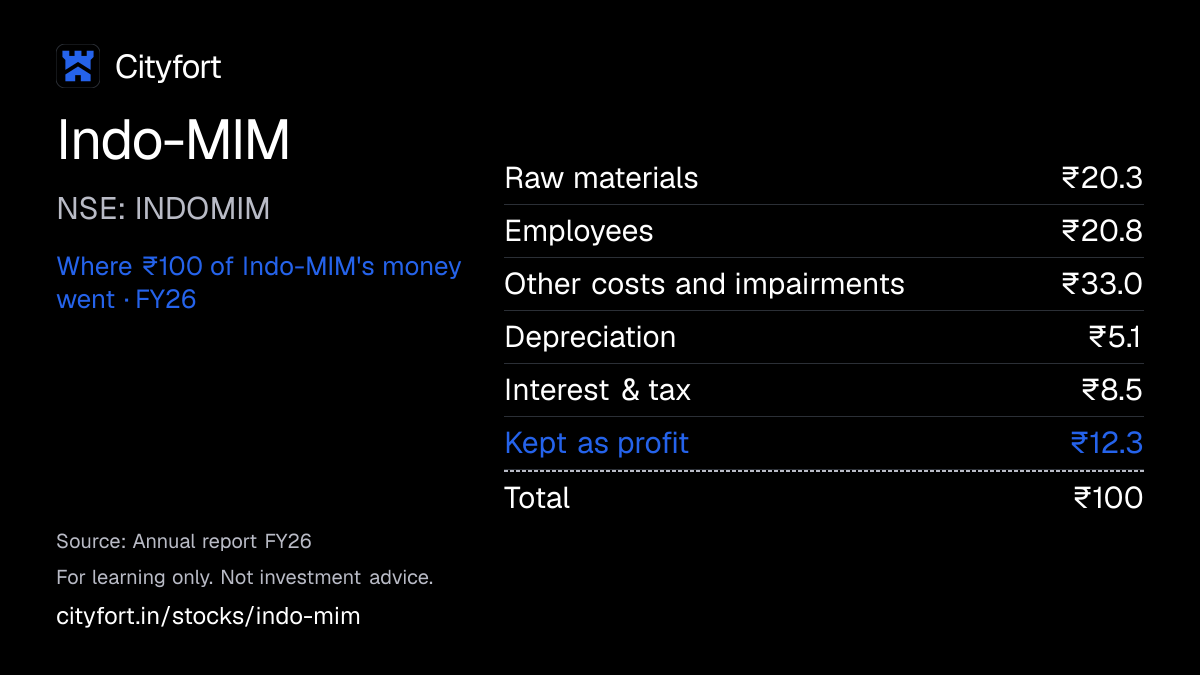
Of every ₹100 that came in during FY26, Indo-MIM spent ₹20.8 on employees and ₹20.3 on raw materials, and kept ₹12.3 as profit after ₹78.0 crore of write-downs on its UK and US subsidiaries; its EBITDA margin was 23.7%, or 25.5% before those write-downs (Cityfort calculation).
4 · Where the operating profit comes from
Indo-MIM reports a single business segment, so profit is not split by product, and 77.20% of revenue came from customers outside India.
5 · The one thing to watch
Q2 FY27 net profit was ₹215.2 crore, 99.9% above Q2 FY26, which carried a ₹92.7 crore exceptional charge; before exceptional items and tax, profit rose 27.9%.
Sources: From Indo-MIM's Jul 2026 prospectus, its FY26 annual report and its Q2 FY27 results · checked
Sources (3)
- Red Herring Prospectus dated 17 Jul 2026 (restated consolidated financial information FY24-FY26, Our Business, risk factors, capital structure, litigation)
- Annual Report FY26 (2025-26), incl. audited consolidated financial statements
- Unaudited standalone and consolidated financial results, quarter and half year ended 30 Sep 2026 (Q2 FY27), with statement of assets and liabilities, cash flow, limited review reports and board outcome
01Where the money goes · FY26
Where does ₹100 of Indo-MIM's money go?
Indo-MIM · FY26
Receipt for every ₹100
| Raw materials | ₹20.3 |
|---|---|
| Employees | ₹20.8 |
| Other costs and impairments | ₹33.0 |
| Depreciation | ₹5.1 |
| Interest & tax | ₹8.5 |
| Kept as profit | ₹12.3 |
| Total | ₹100 |
Each line = amount ÷ total money in × 100. Lines may not add to exactly ₹100 because of rounding.
How this is worked out
Of every ₹100 that came in during FY26 (revenue plus other income): each line = the money-flow line ÷ ₹4,320.7 crore × 100 (Cityfort calculation from the FY26 annual report).
Save this receipt as an image
Embed this receipt or the key numbers
Paste this code into a blog or website to show the card you choose, with a link back to this page.
Each week: the next company due to report results, explained in 5 points.
We'll email you once a week with what changed on Cityfort. Facts only, no tips. Unsubscribe any time.
We store your email address with Kit, our email provider, which also records when you sign up and whether you open or click our emails. We send a confirmation email first. See our privacy policy.
02The business in one line
What does Indo-MIM do?
Makers of cars, firearms, medical devices and aircraft pay Indo-MIM for small precision metal parts; staff, materials and plant running costs take most of the money, and ₹12.3 of every ₹100 that came in during FY26 was profit.
- Customers outside India paid 77.20% of FY26 revenue, and North America alone 43.68%. No single customer paid more than 7.97%.
- Green Meadows Investments, the Chivukula family's Mauritius holding company, held 76.31% on 30 Sep 2026. The shares listed on 30 Jul 2026.
03Who pays it
Who pays Indo-MIM?
Automotive
24.6%
of revenue
Parts for vehicle safety, fuel systems, powertrains and interiors. 193 customers in FY26.
Defence: firearm parts
18.7%
of revenue
Firearm components such as triggers, hammers and sights. 133 customers in FY26; revenue fell from ₹892.3 crore in FY25 to ₹783.7 crore.
Medical
18.1%
of revenue
Components for surgical devices used in endoscopy, laparoscopy, dental robotics and orthopaedics. 95 customers in FY26.
Aerospace
12%
of revenue
Manifolds, housings, nozzles, locking rings and brackets for aircraft makers. 97 customers in FY26.
Consumer
10.8%
of revenue
Fashion accessories, crossbow parts, cellphone components, tools and hardware. 220 customers in FY26.
Others
15.9%
of revenue
Metal powder, tools and traded products, outside the five product groups.
- Automotive24.6%
- Defence: firearm parts18.7%
- Medical18.1%
- Aerospace12%
- Consumer10.8%
- Others15.9%
How spread out the customers are
The largest customer paid 7.97% of FY26 revenue, down from 13.69% in FY24. Two of the top five FY26 customers make electronic components, one of them a customer only since FY26. Customers buy on purchase orders without firm long-term volume commitments, the prospectus says.
- Largest customer
- 8%
- Top 5 customers
- 29%
- Top 10 customers
- 38%
04How it makes money
How does Indo-MIM make money?
Profit comes from parts that are hard to qualify and are then reordered year after year.
ICRA links Indo-MIM's margins to high entry barriers, long customer approval processes and customers who stay. Repeat customers gave 91.60% of FY26 revenue. One-off write-downs of overseas subsidiaries cut EBITDA in each of the last three years.
EBITDA per ₹100 of revenue
₹23.2₹23.7
FY24 to FY26
- A customer asks Indo-MIM to make a part for a new product.
- Indo-MIM designs the mould, and the customer tests and approves the part.
- Once approved, the part is reordered for the life of the product.
- Its MIM plants used 30.58% of capacity in FY26, by the company's measure.
- Profit funds new moulds, plants and acquisitions abroad.
↺ Step 5 feeds back into step 1.
05The numbers · Consolidated · ₹ crore
How has Indo-MIM done?
Revenue
₹4,193 crFY26
Revenue rose from ₹2,870.4 crore in FY24 (restated) to ₹4,193.0 crore in FY26, and Q2 FY27's ₹1,271.8 crore was 14.3% above Q2 FY26; Q3 FY26 is in no filing because the company was unlisted then.
₹ crore
See the numbers
Net profit
₹534 crFY26
Net profit rose from ₹283.7 crore in FY24 to ₹533.5 crore in FY26 after write-downs every year, and Q2 FY27's ₹215.2 crore was 99.9% above Q2 FY26, which carried a ₹92.7 crore exceptional charge; profit before exceptional items and tax rose 27.9%.
₹ crore
See the numbers
Net profit for every ₹100 of revenue
₹12.7FY26
EBITDA per ₹100 of revenue (Cityfort calculation, after one-off write-downs) was ₹23.2 in FY24, ₹25.0 in FY25, ₹23.7 in FY26 and ₹29.9 in Q2 FY27; the company's own FY26 measure, which leaves the write-downs out, was 25.5%.
Net margin: ₹ of net profit per ₹100 of revenue
See the numbers
Free cash flow
₹660 crFY26
Free cash flow (operating cash minus capex) rose from ₹82.3 crore in FY24 to ₹660.0 crore in FY26 and was ₹213.0 crore in H1 FY27; FY26's filed operating cash flow of ₹1,077.2 crore included ₹78.0 crore of exceptional items added back.
₹ crore · cash from operations minus spending on plants and equipment
See the numbers
See all yearly numbers
EBITDA = profit before interest, tax and wear-and-tear of assets. Financial year runs April to March (March year end). Net profit is the share belonging to the company's owners.
Sources (6)
- Red Herring Prospectus dated 17 Jul 2026 (restated consolidated financial information FY24-FY26, Our Business, risk factors, capital structure, litigation)
- Annual Report FY26 (2025-26), incl. audited consolidated financial statements
- Unaudited standalone and consolidated financial results, quarter ended 30 Jun 2026 (Q1 FY27), with limited review reports and board outcome
- Unaudited standalone and consolidated financial results, quarter and half year ended 30 Sep 2026 (Q2 FY27), with statement of assets and liabilities, cash flow, limited review reports and board outcome
- Integrated filing (financials) XBRL, consolidated, quarter ended 30 Jun 2026
- Integrated filing (financials) XBRL, consolidated, quarter and half year ended 30 Sep 2026
06Who runs it
Who runs Indo-MIM, and did they deliver?
Krishna Chivukula
Chairman and Managing Director · since 1996
A promoter and a director since 12 Apr 1996, with over 30 years in the MIM industry, the prospectus says. FY26 salary ₹55.44 crore plus ₹1.66 crore from Indo-MIM Inc.
Krishna Chivukula Jr.
Whole-time Director and Chief Executive Officer · since 2024
A promoter and son of the chairman; a director since 2004, in his present role since 27 Apr 2024. FY26 salary ₹36.96 crore plus ₹1.56 crore from Indo-MIM Inc.
Parasuraman Balasubramanian
Vice President, Finance and Chief Financial Officer · since 2024
With the company since 1998, first as general manager, finance; appointed CFO on 30 Mar 2024. FY26 pay ₹3.9 crore, the prospectus says.
What they said, and what happened
1 delivered · 1 too early to tell
Said on 17 Jul 2026
The prospectus of 17 Jul 2026 said ₹400 crore of the fresh issue money would repay borrowings.
DeliveredWhat happened
All ₹400.0 crore was used to repay loans by 30 Sep 2026, and CARE Ratings, the monitoring agency, reported no deviation from the stated uses.
Said on 14 Oct 2026
The board said on 14 Oct 2026 that it would set up a wholly owned subsidiary in Vietnam, investing ₹45 crore over 5 years, with incorporation planned for about 1 Dec 2026.
Too early to tellWhat happened
The planned incorporation date, about 1 Dec 2026, falls after this page's date of 16 Nov 2026.
Sources (4)
- Red Herring Prospectus dated 17 Jul 2026 (restated consolidated financial information FY24-FY26, Our Business, risk factors, capital structure, litigation)
- Unaudited standalone and consolidated financial results, quarter and half year ended 30 Sep 2026 (Q2 FY27), with statement of assets and liabilities, cash flow, limited review reports and board outcome
- Monitoring agency report (CARE Ratings) on use of IPO proceeds, quarter ended 30 Sep 2026
- Outcome of board meeting 14 Oct 2026: wholly owned subsidiary in Vietnam (Rs 45 crore over 5 years), re-appointment of three independent directors
07What could go wrong
What could go wrong for Indo-MIM?
- Regulation
Exports and US tariffs
77.20% of FY26 revenue came from outside India and 43.68% from North America. The prospectus warns that US tariffs, including the Aug 2025 rise on Indian auto components, could raise costs and hurt price competitiveness in the US.
Watch North America's share of revenue in the FY27 annual report, and any change in US tariffs on Indian parts.
- Demand
No firm long-term orders
Customers buy on purchase orders and give no firm long-term volume commitments, the prospectus says. They can cancel, change or delay orders.
Watch Quarterly revenue growth; Q2 FY27 revenue was 14.3% above Q2 FY26.
- Execution
Write-downs on overseas buys
Impairments of the US subsidiary Triax and the UK subsidiary Conway Marsh Garrett cost ₹76.5 crore in FY24, ₹115.2 crore in FY25 and ₹78.0 crore in FY26.
Watch Exceptional items in each quarter's results; Q1 and Q2 FY27 had none.
- Raw-material prices
Imported metal powders
60.95% of FY26 raw material purchases were imported. ICRA says this exposes the company to input price swings and supply chain risk, and it holds 125–135 days of inventory.
Watch Inventories, ₹999.9 crore on 30 Sep 2026 against ₹895.0 crore on 31 Mar 2026.
- Governance
Promoter pay and large payouts
The two executive promoters were paid ₹95.6 crore in FY26, 17.9% of net profit, and their approved salaries rise 10% a year to Mar 2029. ₹329.2 crore of dividends went to pre-IPO holders in Apr–Jun 2026.
Watch Directors' pay in the FY27 annual report and dividends declared after listing.
- Governance
Public shareholding below the 25% minimum
Public shareholders held 22.35% on 30 Sep 2026, below the 25% minimum for listed companies. Reaching it needs share sales by the promoter group or a new share issue.
Watch Share sales by Green Meadows Investments or any new share issue.
- Legal
Tax disputes
The prospectus lists 40 tax cases involving ₹421.3 crore, including 34 indirect-tax cases for ₹338.2 crore against the company, where tax authorities claim amounts the company disputes.
Watch Contingent liabilities in the FY27 annual report.
Sources (6)
- Red Herring Prospectus dated 17 Jul 2026 (restated consolidated financial information FY24-FY26, Our Business, risk factors, capital structure, litigation)
- Unaudited standalone and consolidated financial results, quarter and half year ended 30 Sep 2026 (Q2 FY27), with statement of assets and liabilities, cash flow, limited review reports and board outcome
- Annual Report FY26 (2025-26), incl. audited consolidated financial statements
- ICRA rationale: Indo-MIM Limited, rating reaffirmed [ICRA]AA+ (Stable), 7 Apr 2026
- Unaudited standalone and consolidated financial results, quarter ended 30 Jun 2026 (Q1 FY27), with limited review reports and board outcome
- Shareholding pattern as of 30 Sep 2026 (XBRL)
08Supporters and critics
What do supporters and critics point to?
What supporters point to
- Revenue rose from ₹2,870.4 crore in FY24 to ₹4,193.0 crore in FY26, and H1 FY27 revenue was 11.8% above H1 FY26.
- The company-commissioned Frost & Sullivan report ranks Indo-MIM the world's largest MIM maker in CY2025, with 6.8% of the market; its MIM capacity was 874.6 million parts a year in FY26.
- Net debt fell to ₹303.5 crore on 30 Sep 2026 from ₹619.9 crore on 31 Mar 2026, and FY26 free cash flow was ₹660.0 crore.
What critics point to
- Write-downs of overseas subsidiaries cost ₹76.5 crore, ₹115.2 crore and ₹78.0 crore in FY24, FY25 and FY26.
- The two executive promoters were paid ₹95.6 crore in FY26, 17.9% of net profit, and ICRA linked higher borrowings to dividends and promoter pay.
- Firearm-parts revenue fell from ₹892.3 crore in FY25 to ₹783.7 crore in FY26, and the MIM plants used 30.58% of their capacity.
09What to watch next
What should you watch next at Indo-MIM?
Next event
Q3 FY27 results
Date not announced yet.
Q3 FY26 figures, filed for the first time
Q3 FY26 (Oct–Dec 2025) is in no filing yet. The Q3 FY27 results will show it for the first time as the comparison column.
Public shareholding
Public shareholders held 22.35% on 30 Sep 2026. Watch for share sales by the promoter group or new shares that raise it to 25%.
Exceptional items
Q1 and Q2 FY27 had no exceptional items, after write-downs of overseas subsidiaries in each of FY24, FY25 and FY26.
10Key facts
Key facts about Indo-MIM
- What does Indo-MIM do?
- Indo-MIM makes small, complex metal parts, mainly by metal injection moulding (MIM), plus castings and machined parts, for makers of cars, firearms, medical devices, consumer goods and aircraft. Its FY26 revenue from operations was ₹4,193.0 crore.
- How does Indo-MIM make money?
- Indo-MIM sells parts made to each customer's design. In FY26, automotive customers paid 24.61% of its revenue, firearm-parts customers 18.69%, medical 18.08%, aerospace 11.96% and consumer 10.80%; metal powder, tools and traded products made up 15.86%.
- Who are Indo-MIM's customers?
- Indo-MIM's customers are manufacturers in 55 countries, and 77.20% of its FY26 revenue came from outside India. Its largest customer paid 7.97% of FY26 revenue and its top 10 customers 38.41%; the prospectus does not name them.
- How big is Indo-MIM?
- Indo-MIM's FY26 revenue from operations was ₹4,193.0 crore and its net profit ₹533.5 crore. In Q2 FY27 (Jul–Sep 2026) its revenue was ₹1,271.8 crore and net profit ₹215.2 crore.
- Who owns Indo-MIM?
- On 30 Sep 2026 Indo-MIM's promoter group held 77.65%, almost all through Green Meadows Investments (76.31%), a Mauritius company controlled by the Chivukula family. Mutual funds held 10.19%, and no promoter shares were pledged.
- When did Indo-MIM list on the stock exchanges?
- Indo-MIM listed on NSE and BSE on 30 Jul 2026 at an issue price of ₹485 a share. The ₹3,812.1 crore IPO had ₹500.0 crore of new shares for the company and ₹3,312.1 crore of shares sold by existing holders.
- How much debt does Indo-MIM have?
- On 30 Sep 2026 Indo-MIM had ₹941.0 crore of borrowings and ₹637.5 crore of cash and bank balances, against ₹1,090.5 crore of borrowings on 31 Mar 2026. It used ₹400.0 crore of its IPO money to repay loans.
Sources (5)
- Red Herring Prospectus dated 17 Jul 2026 (restated consolidated financial information FY24-FY26, Our Business, risk factors, capital structure, litigation)
- Annual Report FY26 (2025-26), incl. audited consolidated financial statements
- Unaudited standalone and consolidated financial results, quarter and half year ended 30 Sep 2026 (Q2 FY27), with statement of assets and liabilities, cash flow, limited review reports and board outcome
- Shareholding pattern as of 30 Sep 2026 (XBRL)
- NSE circular NSE/CML/75442: listing of equity shares of INDO-MIM Limited (IPO), symbol INDOMIM, ISIN INE084101034
Terms on this page
- Capital expenditure (capex)
- Credit rating
- Customer concentration
- Dividend payout ratio
- EBITDA
- FII and DII holding
- Free cash flow
- Market capitalisation
- Net debt
- Net profit
Each explains the term in plain English, with the same number from other companies on Cityfort.
Go deeper
More detail from the same filings. Open any section.
11What it sells
11What it sells
What does Indo-MIM sell?
Metal injection moulded (MIM) parts
Fine metal powder mixed with a binder is injected into a mould, the binder is removed, and the part is baked in a furnace (sintered) into solid metal. Its MIM plants could make 874.6 million parts a year in FY26.
Investment castings
Parts made by pouring molten metal into ceramic moulds, at Tirupati in India and at Triax Industries in the US, with capacity of 20.2 million parts a year in FY26.
Precision machining, 3D printing and electronic parts
Cutting parts to finished size, metal 3D printing at Conway Marsh Garrett in the UK, and electronic component manufacturing, all reported in the same single business segment.
Metal powder, tools and traded products
Sales outside the five product groups: ₹665.0 crore in FY26, up from ₹199.1 crore in FY25.
Think of it like this
MIM works like moulding a plastic toy, but with metal powder: a mould gives the shape, and a furnace fuses the powder into solid metal.
What it does
- Does: Makes parts to each customer's design, in 6 plants in India, 6 in the US, 2 in the UK and 1 in Mexico
- Does: Sells to customers in 55 countries
- Does: Designs medical devices for customers through Phoenix DeVentures II in the US, bought in 2025
What it does not do
- Does not: Does not make finished cars, guns or medical devices; it supplies parts to the companies that do
- Does not: Does not sell to shoppers; its customers are manufacturers
- Does not: Does not report profit by product group: it has one reported business segment
Sources (2)
12How the money flows
12How the money flows · FY26
How does money flow through Indo-MIM?
Money in
- Revenue from operations₹4,193 cr
- Other income₹128 cr
The company
Indo-MIM
₹4,321 cr came in
Money out
- Raw materials (net of stock change)₹877 cr
- Employee costs₹899 cr
- Other running costs and impairments₹1,424 cr
- Depreciation and amortisation₹220 cr
- Interest₹167 cr
- Tax₹200 cr
- Net profit₹534 cr
- Customers paid ₹4,193.0 crore for parts in FY26, and ₹127.7 crore came in as other income.
- Metal powders and other materials took ₹876.6 crore; 60.95% of FY26 purchases were imported.
- Employees cost ₹899.1 crore. Other running costs took ₹1,346.4 crore, including ₹420.7 crore of stores, spares and tools.
- Write-downs of the UK and US subsidiaries took ₹78.0 crore, depreciation ₹220.1 crore, interest ₹166.8 crore and tax ₹200.2 crore.
- ₹533.5 crore was left as net profit.
13What it needs to run
13What it needs to run
What does Indo-MIM need to run?
15 plants
Six plants in Karnataka, Tamil Nadu and Andhra Pradesh, six in the US, two in the UK and one in Mexico, as of the Jul 2026 prospectus.
Imported metal powders
60.95% of FY26 raw material purchases were imported, from countries including China, Japan and the UK. ICRA says the company holds 125–135 days of inventory to avoid supply breaks.
Engineers and technicians
4,424 permanent employees in India on 31 Mar 2026, of whom 4,100 were engineers, metallurgists, designers, toolmakers or technicians, plus 497 trainees.
Spare MIM capacity
The MIM plants made 267.4 million parts in FY26, 30.58% of capacity, which the company measures on 353 working days of 21 hours. Utilisation was 35.76% in FY25.
14Where it sells
14Where it sells · FY26
Where does Indo-MIM sell?
- North America43.7%
- India22.8%
- Europe20%
- Rest of the world10.9%
- South East Asia2.7%
15Competitors and what protects it
15Competitors and what protects it
Who does Indo-MIM compete with?
Jiangsu Gian Technology (China)
ICRA names it a major global competitor, and the prospectus uses it as the only listed peer. The company-commissioned Frost & Sullivan report puts its CY2025 MIM revenue at USD 242 million, against Indo-MIM's USD 272 million.
ARC Group (FloMet), US
ICRA names it a major global competitor. The same Frost & Sullivan report puts the privately held Florida company's CY2025 MIM revenue at USD 95 million.
GKN Powder Metallurgy
Listed among the largest MIM makers in the Frost & Sullivan report quoted in the prospectus, with CY2025 MIM revenue of USD 145 million.
Nippon Piston Rings (Japan)
A listed Japanese company in the same report, with CY2025 MIM revenue of USD 100 million.
What protects the business
Each strength is scored 1 (weak) to 5 (strong) for the business, with the reason. It is not a rating of the share.
- Scale in MIM4 of 5
The company-commissioned Frost & Sullivan report says Indo-MIM had the world's largest installed MIM capacity on 31 Mar 2026; it was 874.6 million parts a year in FY26.
- Customers who stay4 of 5
Repeat customers gave 91.60% of FY26 revenue. ICRA cites the long approval process for new customers and high client stickiness.
- Plants in India and abroad3 of 5
15 plants in India, the US, the UK and Mexico let it supply customers that want parts made locally, the prospectus says.
Weak spot
Reliance on exports to the US
77.20% of FY26 revenue came from outside India and 43.68% from North America. The prospectus warns that US tariffs, including the Aug 2025 rise on Indian auto components, may raise costs.
16Where growth could come from
16Where growth could come from
Where could Indo-MIM's growth come from?
Indo-MIM had filed no investor presentation or earnings-call transcript by 16 Nov 2026, so this page quotes no management forecast. Its Q2 FY27 call was held on 16 Nov 2026.
Aerospace parts
Working₹501.5 crore, FY26
Aerospace revenue rose from ₹281.8 crore in FY24 to ₹376.3 crore in FY25 and ₹501.5 crore in FY26, 11.96% of revenue.
Status: Working, on track against what the company said.
Medical parts
Working₹758.0 crore, FY26
Medical revenue was ₹561.9 crore in FY24 and ₹577.3 crore in FY25, then ₹758.0 crore in FY26. Phoenix DeVentures II, a US medical device designer, was bought in 2025.
Status: Working, on track against what the company said.
Electronic component customers
New2 of the top 5 customers, FY26
Two of the five largest FY26 customers make electronic components, one since FY24 and one since FY26. India revenue rose from ₹335.6 crore in FY25 to ₹956.0 crore in FY26; the prospectus gives no customer-level reason.
Status: New, recently announced.
Vietnam subsidiary
Early₹45 crore over 5 years
The board approved a wholly owned subsidiary in Vietnam for electronics, prototype and engineering components on 14 Oct 2026, with incorporation planned for about 1 Dec 2026.
Status: Early, too early to judge.
Status compares progress with what the company itself said it would do: Working = on track against what the company said; Mixed = partly on track; Behind = behind the company's own plan; New = recently announced; Early = too early to judge.
Sources (4)
- Intimation of earnings conference call on 16 Nov 2026, 15:00 IST, for the quarter and half year ended 30 Sep 2026
- Unaudited standalone and consolidated financial results, quarter and half year ended 30 Sep 2026 (Q2 FY27), with statement of assets and liabilities, cash flow, limited review reports and board outcome
- Red Herring Prospectus dated 17 Jul 2026 (restated consolidated financial information FY24-FY26, Our Business, risk factors, capital structure, litigation)
- Outcome of board meeting 14 Oct 2026: wholly owned subsidiary in Vietnam (Rs 45 crore over 5 years), re-appointment of three independent directors
17Financial strength and debt
17Financial strength · 30 Sep 2026
How much debt does Indo-MIM have?
- Total debt₹941 cr
- Cash and investments₹638 cr
- Net debt (debt minus cash)₹304 cr
- Net worth (shareholders' money)₹3,457 cr
- Debt to equity
- 0.27×
- ₹ of debt for every ₹1 of shareholders' money
- Cash and bank of ₹637.5 crore = cash and equivalents (₹466.0 crore) plus other bank balances (₹171.6 crore), added before rounding: Cityfort calculation from the Q2 FY27 results. Lease liabilities of ₹440.3 crore, up from ₹277.5 crore on 31 Mar 2026, are not counted as borrowings.
- Borrowings were ₹1,247.2 crore on 31 Mar 2025 and ₹1,090.5 crore on 31 Mar 2026. ₹400.0 crore of IPO money went to repaying loans by 30 Sep 2026, and the H1 FY27 cash flow shows net repayments of ₹148.2 crore.
- Debt to equity = borrowings ÷ equity of ₹3,456.6 crore (Cityfort calculation). ICRA reaffirmed the long-term bank loan rating at [ICRA]AA+ (Stable) on 7 Apr 2026.
Sources (5)
- Unaudited standalone and consolidated financial results, quarter and half year ended 30 Sep 2026 (Q2 FY27), with statement of assets and liabilities, cash flow, limited review reports and board outcome
- Integrated filing (financials) XBRL, consolidated, quarter and half year ended 30 Sep 2026
- Annual Report FY26 (2025-26), incl. audited consolidated financial statements
- Red Herring Prospectus dated 17 Jul 2026 (restated consolidated financial information FY24-FY26, Our Business, risk factors, capital structure, litigation)
- ICRA rationale: Indo-MIM Limited, rating reaffirmed [ICRA]AA+ (Stable), 7 Apr 2026
18Who owns it
18Who owns it · Q2 FY27
Who owns Indo-MIM?
- Promoters (founders or parent company)77.7%
- Foreign institutions (FII)2.5%
- Indian institutions (DII)11.8%
- Public and others8.1%
Promoter pledge
No promoter shares were pledged in Q2 FY27.
19What it does with profit
19What it does with profit
What does Indo-MIM do with its profit?
Dividend per share
₹6.80FY26
Dividend paid for each share, by financial year.
₹ per share
See the numbers
Money raised · 30 Jul 2026
IPO at ₹485 a share (₹440 for 200,000 employee shares); listed on 30 Jul 2026. New shares raised ₹500.0 crore for the company, to repay ₹400 crore of loans and for general purposes. Existing holders sold ₹3,312.1 crore of shares, including 60,524,322 shares by Green Meadows Investments. By 30 Sep 2026, ₹475.9 crore had been used, and the monitoring agency CARE Ratings reported no deviation.
₹500 cr
Sources (5)
- Annual Report FY26 (2025-26), incl. audited consolidated financial statements
- Unaudited standalone and consolidated financial results, quarter ended 30 Jun 2026 (Q1 FY27), with limited review reports and board outcome
- Red Herring Prospectus dated 17 Jul 2026 (restated consolidated financial information FY24-FY26, Our Business, risk factors, capital structure, litigation)
- Unaudited standalone and consolidated financial results, quarter and half year ended 30 Sep 2026 (Q2 FY27), with statement of assets and liabilities, cash flow, limited review reports and board outcome
- Monitoring agency report (CARE Ratings) on use of IPO proceeds, quarter ended 30 Sep 2026
20Governance signals
20Governance signals
What do Indo-MIM's governance filings show?
- Auditor
- Suri & Co., Chartered Accountants
- Auditor changes
- None in the period covered
- Audit qualifications
- None reported
- Related-party dealings
- All related-party transactions together came to ₹255.2 crore in FY26, 6.09% of revenue, against 8.13% in FY24, the prospectus says. The two executive promoters were paid ₹95.6 crore in FY26, 17.9% of net profit (Cityfort calculation), and their approved salaries rise 10% a year to Mar 2029.
- Credit rating
- ICRA [ICRA]AA+ (long-term term loans and cash credit, reaffirmed) (outlook Stable), 7 Apr 2026
A credit rating describes the company's ability to repay debt. It is not a rating of the share.
Flags to know about
related party
Promoter pay and payouts
The chairman and the CEO, both promoters, were paid ₹95.6 crore in FY26. ICRA said on 7 Apr 2026 that borrowings rose nearly 100% between FY22 and FY25, largely because of high dividends, high promoter and director pay, and more working capital.
regulatory · 16 Oct 2026
Public shareholding of 22.35%, under 25%
Public shareholders held 22.35% at listing and on 30 Sep 2026, below the 25% minimum for listed companies. The company says it will comply within the timelines specified.
regulatory
Cost-audit show-cause notices
The prospectus discloses show-cause notices from the Ministry of Corporate Affairs, dated 14 Aug 2024 and 17 Oct 2024, alleging the company failed to appoint a cost auditor for FY22–FY24. The company replied that it was exempt because exports exceeded 75% of turnover; the matters were pending.
other
Chairman's past disqualification as a director
The prospectus discloses that Krishna Chivukula was listed as a disqualified director from 1 Nov 2016 to 31 Oct 2021, linked to a company struck off in 2017. His director number was reactivated under 2018 High Court orders, and he is not disqualified now, it says.
auditor
Restated older years
FY24 is restated from special-purpose statements with material adjustments to the audited statutory accounts, and the FY24 and FY25 audit reports carry an emphasis of matter on restated opening balances, the prospectus says. The FY26 audit report has no qualification.
disclosure
Three FY26 quarters were not reviewed
Q3 FY26 is in no filing. The Q1, Q2 and Q4 FY26 figures were neither audited nor reviewed by the auditor; Q2 FY26 is headed "Audited" in the results, but the auditor calls it a balancing figure.
surveillance · 24 Sep 2026
Exchange query on the share price
BSE and NSE asked the company about a movement in its share price on 23 Sep 2026. The company replied on 24 Sep 2026 that the movement seemed market driven.
Sources (8)
- Red Herring Prospectus dated 17 Jul 2026 (restated consolidated financial information FY24-FY26, Our Business, risk factors, capital structure, litigation)
- Annual Report FY26 (2025-26), incl. audited consolidated financial statements
- ICRA rationale: Indo-MIM Limited, rating reaffirmed [ICRA]AA+ (Stable), 7 Apr 2026
- Shareholding pattern as of 30 Sep 2026 (XBRL)
- Shareholding pattern as of 30 Jul 2026 (listing; revised 5 Aug 2026 to add Anuradha Koduri to the promoter group) (XBRL)
- Unaudited standalone and consolidated financial results, quarter ended 30 Jun 2026 (Q1 FY27), with limited review reports and board outcome
- Unaudited standalone and consolidated financial results, quarter and half year ended 30 Sep 2026 (Q2 FY27), with statement of assets and liabilities, cash flow, limited review reports and board outcome
- Clarification on price movement (reply to BSE/NSE surveillance query of 23 Sep 2026)
21What the market paid
21What the market paid · price as of 13 Nov 2026
What did the market pay for Indo-MIM on 13 Nov 2026?
Price as of 13 Nov 2026 (shown for education; prices change daily).
Price as of 13 Nov 2026: ₹1,276.40, the NSE closing price, before the Q2 FY27 results were filed that night. Market value as of 13 Nov 2026 was ₹63,116 crore (Cityfort calculation: price × 494,480,907 shares). P/E as of 13 Nov 2026 was 90.3: market value ÷ ₹698.8 crore of net profit for the 12 months to Sep 2026 (FY26 minus H1 FY26 plus H1 FY27). On FY26 earnings per share of ₹11.06 it was 115.4. P/E is the rupees paid for each rupee of a year's profit. P/B as of 13 Nov 2026 was 18.3: market value ÷ equity of ₹3,456.6 crore on 30 Sep 2026 (Cityfort calculations).
- Share price
- ₹1,276.40
- Market value (market cap)
- ₹63,116 cr
- P/E
- 90.3×
- P/B
- 18.3×
Source: NSE bhavcopy (sec_bhavdata_full), 13 Nov 2026: INDOMIM EQ close Rs 1,276.40; Shareholding pattern as of 30 Sep 2026 (XBRL); Annual Report FY26 (2025-26), incl. audited consolidated financial statements and 1 more
Sources (4)
- NSE bhavcopy (sec_bhavdata_full), 13 Nov 2026: INDOMIM EQ close Rs 1,276.40
- Shareholding pattern as of 30 Sep 2026 (XBRL)
- Annual Report FY26 (2025-26), incl. audited consolidated financial statements
- Unaudited standalone and consolidated financial results, quarter and half year ended 30 Sep 2026 (Q2 FY27), with statement of assets and liabilities, cash flow, limited review reports and board outcome
22How it got here
22How it got here
How did Indo-MIM get here?
1996
Milestone
Incorporated
Incorporated in 1996 as A F Technologies India; renamed Indo-US MIM Tec in 2001 and Indo-MIM in 2016.
2020
Milestone
Triax bought in the US
Bought Triax Industries, a US investment-casting company, for USD 12.50 million in 2020 (FY21).
2023
Milestone
Conway Marsh Garrett bought in the UK
Bought the UK MIM and 3D printing company for £10.53 million under a 27 Jun 2023 agreement.
2025
Crisis
Write-downs on the overseas buys
Impairments on Triax and Conway Marsh Garrett cost ₹115.2 crore in FY25 and ₹78.0 crore in FY26.
2025
Milestone
Medical device designer bought
Bought Phoenix DeVentures II, a US medical device design company, under a 19 Mar 2025 agreement.
2026
Business-model change
Listed on NSE and BSE
Listed on 30 Jul 2026 after a ₹3,812.1 crore IPO at ₹485 a share; ₹400 crore of the new money repaid loans.
Sources (4)
- Red Herring Prospectus dated 17 Jul 2026 (restated consolidated financial information FY24-FY26, Our Business, risk factors, capital structure, litigation)
- Annual Report FY26 (2025-26), incl. audited consolidated financial statements
- NSE circular NSE/CML/75442: listing of equity shares of INDO-MIM Limited (IPO), symbol INDOMIM, ISIN INE084101034
- Unaudited standalone and consolidated financial results, quarter and half year ended 30 Sep 2026 (Q2 FY27), with statement of assets and liabilities, cash flow, limited review reports and board outcome
23Sources and changes
Where every number on this page comes from
Sources (15 documents)
- S1Red Herring Prospectus dated 17 Jul 2026 (restated consolidated financial information FY24-FY26, Our Business, risk factors, capital structure, litigation) · SEBI (Public Issues, filed by the company) · Tier 1: company or exchange filing · 17 Jul 2026
- S2Annual Report FY26 (2025-26), incl. audited consolidated financial statements · NSE (company filing, nsearchives.nseindia.com) · Tier 1: company or exchange filing · 29 Aug 2026
- S3Unaudited standalone and consolidated financial results, quarter ended 30 Jun 2026 (Q1 FY27), with limited review reports and board outcome · NSE (company filing, nsearchives.nseindia.com) · Tier 1: company or exchange filing · 17 Aug 2026
- S4Integrated filing (financials) XBRL, consolidated, quarter ended 30 Jun 2026 · NSE (company filing, nsearchives.nseindia.com) · Tier 1: company or exchange filing · 17 Aug 2026
- S5Shareholding pattern as of 30 Sep 2026 (XBRL) · NSE (company filing, nsearchives.nseindia.com) · Tier 1: company or exchange filing · 16 Oct 2026
- S6Shareholding pattern as of 30 Jul 2026 (listing; revised 5 Aug 2026 to add Anuradha Koduri to the promoter group) (XBRL) · NSE (company filing, nsearchives.nseindia.com) · Tier 1: company or exchange filing · 5 Aug 2026
- S7ICRA rationale: Indo-MIM Limited, rating reaffirmed [ICRA]AA+ (Stable), 7 Apr 2026 · ICRA (copy hosted on the company website) · Tier 2: rating agency or regulator · 7 Apr 2026
- S8NSE circular NSE/CML/75442: listing of equity shares of INDO-MIM Limited (IPO), symbol INDOMIM, ISIN INE084101034 · NSE (nsearchives.nseindia.com) · Tier 1: company or exchange filing · 29 Jul 2026
- S11Outcome of board meeting 14 Oct 2026: wholly owned subsidiary in Vietnam (Rs 45 crore over 5 years), re-appointment of three independent directors · NSE (company filing, nsearchives.nseindia.com) · Tier 1: company or exchange filing · 14 Oct 2026
- S13Intimation of earnings conference call on 16 Nov 2026, 15:00 IST, for the quarter and half year ended 30 Sep 2026 · NSE (company filing, nsearchives.nseindia.com) · Tier 1: company or exchange filing · 11 Nov 2026
- S14Clarification on price movement (reply to BSE/NSE surveillance query of 23 Sep 2026) · NSE (company filing, nsearchives.nseindia.com) · Tier 1: company or exchange filing · 24 Sep 2026
- S15Unaudited standalone and consolidated financial results, quarter and half year ended 30 Sep 2026 (Q2 FY27), with statement of assets and liabilities, cash flow, limited review reports and board outcome · NSE (company filing, nsearchives.nseindia.com) · Tier 1: company or exchange filing · 13 Nov 2026
- S16Integrated filing (financials) XBRL, consolidated, quarter and half year ended 30 Sep 2026 · NSE (company filing, nsearchives.nseindia.com) · Tier 1: company or exchange filing · 13 Nov 2026
- S17Monitoring agency report (CARE Ratings) on use of IPO proceeds, quarter ended 30 Sep 2026 · NSE (company filing, nsearchives.nseindia.com) · Tier 1: company or exchange filing · 13 Nov 2026
- S18NSE bhavcopy (sec_bhavdata_full), 13 Nov 2026: INDOMIM EQ close Rs 1,276.40 · NSE (nsearchives.nseindia.com) · Tier 1: company or exchange filing · 13 Nov 2026
Changes to this page (v2 · 17 Nov 2026)
- v2 · 17 Nov 2026Reworded the profit-source point: the ₹992.9 crore EBITDA is shown rounded in the table, so the point no longer repeats it. (editorial update, Q2 FY27)
- v1 · 16 Nov 2026First version. (first version)
Numbers come only from tier 1 and tier 2 sources. Read how we research.
Disclaimer
For learning only. Cityfort is not a SEBI-registered adviser and does not recommend buying or selling any security. Prices shown are dated and may be out of date.
Investing in securities involves risk, including loss of capital. Before making any investment decision, do your own research and consider consulting a SEBI-registered investment adviser.
Cityfort, its owners and contributors may or may not hold securities of companies covered. Content is not an offer or solicitation to buy or sell any security.
Read the full disclaimerHide the full disclaimer
Cityfort publishes educational content that explains how listed companies work. Cityfort is not registered with the Securities and Exchange Board of India (SEBI) as an Investment Adviser or Research Analyst and does not provide investment advice, recommendations, ratings, price targets or any opinion on whether to buy, sell or hold any security.
All information is taken from publicly available sources, mainly company filings on BSE and NSE, which are listed on each page with dates. We work to keep it accurate and correct errors publicly, but we do not guarantee that it is complete, accurate or up to date. Any market price or price-based ratio shown is dated, may be out of date by the time you read it, and is included only to explain concepts.
Statements by company management are reported as statements, with their date and source; they are not our forecasts.