Capital Goods · NSE: SUZLON · BSE: 532667
Suzlon: how the business works
Suzlon Energy makes, installs and maintains wind turbines in India, and earned ₹16,679 crore of revenue in FY26.
Follow Suzlon
Email me when Suzlon's page is updated after results.
We store your email address with Kit, our email provider, which also records when you sign up and whether you open or click our emails. We send a confirmation email first. See our privacy policy.
Suzlon Energy Limited · Pune, Maharashtra (registered office: Ahmedabad, Gujarat) · Founded 1995
Updated for Q2 FY27 · checked
- Revenue, FY26
- ₹16,679 cr
- Profit, FY26 (incl. ₹749 cr deferred-tax credit)
- ₹3,163 cr
- Turbines delivered, FY26
- 2,456 MW
- Incorporated
- 1995
- Promoter holding, Sep 2026 (none pledged)
- 11.70%
The short version
Suzlon in 5 points
1 · What it sells
Suzlon makes, installs and maintains wind turbines, delivered 2,456 MW of them in FY26 and reported FY26 revenue from operations of ₹16,679 crore.
2 · Who pays it
Suzlon does not split revenue by customer, but its 6,009 MW order book at 30 Sep 2026 was 64% companies and retail buyers wanting their own power, 22% auction winners and 14% government-owned companies.
3 · What it keeps from ₹100
Of every ₹100 that came in during FY26, Suzlon kept ₹18.7 as profit, ₹4.4 of it from a net tax credit, and profit before tax without a ₹70 crore one-off gain was ₹13.9.
4 · Where the operating profit comes from
Wind turbines earned ₹1,854 crore, or 68.6%, of Suzlon's ₹2,704 crore FY26 segment profit before interest and tax, and maintenance ₹759 crore, or 28.1%.
5 · The one thing to watch
EBITDA was ₹14.8 of every ₹100 of revenue in Q2 FY27 against ₹18.6 in Q2 FY26, and management said on 29 Oct 2026 that FY27 could be about 15%.
Sources: From Suzlon's FY26 annual report, its Q2 FY27 results and earnings call, and the Sep 2026 shareholding pattern · checked
Sources (6)
- Annual Report FY26 (2025-26), corrected version filed 21 Aug 2026, incl. consolidated financial statements and BRSR
- Q2 FY27 outcome: unaudited standalone and consolidated results (quarter and half year to 30 Sep 2026), press release and investor presentation
- Integrated filing (financials) XBRL, consolidated, Q4 FY26 and FY26
- Integrated filing (financials) XBRL, consolidated, Q2 FY27
- Integrated filing (financials) XBRL, consolidated, Q2 FY26
- Q2 FY27 earnings call transcript (call held 29 Oct 2026)
01Where the money goes · FY26
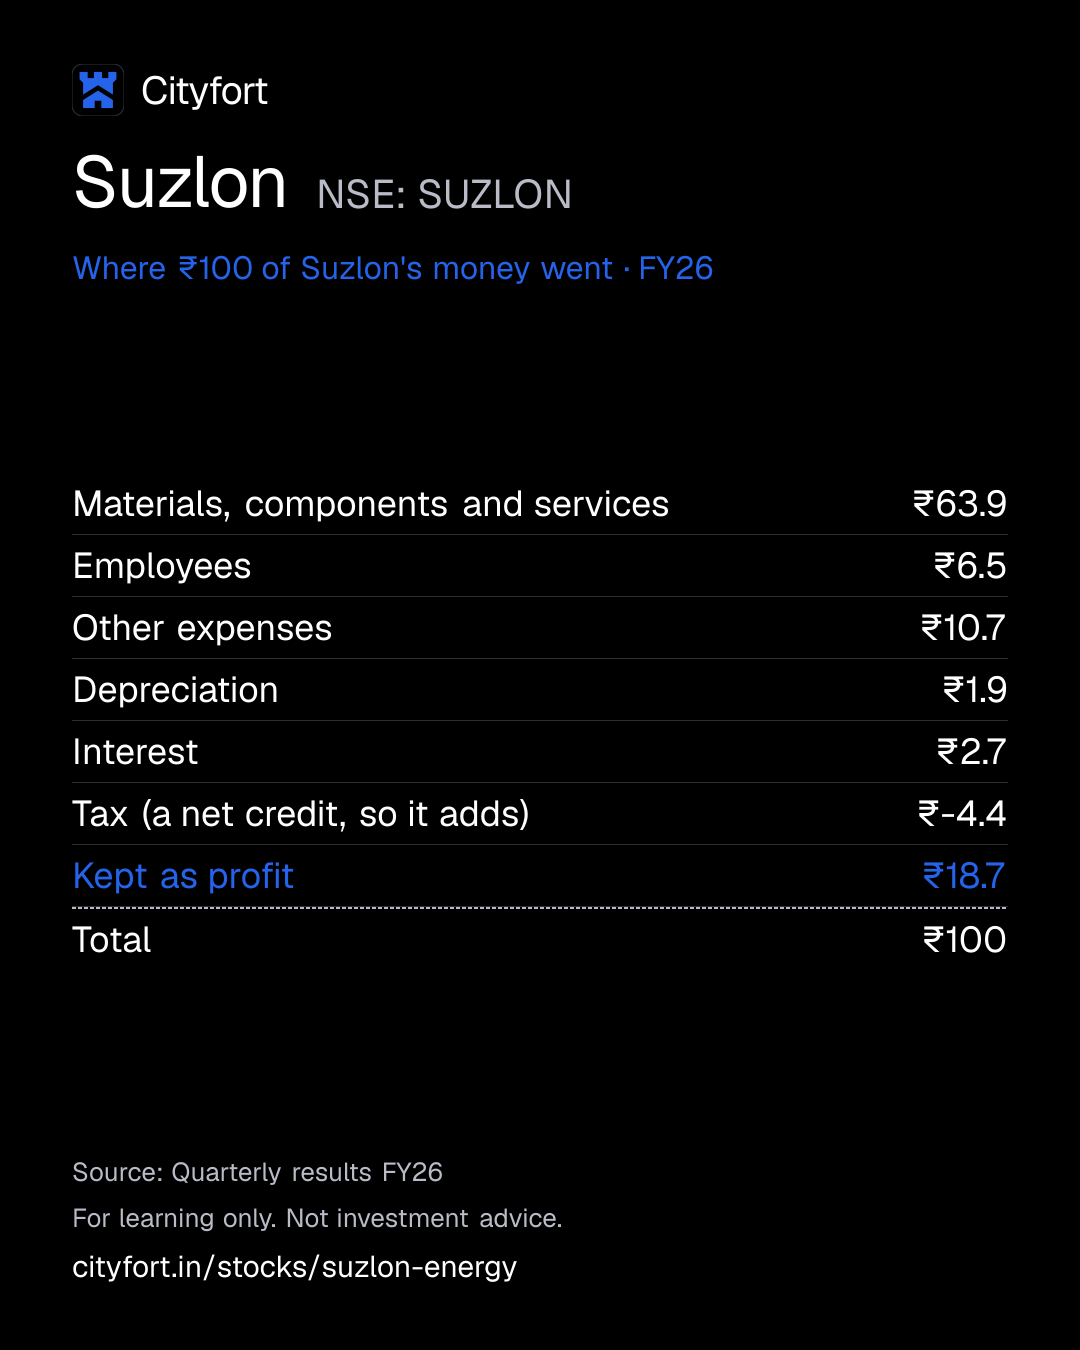
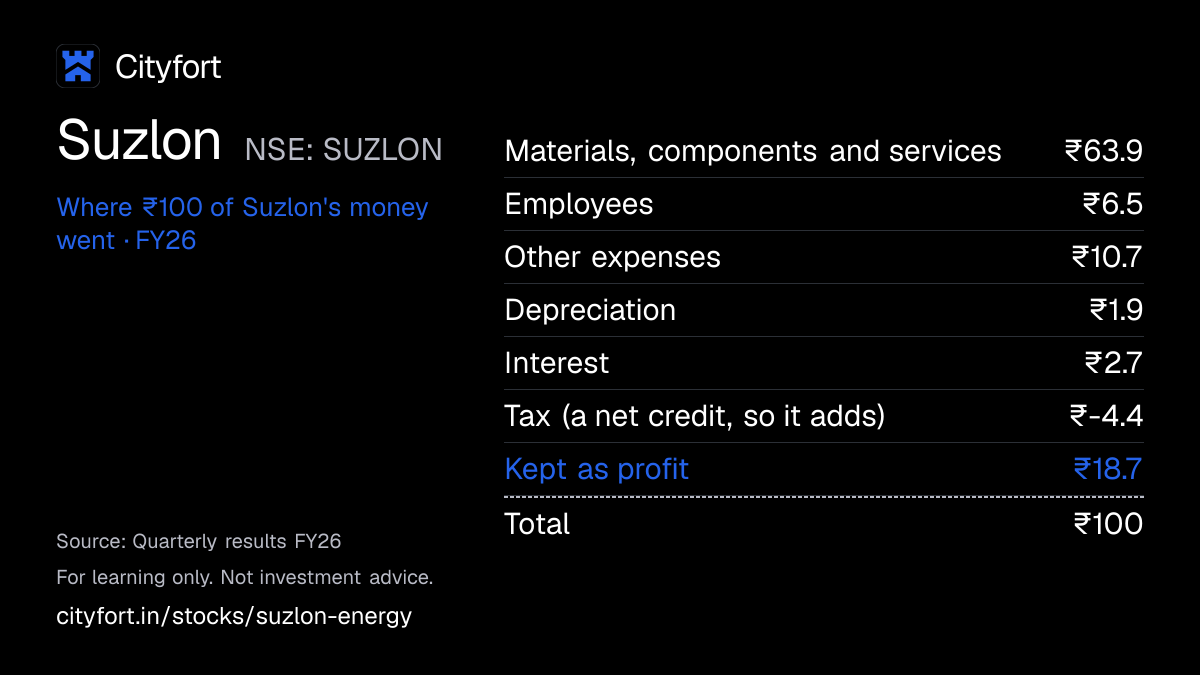
Where does ₹100 of Suzlon's money go?
Suzlon · FY26
Receipt for every ₹100
| Materials, components and services | ₹63.9 |
|---|---|
| Employees | ₹6.5 |
| Other expenses | ₹10.7 |
| Depreciation | ₹1.9 |
| Interest | ₹2.7 |
| Tax (a net credit, so it adds) | ₹-4.4 |
| Kept as profit | ₹18.7 |
| Total | ₹100 |
Each line = amount ÷ total money in × 100. Lines may not add to exactly ₹100 because of rounding.
How this is worked out
Cityfort calculation from the FY26 consolidated profit and loss statement: each line ÷ total money in (₹16,912 crore of revenue, other operating income, finance income and a ₹70 crore one-off gain) × 100. Tax is negative because of a ₹742 crore net tax credit. Profit before tax was ₹14.3 of every ₹100, and ₹13.9 without the one-off gain.
Save this receipt as an image
Embed this receipt or the key numbers
Paste this code into a blog or website to show the card you choose, with a link back to this page.
Each week: the next company due to report results, explained in 5 points.
We'll email you once a week with what changed on Cityfort. Facts only, no tips. Unsubscribe any time.
We store your email address with Kit, our email provider, which also records when you sign up and whether you open or click our emails. We send a confirmation email first. See our privacy policy.
02The business in one line
What does Suzlon do?
Wind-farm developers pay Suzlon to make and install turbines, then to maintain them; most of the money goes on components and materials, and what's left is profit.
- In FY26 turbines brought ₹14,040 crore of segment revenue and maintenance ₹2,484 crore, before sales between segments are removed.
- Materials and components took ₹63.9 of every ₹100 that came in during FY26; ₹18.7 was kept as profit, helped by a net tax credit.
03Who pays it
Who pays Suzlon?
Suzlon does not disclose how much each type of customer pays.
Companies buying power for their own use, and retail buyers
Commercial and industrial firms, captive users and retail buyers were 64% of the wind order book at 30 Sep 2026. Revenue by customer type is not disclosed.
Power producers that win government auctions
Buyers who won central and state government power auctions were 22% of the order book at 30 Sep 2026.
Government-owned companies (PSUs)
Were 14% of the order book at 30 Sep 2026.
Wind-farm owners needing maintenance
Pay to have turbines run and repaired. The maintenance segment was 14.5% of FY26 segment revenue, before sales between segments are removed.
Machine makers worldwide (SE Forge)
Buy castings and forgings. The segment was 3.5% of FY26 segment revenue.
Where its revenue came from · FY26
- India97.8%
- USA1%
- Europe0.4%
- Other countries0.8%
How spread out the customers are
Suzlon does not disclose how much revenue its largest customers give; Cityfort found no note on single customers in the FY26 annual report. The only split by customer type is for the order book.
Sources (3)
- Q2 FY27 outcome: unaudited standalone and consolidated results (quarter and half year to 30 Sep 2026), press release and investor presentation
- Annual Report FY26 (2025-26), corrected version filed 21 Aug 2026, incl. consolidated financial statements and BRSR
- Integrated filing (financials) XBRL, consolidated, Q4 FY26 and FY26
04How it makes money
How does Suzlon make money?
Turbine making has high fixed costs, so profit depends on how many megawatts Suzlon delivers; maintenance adds steadier income.
Crisil says the turbine business carries high fixed costs, which must be covered by deliveries. Deliveries rose to 2,456 MW in FY26 from 1,550 MW in FY25. Maintenance contracts on the installed fleet bring income each year.
Wind turbine segment profit (before interest and tax) per ₹100 of its revenue, Cityfort calculation
−₹3.7₹13.2
FY22 to FY26
- Wind-farm developers order turbines; the order book was 6,009 MW at 30 Sep 2026.
- Suzlon makes blades, towers and nacelles in 14 Indian plants, with 4,500 MW a year of capacity.
- It delivers and installs them: 2,456 MW in FY26, up 58.5%.
- More megawatts cover the fixed costs: the turbine segment kept ₹13.2 of each ₹100 in FY26, after a loss in FY22.
- New turbines can join the maintenance fleet, which covers 16,000+ MW in India.
- Maintenance in India earned 40.5% of its revenue as EBITDA in FY26, by the company's own measure.
↺ Step 6 feeds back into step 1.
05Business segments · FY26
Which businesses make up Suzlon?
Renewable Energy Solutions (wind turbines)
82%Turbine sales and wind-farm building. Called 'Wind Turbine Generator' until FY26; renamed in Q1 FY27 with no change to its contents or past amounts, the company says. Earned 68.6% of the ₹2,704 crore FY26 segment profit.
Revenue ₹14,040 cr · Operating profit ₹1,854 cr
RE Asset Management Services (maintenance)
14.5%Running and repairing wind farms. Called 'Operation & Maintenance Service' until FY26, renamed in Q1 FY27 on the same basis. Earned 28.1% of FY26 segment profit.
Revenue ₹2,484 cr · Operating profit ₹759 cr
Foundry & Forging
3.5%SE Forge's castings and forgings for wind-turbine and other machine makers.
Revenue ₹596 cr · Operating profit ₹86.3 cr
Others
0.1%Small other activities.
Revenue ₹7.9 cr · Operating profit ₹4.6 cr
How the mix changed
- Renewable Energy Solutions (wind turbines)
- RE Asset Management Services (maintenance)
- Foundry & Forging
- Others
Revenue by segment, FY22 to FY26.
₹ crore
See the numbers
Sources (7)
- Financial results XBRL, consolidated, Q4 FY22 and FY22
- Financial results XBRL, consolidated, Q4 FY23 and FY23
- Financial results XBRL, consolidated, Q4 FY24 and FY24
- Integrated filing (financials) XBRL, consolidated, Q4 FY25 and FY25
- Integrated filing (financials) XBRL, consolidated, Q4 FY26 and FY26
- Q2 FY27 outcome: unaudited standalone and consolidated results (quarter and half year to 30 Sep 2026), press release and investor presentation
- Annual Report FY26 (2025-26), corrected version filed 21 Aug 2026, incl. consolidated financial statements and BRSR
06The numbers · Consolidated · ₹ crore
How has Suzlon done?
Revenue
₹16,679 crFY26
Revenue is the "Revenue from operations" line as printed in the results, without the other operating income printed beside it (₹52.7 crore in FY26); it fell 8.8% in FY23, rose to ₹16,679 crore in FY26, and Q2 FY27's ₹4,869 crore was 26.0% above Q2 FY26.
₹ crore
See the numbers
Net profit
₹3,163 crFY26
Profit includes large one-offs: ₹2,721 crore of exceptional gains, ₹2,397 crore of it from converting lenders' debentures and preference shares at the May 2022 refinancing, in FY23 (94% of that year's ₹2,892 crore profit before tax, Cityfort calculation), and deferred-tax credits that took profit above profit before tax in FY25 (₹639 crore; profit before tax ₹1,447 crore), FY26 (₹749 crore; ₹2,422 crore), Q4 FY25 (₹601 crore; ₹551 crore), Q2 FY26 (₹718 crore; ₹562.5 crore) and Q4 FY26 (₹284 crore; ₹833 crore).
₹ crore
See the numbers
Net profit for every ₹100 of revenue
₹19.0FY26
EBITDA per ₹100 of revenue (Cityfort calculation on reported profit before tax) was ₹59.7 in FY23 with the exceptional gains (₹14.0 without them, Cityfort calculation), ₹18.5 in FY26 with a ₹70 crore settlement gain (₹18.1 without it), and ₹14.8 in Q2 FY27 against ₹18.6 in Q2 FY26.
Net margin: ₹ of net profit per ₹100 of revenue
See the numbers
Free cash flow
₹625 crFY26
Free cash flow (Cityfort calculation: operating cash flow − capex) was ₹625 crore in FY26 and −₹389 crore in H1 FY27, when operating cash flow was −₹199.5 crore and capex ₹189 crore.
₹ crore · cash from operations minus spending on plants and equipment
See the numbers
See all yearly numbers
EBITDA = profit before interest, tax and wear-and-tear of assets. Financial year runs April to March (March year end). Net profit is the share belonging to the company's owners. Total net income differs from net profit to the company's owners: Total profit including minority shareholders of subsidiaries.
Sources (19)
- Annual Report FY23 (2022-23), incl. consolidated financial statements (zip on NSE)
- Financial results XBRL, consolidated, Q4 FY22 and FY22
- Annual Report FY24 (2023-24), incl. consolidated financial statements
- Financial results XBRL, consolidated, Q4 FY23 and FY23
- Annual Report FY25 (2024-25), incl. consolidated financial statements
- Financial results XBRL, consolidated, Q4 FY24 and FY24
- Integrated filing (financials) XBRL, consolidated, Q4 FY25 and FY25
- Annual Report FY26 (2025-26), corrected version filed 21 Aug 2026, incl. consolidated financial statements and BRSR
- Integrated filing (financials) XBRL, consolidated, Q4 FY26 and FY26
- Financial results XBRL, consolidated, Q3 FY25
- Q3 FY26 outcome: unaudited results (quarter and nine months to 31 Dec 2025), press release and investor presentation
- Q4 FY26 outcome: audited results (quarter and year to 31 Mar 2026), press release and investor presentation
- Integrated filing (financials) XBRL, consolidated, Q1 FY26
- Q2 FY27 outcome: unaudited standalone and consolidated results (quarter and half year to 30 Sep 2026), press release and investor presentation
- Integrated filing (financials) XBRL, consolidated, Q2 FY26
- Integrated filing (financials) XBRL, consolidated, Q3 FY26
- Integrated filing (financials) XBRL, consolidated, Q1 FY27
- Q1 FY27 outcome: unaudited results (quarter to 30 Jun 2026), press release and investor presentation
- Integrated filing (financials) XBRL, consolidated, Q2 FY27
07Who runs it
Who runs Suzlon, and did they deliver?
Vinod R. Tanti
Chairman and Managing Director
A promoter director. The founder and earlier chairman, Tulsi R. Tanti, died on 1 Oct 2022.
Girish R. Tanti
Vice Chairman
Vice Chairman, per the FY26 annual report.
Ajay Kapur
Group Chief Executive Officer · since 2026
Appointed from 24 Feb 2026. His predecessor, J. P. Chalasani, moved to the Group Executive Council on the same date.
Rahul Jain
Group Chief Financial Officer · since 2025
Appointed from 15 Dec 2025.
What they said, and what happened
1 partly delivered · 3 too early to tell
Said on 5 Feb 2026
Management said in the Q3 FY26 call (5 Feb 2026) that FY26 would deliver its guidance of "60% Y-o-Y growth across key KPIs".
Partly deliveredWhat happened
FY26 revenue rose 53.7%, deliveries 58.5% and profit before tax 67.4%; the company's own EBITDA rose 62.7%.
Said on 25 May 2026
Management said in the Q4 FY26 call (25 May 2026) that the EPC share of the order book would reach 50% by FY28; it was about 20% in Q2 FY26 and 28% at Q4 FY26.
Too early to tellWhat happened
The EPC share was 38% at 30 Sep 2026.
Said on 28 Jul 2026
Management said in the Q1 FY27 call (28 Jul 2026) that FY27 EBITDA margins could stay within 1–2 points of FY26's 17–18%.
Too early to tellWhat happened
The H1 FY27 margin was 15.1%. In the Q2 FY27 call management said FY27 could be about 15%, possibly 1 point higher.
Said on 28 Jul 2026
Management said in the Q1 FY27 call (28 Jul 2026) that FY27 capex would be about ₹700 crore, give or take ₹100 crore.
Too early to tellWhat happened
Capex was ₹189 crore in H1 FY27.
Sources (8)
- Annual Report FY26 (2025-26), corrected version filed 21 Aug 2026, incl. consolidated financial statements and BRSR
- Annual Report FY23 (2022-23), incl. consolidated financial statements (zip on NSE)
- Q3 FY26 earnings call transcript
- Q2 FY27 outcome: unaudited standalone and consolidated results (quarter and half year to 30 Sep 2026), press release and investor presentation
- Q4 FY26 earnings call transcript
- Q1 FY27 earnings call transcript (call held 28 Jul 2026)
- Q2 FY27 earnings call transcript (call held 29 Oct 2026)
- Integrated filing (financials) XBRL, consolidated, Q2 FY27
08What could go wrong
What could go wrong for Suzlon?
- Pricing
Margins have fallen in FY27 so far
EBITDA was ₹14.8 of every ₹100 of revenue in Q2 FY27, against ₹18.6 in Q2 FY26. Management said the turbine contribution margin fell to 21.2% from 26.9%. In the Q2 FY27 call on 29 Oct 2026 it said FY27 could be about 15%, possibly 1 point higher.
Watch EBITDA per ₹100 of revenue in Q3 and Q4 FY27, against management's statement of about 15%.
- Execution
High fixed costs in turbine making
Crisil says the turbine business has high fixed costs that deliveries must cover, and that the group suffered large operating losses in the past when revenue slowed. In FY22 the turbine segment lost ₹163 crore before interest and tax.
Watch Quarterly deliveries (710 MW in Q2 FY27) and the 1,295 MW erected but not yet commissioned.
- Cash and liquidity
Cash tied up in stock and unpaid bills
Operating cash flow was −₹199.5 crore in H1 FY27. Inventories rose to ₹5,461 crore and trade receivables to ₹7,004 crore at 30 Sep 2026, from ₹4,512 crore and ₹6,487 crore in March. Management linked this to seasonality and preparing for more deliveries in H2.
Watch FY27 operating cash flow, and inventories and receivables at 31 Mar 2027.
- Competition
Competition from Adani, JSW and others
Suzlon's CEO named Adani and JSW among its competitors in the Q2 FY27 call. Crisil describes intense competition from domestic and foreign players. The CEO put Suzlon's H1 FY27 share of orders at 28–29% and of deliveries at about 23%.
Watch Orders won each quarter (1.5+ GW in H1 FY27) and the company's market-share figures.
- Execution
More risk in building whole wind farms
Suzlon is taking more EPC and DevCo orders, where it builds the site or lines up land and grid connections. Crisil says DevCo brings risks around land and connectivity approvals, and the EPC shift keeps operating leverage high. Crisil understands DevCo spending will be kept to about ₹500 crore.
Watch The EPC share of the order book (38% at 30 Sep 2026) and money spent on DevCo land.
- Other
Past profits were lifted by tax credits
Deferred-tax credits, recognised on past tax losses, took profit above profit before tax in FY25 (₹639 crore) and FY26 (₹749 crore). In H1 FY27 deferred tax was a charge of ₹202 crore. Profit was ₹699 crore against ₹1,604 crore a year earlier, while profit before tax was ₹908 crore against ₹1,022 crore.
Watch The deferred tax line each quarter and the deferred tax asset (₹1,192 crore at 30 Sep 2026).
- Demand
Almost all sales are in India
97.8% of FY26 revenue came from India. Orders depend on Indian companies building wind farms and on central and state power auctions, which were 22% of the Sep 2026 order book.
Watch New order announcements and the order book each quarter (6,009 MW at 30 Sep 2026).
- Legal
Penalties and disputes
SEBI imposed a ₹15.95 crore penalty on 29 May 2026; the Securities Appellate Tribunal has stayed it. Customs levied a ₹9.60 crore penalty for alleged short payment of IGST, which Suzlon said it would appeal. Some suppliers have sued Suzlon, and some customers dispute amounts it says they owe.
Watch The tribunal hearing on 28 Jan 2027 and any provision for the supplier and customer disputes.
Sources (10)
- Q2 FY27 earnings call transcript (call held 29 Oct 2026)
- Integrated filing (financials) XBRL, consolidated, Q2 FY27
- Integrated filing (financials) XBRL, consolidated, Q2 FY26
- Crisil Ratings rationale: Suzlon Energy Limited ratings upgraded to Crisil AA-/Stable/Crisil A1+ (bank facilities Rs 5,685 crore)
- Financial results XBRL, consolidated, Q4 FY22 and FY22
- Q2 FY27 outcome: unaudited standalone and consolidated results (quarter and half year to 30 Sep 2026), press release and investor presentation
- Integrated filing (financials) XBRL, consolidated, Q4 FY26 and FY26
- Annual Report FY26 (2025-26), corrected version filed 21 Aug 2026, incl. consolidated financial statements and BRSR
- Annual Report FY25 (2024-25), incl. consolidated financial statements
- Customs penalty of Rs 9.60 crore on Suzlon Global Services (since merged), company to appeal
09Supporters and critics
What do supporters and critics point to?
What supporters point to
- Revenue rose from ₹5,947 crore in FY23 to ₹16,679 crore in FY26, and deliveries rose 58.5% in FY26 to 2,456 MW.
- Borrowings fell from ₹6,391 crore at 31 Mar 2022 to ₹264 crore at 31 Mar 2026, and Crisil upgraded its rating to AA- on 27 Oct 2026.
- The order book was 6,009 MW at 30 Sep 2026, 2.4 times FY26 deliveries (Cityfort calculation: 6,009 MW ÷ 2,456 MW).
- Maintenance in India earned 40.5% of its revenue as EBITDA in FY26, by the company's measure, on a fleet of 16,000+ MW.
- No promoter shares were pledged in any of the 12 quarters to Sep 2026, after 80.77% in Aug 2023.
What critics point to
- EBITDA per ₹100 of revenue fell to ₹14.8 in Q2 FY27 from ₹18.6, and management's FY27 margin statement moved from within 1–2 points of 17–18% (28 Jul 2026 call) to about 15% (29 Oct 2026 call).
- Profit in FY25 and FY26 was lifted by ₹639 crore and ₹749 crore of deferred-tax credits; Q2 FY27 profit was ₹394 crore against ₹1,279 crore.
- Operating cash flow was −₹199.5 crore in H1 FY27, as inventories reached ₹5,461 crore and receivables ₹7,004 crore.
- Crisil cites a past default and restructuring, and says ₹1,207 crore of ₹2,599 crore cash at 30 Jun 2026 was encumbered (Cityfort calculation: ₹2,599 crore − ₹1,392 crore free).
- The promoter group held 11.70% at Sep 2026, after selling 20 crore shares on 9 Jun 2025.
10What to watch next
What should you watch next at Suzlon?
Next event
Q3 FY27 results
Date not announced yet.
Margins in H2 FY27
EBITDA was ₹14.8 of every ₹100 of revenue in Q2 FY27. Management said in the Q2 FY27 call on 29 Oct 2026 that FY27 could be about 15%, possibly 1 point higher.
Turbines waiting to be switched on
1,295 MW was erected but awaiting commissioning after H1 FY27, when 723 MW was commissioned.
SEBI appeal hearing
The next hearing of Suzlon's appeal against SEBI's ₹15.95 crore penalty is on 28 Jan 2027, the company said.
11Key facts
Key facts about Suzlon
- What does Suzlon Energy do?
- Suzlon Energy designs, makes and installs wind turbines in India and maintains wind farms. It delivered 2,456 MW of turbines in FY26 and reported revenue from operations of ₹16,679 crore.
- How does Suzlon Energy make money?
- Suzlon Energy earns most of its money selling wind turbines: that segment had ₹14,040 crore of FY26 revenue, 82.0% of segment revenue before sales between segments. Maintenance brought ₹2,484 crore (14.5%) and castings and forgings ₹596 crore (3.5%).
- Who are Suzlon Energy's customers?
- Suzlon Energy sells to independent power producers, large companies, government-owned firms and retail buyers. At 30 Sep 2026 its wind order book was 64% commercial, industrial, captive and retail buyers, 22% central and state auction winners and 14% government-owned companies.
- How big is Suzlon Energy?
- Suzlon Energy reported FY26 revenue from operations of ₹16,679 crore, up 53.7% from ₹10,851 crore in FY25. FY26 profit was ₹3,163 crore, including a ₹749 crore deferred-tax credit; profit before tax was ₹2,422 crore.
- Who owns Suzlon Energy?
- At 30 Sep 2026 Suzlon Energy's promoter group (which includes Tanti Holdings and Tanti family trusts) held 11.70%, with no shares pledged. Foreign institutions held 23.63%, Indian institutions 10.25% and individuals and other non-institutional holders 54.42%. Suzlon had 5,599,016 shareholders.
- How much debt does Suzlon Energy have?
- On 31 Mar 2026 Suzlon Energy had borrowings of ₹264 crore and cash, bank balances and current investments of ₹1,462 crore, net cash of ₹1,198 crore by Cityfort's calculation. Borrowings were ₹6,391 crore on 31 Mar 2022.
- Why was Suzlon Energy's FY26 profit higher than its profit before tax?
- Suzlon Energy's FY26 profit of ₹3,163 crore was above its profit before tax of ₹2,422 crore because of a ₹749 crore deferred-tax credit, recognised on assessed past tax losses and unabsorbed depreciation. FY25 had a ₹639 crore credit of the same kind.
- What happened to Suzlon Energy's debt in 2022 and 2023?
- In May 2022 Suzlon Energy refinanced its loans with REC and IREDA. FY23 had ₹2,721 crore of exceptional gains, ₹2,397 crore of it from converting lenders' debentures and preference shares into equity. After a ₹2,000 crore share sale to institutions in Aug 2023, the REC-led loan was repaid in full by Sep 2023.
- When was Suzlon Energy founded and where is it based?
- Suzlon Energy Limited was incorporated in 1995, according to its FY26 annual report. Its registered office is in Ahmedabad, Gujarat, its corporate base is in Pune, and it had 14 manufacturing plants in India in FY26.
Sources (8)
- Annual Report FY26 (2025-26), corrected version filed 21 Aug 2026, incl. consolidated financial statements and BRSR
- Q2 FY27 outcome: unaudited standalone and consolidated results (quarter and half year to 30 Sep 2026), press release and investor presentation
- Integrated filing (financials) XBRL, consolidated, Q4 FY26 and FY26
- Shareholding pattern (XBRL) as of 30 Sep 2026
- SAST Reg 29(2) disclosures: promoter-group open-market sale of 20,00,00,000 shares on 9 Jun 2025 (NSE SAST list)
- Annual Report FY23 (2022-23), incl. consolidated financial statements (zip on NSE)
- Annual Report FY25 (2024-25), incl. consolidated financial statements
- Annual Report FY24 (2023-24), incl. consolidated financial statements
Terms on this page
- Capital expenditure (capex)
- Credit rating
- EBITDA
- FII and DII holding
- Free cash flow
- Market capitalisation
- Net debt
- Net profit
- Operating margin
- Promoter holding
Each explains the term in plain English, with the same number from other companies on Cityfort.
Go deeper
More detail from the same filings. Open any section.
12What it sells
12What it sells
What does Suzlon sell?
Wind turbines (Renewable Energy Solutions)
Turbines of about 2 to 5 MW each, mainly the S144, which was 89% of the 30 Sep 2026 order book. Sales of equipment and spares were ₹12,857 crore in FY26.
Building whole wind farms (EPC)
For some orders Suzlon also does the engineering, procurement and construction (EPC): foundations, site work and lines to the grid. Project execution brought ₹1,123 crore in FY26. EPC orders were 38% of the order book at 30 Sep 2026.
Maintenance (RE Asset Management Services)
Contracts to run and repair turbines after they are installed. In India Suzlon looks after 16,000+ MW, over 9,600 turbines, for 1,900+ customers. O&M service revenue was ₹2,231 crore in FY26.
Renom: maintenance of other brands
Renom Energy Services, in which Suzlon bought 51% on 6 Sep 2024, maintains turbines made by several companies.
Castings and forgings (SE Forge)
Heavy metal parts for makers of wind turbines, power equipment, oil and gas and other machines. SE Forge exported 28.79% of its turnover in FY26; the segment's revenue was ₹596 crore.
Think of it like this
Like a lift company: it sells and installs the machine once, then earns fees for years to keep it running.
What it does
- Does: Designs and makes wind turbines in its own plants in India
- Does: Installs turbines and, for some orders, builds the whole wind farm
- Does: Maintains turbines for years after installation, including other brands through Renom
- Does: Makes castings and forgings through SE Forge
What it does not do
- Does not: It does not mainly sell electricity: its customers own the wind farms and the power
- Does not: It sells little abroad: 97.8% of FY26 revenue came from India
- Does not: It no longer carries large loans: borrowings were ₹264 crore at 31 Mar 2026
- Does not: It did not pay a dividend for FY26
Sources (4)
- Annual Report FY26 (2025-26), corrected version filed 21 Aug 2026, incl. consolidated financial statements and BRSR
- Q2 FY27 outcome: unaudited standalone and consolidated results (quarter and half year to 30 Sep 2026), press release and investor presentation
- Completion of acquisition of 51% of Renom Energy Services Private Limited
- Integrated filing (financials) XBRL, consolidated, Q4 FY26 and FY26
13How the money flows
13How the money flows · FY26
How does money flow through Suzlon?
Money in
- Revenue from operations₹16,679 cr
- Other operating income₹52.7 cr
- One-off gain: settlement with a large customer₹70 cr
- Finance income (other income)₹110 cr
The company
Suzlon
₹16,912 cr came in
Money out
- Materials, components and services (net of a ₹631 crore stock build-up)₹10,803 cr
- Employees₹1,100 cr
- Other expenses₹1,806 cr
- Depreciation (wear and tear of assets)₹318 cr
- Interest₹462 cr
- Tax (a net credit of ₹742 crore, so it adds)−₹742 cr
- Net profit for shareholders₹3,163 cr
- In FY26 revenue from operations was ₹16,679 crore, plus ₹52.7 crore of other operating income.
- Finance income added ₹110 crore, and a settlement with a large customer a one-off ₹70 crore.
- Materials, components and services took ₹10,803 crore, after a ₹631 crore build-up in stock.
- Other expenses took ₹1,806 crore, employees ₹1,100 crore, interest ₹462 crore and depreciation ₹318 crore.
- Profit before tax was ₹2,422 crore; a ₹742 crore net tax credit took profit to ₹3,163 crore.
14What it needs to run
14What it needs to run
What does Suzlon need to run?
Factories
14 manufacturing plants in India and 4,500 MW a year of turbine-making capacity, including three 'smart factories' in Gujarat, Karnataka and Tamil Nadu.
People
8,301 permanent employees at 31 Mar 2026. Employee costs were ₹1,100 crore in FY26.
Its own turbine designs
Four R&D centres, with design work in Germany, Denmark, the Netherlands and India. The first S175 turbine (5 MW class) was installed in May 2026.
Windy land and grid connections
Turbines go where the wind is: Karnataka was 29%, Gujarat 20% and Andhra Pradesh 19% of the Sep 2026 order book. In DevCo projects Suzlon lines up the land and grid connection itself.
Bank guarantees
Turbine buyers ask for bank guarantees and letters of credit. Crisil rates ₹5,685 crore of such bank limits for Suzlon.
Sources (3)
- Annual Report FY26 (2025-26), corrected version filed 21 Aug 2026, incl. consolidated financial statements and BRSR
- Q2 FY27 outcome: unaudited standalone and consolidated results (quarter and half year to 30 Sep 2026), press release and investor presentation
- Crisil Ratings rationale: Suzlon Energy Limited ratings upgraded to Crisil AA-/Stable/Crisil A1+ (bank facilities Rs 5,685 crore)
15Where it sells
15Where it sells · FY26
Where does Suzlon sell?
- India97.8%
- USA1%
- Europe0.4%
- Other countries0.8%
16Competitors and what protects it
16Competitors and what protects it
Who does Suzlon compete with?
Adani (wind turbine business)
Named as a competitor by Suzlon's CEO in the Q2 FY27 call. He said a large part of these groups' turbine output goes to their own captive power platforms.
JSW (wind turbine business)
Named as a competitor by Suzlon's CEO in the same call, with the same remark about captive use.
What protects the business
Each strength is scored 1 (weak) to 5 (strong) for the business, with the reason. It is not a rating of the share.
- Scale and market share4 of 5
Crisil puts Suzlon's cumulative Indian wind share at about 28%. It has 4,500 MW a year of capacity and says it has installed 22+ GW worldwide.
- Installed fleet to maintain4 of 5
It maintains 16,000+ MW in India for 1,900+ customers. Crisil says this income is contractual, with price increases built into the contracts.
- Order book3 of 5
The 6,009 MW order book at 30 Sep 2026 was 2.4 times FY26 deliveries (Cityfort calculation: 6,009 MW ÷ 2,456 MW). Crisil says its order book gives revenue visibility for 2–3 years.
- Own turbine designs3 of 5
Suzlon designs its own turbines, with R&D in Europe and India. The company says the S144 has drawn nearly 9,000 MW of cumulative orders.
Weak spot
High fixed costs in a contested market
Crisil says high fixed costs leave the turbine business exposed to losses if offtake slows, as happened in the past, and it cites intense competition. The turbine segment lost ₹163 crore before interest and tax in FY22.
Sources (5)
- Q2 FY27 earnings call transcript (call held 29 Oct 2026)
- Crisil Ratings rationale: Suzlon Energy Limited ratings upgraded to Crisil AA-/Stable/Crisil A1+ (bank facilities Rs 5,685 crore)
- Annual Report FY26 (2025-26), corrected version filed 21 Aug 2026, incl. consolidated financial statements and BRSR
- Q2 FY27 outcome: unaudited standalone and consolidated results (quarter and half year to 30 Sep 2026), press release and investor presentation
- Financial results XBRL, consolidated, Q4 FY22 and FY22
17Where growth could come from
17Where growth could come from
Where could Suzlon's growth come from?
Management said in the Q2 FY27 call (29 Oct 2026) that the FY27 EBITDA margin could be about 15%, possibly 1 point higher. In the Q1 FY27 call (28 Jul 2026) it had said margins could stay within 1–2 points of FY26's 17–18%. On 3 Jun 2026 the company said it aims, by FY31, for 10 GW of yearly sales, a 15 GW order book and about 40% of India's wind market.
Turbine deliveries
Working2,456 MW in FY26, +58.5%
Deliveries were 1,217 MW in H1 FY27, 21% more than the 1,009 MW of H1 FY26. Q2 FY27 deliveries were 710 MW, against 565 MW a year earlier.
Status: Working, on track against what the company said.
Order book
Working6,009 MW at 30 Sep 2026
Up from 5,025 MW at 31 Mar 2025 and 2,929 MW at 31 Mar 2024. Orders won in H1 FY27 were 1.5+ GW.
Status: Working, on track against what the company said.
Building whole wind farms (EPC and DevCo)
WorkingEPC 38% of the order book, Sep 2026
Management said in the Q4 FY26 call (25 May 2026) that the EPC share would reach 50% by FY28. DevCo-led orders, where Suzlon also lines up land and grid connections, were 1.1+ GW of the 1.5+ GW won in H1 FY27.
Status: Working, on track against what the company said.
Maintenance and Renom
Working₹640 crore segment revenue, Q2 FY27
Against ₹575 crore in Q2 FY26. The company's India maintenance EBITDA margin was 43.4% in H1 FY27. Renom also maintains other makers' turbines.
Status: Working, on track against what the company said.
Exports and bigger turbines
NewFirst S175 installed, May 2026
The company said on 3 Jun 2026 that it aims for 3 GW of export order intake by FY31. In FY26, 2.2% of revenue came from outside India.
Status: New, recently announced.
Margins
BehindEBITDA 14.8% of revenue, Q2 FY27
Against 18.6% in Q2 FY26. Management said the turbine contribution margin fell to 21.2% from 26.9% "primarily due to segment customer and scope mix changes, and additionally, forex and commodity volatility".
Status: Behind, behind the company's own plan.
Status compares progress with what the company itself said it would do: Working = on track against what the company said; Mixed = partly on track; Behind = behind the company's own plan; New = recently announced; Early = too early to judge.
Sources (8)
- Q2 FY27 earnings call transcript (call held 29 Oct 2026)
- Q1 FY27 earnings call transcript (call held 28 Jul 2026)
- Press release: Suzlon reveals growth ambition of 10 GW RE sales and 70 GW AUM by FY31 (Suzlon 2.0)
- Q2 FY27 outcome: unaudited standalone and consolidated results (quarter and half year to 30 Sep 2026), press release and investor presentation
- Q4 FY26 earnings call transcript
- Integrated filing (financials) XBRL, consolidated, Q2 FY27
- Integrated filing (financials) XBRL, consolidated, Q2 FY26
- Annual Report FY26 (2025-26), corrected version filed 21 Aug 2026, incl. consolidated financial statements and BRSR
18Financial strength and debt
18Financial strength · 31 Mar 2026
How much debt does Suzlon have?
- Total debt₹264 cr
- Cash and investments₹1,462 cr
- Net cash (cash minus debt)₹1,198 cr
- Net worth (shareholders' money)₹9,464 cr
- Debt to equity
- 0.03×
- ₹ of debt for every ₹1 of shareholders' money
- Interest cover
- 12.1×
- how many times operating profit covers interest
- Contingent liabilities
- ₹159 cr
- possible future payments, e.g. disputed claims
- Cityfort calculation: net cash ₹1,198 crore = cash and cash equivalents, other bank balances and current investments (₹1,462 crore) − borrowings (₹264 crore), leaving out lease liabilities.
- The company's own "net cash" was ₹2,384 crore at 31 Mar 2026 and ₹2,048 crore at 30 Sep 2026. Its definition also counts non-current bank balances and mutual funds.
- On 30 Sep 2026 borrowings were ₹327 crore against ₹1,145 crore of cash, bank balances and current investments: net cash of ₹818 crore (Cityfort calculation). Net worth was ₹10,277 crore.
- Crisil said total cash was ₹2,599 crore on 30 Jun 2026, of which ₹1,392 crore was free and the rest encumbered (held as security). Crisil counts borrowings of about ₹689 crore at 31 Mar 2026.
- Lease liabilities (rent owed under leases) were ₹291.8 crore at 31 Mar 2026, up from ₹39.8 crore a year earlier.
- Borrowings were ₹6,391 crore at 31 Mar 2022 and ₹1,905 crore at 31 Mar 2023. Net worth was negative (−₹3,526 crore) at 31 Mar 2022.
- Interest coverage of 12.11 times is the FY26 ratio as reported in the annual report; Crisil's adjusted figure is about 6.2 times.
- Contingent liabilities (claims the group disputes) were ₹159 crore. Income-tax disputes are left out, the group says, because it has carried-forward losses to set off.
Sources (7)
- Annual Report FY26 (2025-26), corrected version filed 21 Aug 2026, incl. consolidated financial statements and BRSR
- Integrated filing (financials) XBRL, consolidated, Q4 FY26 and FY26
- Integrated filing (financials) XBRL, consolidated, Q2 FY27
- Q2 FY27 outcome: unaudited standalone and consolidated results (quarter and half year to 30 Sep 2026), press release and investor presentation
- Crisil Ratings rationale: Suzlon Energy Limited ratings upgraded to Crisil AA-/Stable/Crisil A1+ (bank facilities Rs 5,685 crore)
- Annual Report FY23 (2022-23), incl. consolidated financial statements (zip on NSE)
- Annual Report FY24 (2023-24), incl. consolidated financial statements
19Who owns it
19Who owns it · Q2 FY27
Who owns Suzlon?
- Promoters (founders or parent company)11.7%
- Foreign institutions (FII)23.6%
- Indian institutions (DII)10.3%
- Public and others54.4%
Promoter pledge
No promoter shares were pledged in Q2 FY27.
How ownership changed
* Pledged = share of the promoters' own holding reported as pledged. In older filings this can include shares “otherwise encumbered”; the governance flags say when.
Sources (12)
- Shareholding pattern (XBRL) as of 30 Sep 2026
- Shareholding pattern (XBRL) as of 30 Jun 2026
- Shareholding pattern (XBRL) as of 31 Mar 2026
- Shareholding pattern (XBRL) as of 31 Dec 2025
- Shareholding pattern (XBRL) as of 30 Sep 2025
- Shareholding pattern (XBRL) as of 30 Jun 2025
- Shareholding pattern (XBRL) as of 31 Mar 2025
- Shareholding pattern (XBRL) as of 31 Dec 2024
- Shareholding pattern (XBRL) as of 30 Sep 2024
- Shareholding pattern (XBRL) as of 30 Jun 2024
- Shareholding pattern (XBRL) as of 31 Mar 2024
- Shareholding pattern (XBRL) as of 31 Dec 2023
20What it does with profit
20What it does with profit
What does Suzlon do with its profit?
Money raised · 24 May 2022
At the refinancing, lenders' 410,000 optionally convertible debentures (₹4,099.18 crore) were converted into 57,14,28,572 shares. No cash was raised.
Money raised · 23 Sep 2022
284,214,474 shares were issued on conversion of US dollar bonds at ₹2.49 a share.
Money raised · 31 Oct 2022
Rights issue: 240 crore partly paid shares at ₹5 each (₹2 face value + ₹3 premium), 5 for every 21 held. The final ₹2.50 call was approved on 24 Feb 2023. The FY23 annual report calls it a ₹1,200 crore rights issue.
₹1,200 cr
Money raised · 14 Aug 2023
Qualified institutional placement (QIP: new shares sold to large investors): 1,139,601,139 shares at ₹17.55, 4.83% below the ₹18.44 floor price, for ₹2,000 crore.
₹2,000 cr
21Governance signals
21Governance signals
What do Suzlon's governance filings show?
- Auditor
- Walker Chandiok & Co LLP, since 2022
- Auditor changes
- None in the period covered
- Audit qualifications
- None reported
- Related-party dealings
- The FY26 consolidated note lists transactions with companies where key managers have significant influence (such as Tanti Holdings), the associate, key managers, their relatives and employee funds. The amounts are small next to revenue; the largest figures shown are about ₹40 crore.
- Credit rating
- Crisil AA- (long term), A1+ (short term) (outlook Stable), 27 Oct 2026
A credit rating describes the company's ability to repay debt. It is not a rating of the share.
Flags to know about
pledge · 30 Sep 2023
Promoter shares were pledged until 2023
At 31 Mar 2023 and 14 Aug 2023, 146.09 crore promoter shares, 80.77% of the promoter group's holding, were pledged or encumbered. The FY23 annual report lists a pledge of promoter shares as security for the refinanced loans. The 30 Sep 2023 pattern shows no pledge, and none was reported in the 12 quarters to Sep 2026.
regulatory · 29 May 2026
SEBI penalty of ₹15.95 crore, stayed on appeal
SEBI's order of 29 May 2026 imposed a ₹15.95 crore penalty on Suzlon over certain transactions with its domestic subsidiaries and the disclosure of contingent liabilities for FY14–FY18. The Securities Appellate Tribunal admitted Suzlon's appeal and stayed the order; the next hearing is on 28 Jan 2027. Management says, on external legal advice, that it has a strong case.
regulatory · 19 Feb 2026
Customs penalty of ₹9.60 crore
In an order received on 19 Feb 2026, the Principal Commissioner of Customs, Chennai, levied a ₹9.60 crore penalty on Suzlon Global Services (since merged into Suzlon) for alleged short payment of customs duty under IGST. Suzlon said it would appeal.
other · 24 May 2022
Past default and restructuring
Crisil notes that Suzlon defaulted in the past and was restructured, last in June 2020, then refinanced in May 2022. Its net worth was negative until FY22.
auditor · 25 May 2026
FY26 audit opinion unmodified, with an emphasis of matter
Walker Chandiok & Co LLP gave an unmodified opinion on the FY26 consolidated accounts. It drew attention to the NCLT-approved scheme that set off ₹18,418.43 crore of accumulated losses against reserves.
other · 9 Jun 2025
Promoter group sold 20 crore shares in Jun 2025
On 9 Jun 2025 promoter-group entities, including Tanti Holdings and family trusts, sold 20,00,00,000 shares in the open market. Promoter holding fell from 13.25% (Mar 2025) to 11.74% (Jun 2025), and was 11.70% at Sep 2026.
disclosure
Customer concentration not disclosed
The FY26 annual report gives no share of revenue from the largest customers. Only the order book is split by customer type.
Sources (14)
- Annual Report FY26 (2025-26), corrected version filed 21 Aug 2026, incl. consolidated financial statements and BRSR
- Annual Report FY23 (2022-23), incl. consolidated financial statements (zip on NSE)
- Crisil Ratings rationale: Suzlon Energy Limited ratings upgraded to Crisil AA-/Stable/Crisil A1+ (bank facilities Rs 5,685 crore)
- Intimation of Crisil rating upgrade (AA-/Stable, A1+)
- Shareholding pattern (XBRL) as of 31 Mar 2023
- Shareholding pattern (XBRL) as of 14 Aug 2023 (filed after the QIP allotment)
- Shareholding pattern (XBRL) as of 30 Sep 2023
- Shareholding pattern (XBRL) as of 30 Sep 2026
- Q2 FY27 outcome: unaudited standalone and consolidated results (quarter and half year to 30 Sep 2026), press release and investor presentation
- Customs penalty of Rs 9.60 crore on Suzlon Global Services (since merged), company to appeal
- NCLT order of 29 Apr 2026 sanctioning the Scheme of Arrangement for reclassification of reserves
- SAST Reg 29(2) disclosures: promoter-group open-market sale of 20,00,00,000 shares on 9 Jun 2025 (NSE SAST list)
- Shareholding pattern (XBRL) as of 30 Jun 2025
- Shareholding pattern (XBRL) as of 31 Mar 2025
22What the market paid
22What the market paid · price as of 11 Nov 2026
What did the market pay for Suzlon on 11 Nov 2026?
Price as of 11 Nov 2026 (shown for education; prices change daily).
Price as of 11 Nov 2026: ₹38.88, the NSE closing price. Market value as of 11 Nov 2026 was ₹53,446 crore (price × 1,374.63 crore shares in the Sep 2026 shareholding pattern). P/E (market value ÷ profit of ₹2,259 crore in the four quarters to Sep 2026) was 23.7: the rupees paid for each rupee of a year's profit. That profit includes a ₹284 crore deferred-tax credit and a ₹70 crore one-off gain in Q4 FY26. P/B (market value ÷ net worth of ₹10,277 crore on 30 Sep 2026) was 5.2. All three are Cityfort calculations.
- Share price
- ₹38.88
- Market value (market cap)
- ₹53,446 cr
- P/E
- 23.7×
- P/B
- 5.2×
Source: NSE CM bhavcopy for 11 Nov 2026 (SUZLON EQ close Rs 38.88); Shareholding pattern (XBRL) as of 30 Sep 2026; Integrated filing (financials) XBRL, consolidated, Q2 FY27 and 3 more
Sources (6)
- NSE CM bhavcopy for 11 Nov 2026 (SUZLON EQ close Rs 38.88)
- Shareholding pattern (XBRL) as of 30 Sep 2026
- Integrated filing (financials) XBRL, consolidated, Q2 FY27
- Integrated filing (financials) XBRL, consolidated, Q1 FY27
- Integrated filing (financials) XBRL, consolidated, Q4 FY26 and FY26
- Integrated filing (financials) XBRL, consolidated, Q3 FY26
23How it got here
23How it got here
How did Suzlon get here?
1995
Milestone
Incorporated
Suzlon Energy Limited was incorporated in 1995, per its FY26 annual report, and started its wind business that year.
2020
Crisis
Debt restructured
On 30 Jun 2020 Suzlon signed a restructuring agreement with its lenders. Crisil notes that it had defaulted in the past.
2022
Business-model change
Refinanced with REC and IREDA
On 24 May 2022 two lenders replaced a 16-lender group. FY23 had ₹2,721 crore of exceptional gains, ₹2,397 crore of it from converting lenders' debentures and preference shares into shares.
2022
Milestone
₹1,200 crore rights issue
On 31 Oct 2022 Suzlon allotted 240 crore partly paid shares at ₹5 to existing shareholders. Founder Tulsi R. Tanti had died on 1 Oct 2022.
2023
Business-model change
Share sale and loans repaid
A ₹2,000 crore QIP in Aug 2023 was followed by full repayment of the REC-led loan by Sep 2023. The promoter pledge of 80.77% was gone by 30 Sep 2023.
2024
Milestone
Bought 51% of Renom
On 6 Sep 2024 Suzlon bought 51% of Renom Energy Services, which maintains turbines of several brands.
2025
Milestone
Promoter group sold 20 crore shares
On 9 Jun 2025 promoter-group entities sold 20,00,00,000 shares; promoter holding fell to 11.74%.
2026
Milestone
Old losses set off against reserves
On 29 Apr 2026 the NCLT approved a scheme setting off ₹18,418.43 crore of accumulated losses against reserves, with no effect on profit.
2026
Business-model change
Suzlon 2.0 and renamed segments
On 3 Jun 2026 the company set out FY31 aims, including 10 GW of yearly sales. In Q1 FY27 it renamed its two main segments, with no change to amounts.
2026
Milestone
Crisil upgrade to AA-
On 27 Oct 2026 Crisil upgraded Suzlon's bank-loan ratings to AA-/Stable and A1+. ICRA's table in the 30 Oct 2026 filing shows A+ reaffirmed with outlook Positive.
Sources (14)
- Annual Report FY26 (2025-26), corrected version filed 21 Aug 2026, incl. consolidated financial statements and BRSR
- Crisil Ratings rationale: Suzlon Energy Limited ratings upgraded to Crisil AA-/Stable/Crisil A1+ (bank facilities Rs 5,685 crore)
- Annual Report FY23 (2022-23), incl. consolidated financial statements (zip on NSE)
- Annual Report FY24 (2023-24), incl. consolidated financial statements
- Shareholding pattern (XBRL) as of 30 Sep 2023
- Shareholding pattern (XBRL) as of 14 Aug 2023 (filed after the QIP allotment)
- Completion of acquisition of 51% of Renom Energy Services Private Limited
- SAST Reg 29(2) disclosures: promoter-group open-market sale of 20,00,00,000 shares on 9 Jun 2025 (NSE SAST list)
- Shareholding pattern (XBRL) as of 30 Jun 2025
- NCLT order of 29 Apr 2026 sanctioning the Scheme of Arrangement for reclassification of reserves
- Press release: Suzlon reveals growth ambition of 10 GW RE sales and 70 GW AUM by FY31 (Suzlon 2.0)
- Q2 FY27 outcome: unaudited standalone and consolidated results (quarter and half year to 30 Sep 2026), press release and investor presentation
- Intimation of Crisil rating upgrade (AA-/Stable, A1+)
- Intimation of ICRA rating action (A+ reaffirmed, outlook Positive; A1 reaffirmed; Rs 2,635 crore)
24Sources and changes
Where every number on this page comes from
Sources (47 documents)
- S1Annual Report FY26 (2025-26), corrected version filed 21 Aug 2026, incl. consolidated financial statements and BRSR · NSE (company filing, nsearchives.nseindia.com) · Tier 1: company or exchange filing · 21 Aug 2026
- S2Annual Report FY25 (2024-25), incl. consolidated financial statements · NSE (company filing, nsearchives.nseindia.com) · Tier 1: company or exchange filing · 29 Aug 2025
- S3Annual Report FY24 (2023-24), incl. consolidated financial statements · NSE (company filing, nsearchives.nseindia.com) · Tier 1: company or exchange filing · 14 Aug 2024
- S4Annual Report FY23 (2022-23), incl. consolidated financial statements (zip on NSE) · NSE (company filing, nsearchives.nseindia.com) · Tier 1: company or exchange filing · 1 Sep 2023
- S5Q2 FY27 outcome: unaudited standalone and consolidated results (quarter and half year to 30 Sep 2026), press release and investor presentation · NSE (company filing, nsearchives.nseindia.com) · Tier 1: company or exchange filing · 29 Oct 2026
- S6Q1 FY27 outcome: unaudited results (quarter to 30 Jun 2026), press release and investor presentation · NSE (company filing, nsearchives.nseindia.com) · Tier 1: company or exchange filing · 28 Jul 2026
- S7Q4 FY26 outcome: audited results (quarter and year to 31 Mar 2026), press release and investor presentation · NSE (company filing, nsearchives.nseindia.com) · Tier 1: company or exchange filing · 25 May 2026
- S8Q3 FY26 outcome: unaudited results (quarter and nine months to 31 Dec 2025), press release and investor presentation · NSE (company filing, nsearchives.nseindia.com) · Tier 1: company or exchange filing · 5 Feb 2026
- S9Integrated filing (financials) XBRL, consolidated, Q2 FY27 · NSE (company filing, nsearchives.nseindia.com) · Tier 1: company or exchange filing · 29 Oct 2026
- S10Integrated filing (financials) XBRL, consolidated, Q1 FY27 · NSE (company filing, nsearchives.nseindia.com) · Tier 1: company or exchange filing · 28 Jul 2026
- S11Integrated filing (financials) XBRL, consolidated, Q4 FY26 and FY26 · NSE (company filing, nsearchives.nseindia.com) · Tier 1: company or exchange filing · 25 May 2026
- S12Integrated filing (financials) XBRL, consolidated, Q3 FY26 · NSE (company filing, nsearchives.nseindia.com) · Tier 1: company or exchange filing · 5 Feb 2026
- S13Integrated filing (financials) XBRL, consolidated, Q2 FY26 · NSE (company filing, nsearchives.nseindia.com) · Tier 1: company or exchange filing · 4 Nov 2025
- S14Integrated filing (financials) XBRL, consolidated, Q1 FY26 · NSE (company filing, nsearchives.nseindia.com) · Tier 1: company or exchange filing · 12 Aug 2025
- S15Integrated filing (financials) XBRL, consolidated, Q4 FY25 and FY25 · NSE (company filing, nsearchives.nseindia.com) · Tier 1: company or exchange filing · 29 May 2025
- S16Financial results XBRL, consolidated, Q3 FY25 · NSE (company filing, nsearchives.nseindia.com) · Tier 1: company or exchange filing · 28 Jan 2025
- S17Financial results XBRL, consolidated, Q4 FY24 and FY24 · NSE (company filing, nsearchives.nseindia.com) · Tier 1: company or exchange filing · 24 May 2024
- S18Financial results XBRL, consolidated, Q4 FY23 and FY23 · NSE (company filing, nsearchives.nseindia.com) · Tier 1: company or exchange filing · 30 May 2023
- S19Financial results XBRL, consolidated, Q4 FY22 and FY22 · NSE (company filing, nsearchives.nseindia.com) · Tier 1: company or exchange filing · 25 May 2022
- S20Q2 FY27 earnings call transcript (call held 29 Oct 2026) · NSE (company filing, nsearchives.nseindia.com) · Tier 1: company or exchange filing · 4 Nov 2026
- S21Q1 FY27 earnings call transcript (call held 28 Jul 2026) · NSE (company filing, nsearchives.nseindia.com) · Tier 1: company or exchange filing · 4 Aug 2026
- S22Q4 FY26 earnings call transcript · NSE (company filing, nsearchives.nseindia.com) · Tier 1: company or exchange filing · 2 Jun 2026
- S23Q3 FY26 earnings call transcript · NSE (company filing, nsearchives.nseindia.com) · Tier 1: company or exchange filing · 12 Feb 2026
- S24Crisil Ratings rationale: Suzlon Energy Limited ratings upgraded to Crisil AA-/Stable/Crisil A1+ (bank facilities Rs 5,685 crore) · Crisil Ratings · Tier 2: rating agency or regulator · 27 Oct 2026
- S25Intimation of Crisil rating upgrade (AA-/Stable, A1+) · NSE (company filing, nsearchives.nseindia.com) · Tier 1: company or exchange filing · 28 Oct 2026
- S26Intimation of ICRA rating action (A+ reaffirmed, outlook Positive; A1 reaffirmed; Rs 2,635 crore) · NSE (company filing, nsearchives.nseindia.com) · Tier 1: company or exchange filing · 30 Oct 2026
- S27Press release: Suzlon reveals growth ambition of 10 GW RE sales and 70 GW AUM by FY31 (Suzlon 2.0) · NSE (company filing, nsearchives.nseindia.com) · Tier 1: company or exchange filing · 3 Jun 2026
- S28NCLT order of 29 Apr 2026 sanctioning the Scheme of Arrangement for reclassification of reserves · NSE (company filing, nsearchives.nseindia.com) · Tier 1: company or exchange filing · 30 Apr 2026
- S29Customs penalty of Rs 9.60 crore on Suzlon Global Services (since merged), company to appeal · NSE (company filing, nsearchives.nseindia.com) · Tier 1: company or exchange filing · 20 Feb 2026
- S30Completion of acquisition of 51% of Renom Energy Services Private Limited · NSE (company filing, nsearchives.nseindia.com) · Tier 1: company or exchange filing · 6 Sep 2024
- S31SAST Reg 29(2) disclosures: promoter-group open-market sale of 20,00,00,000 shares on 9 Jun 2025 (NSE SAST list) · NSE (SAST disclosure) · Tier 1: company or exchange filing · 9 Jun 2025
- S32Shareholding pattern (XBRL) as of 30 Sep 2026 · NSE (company filing, nsearchives.nseindia.com) · Tier 1: company or exchange filing · 15 Oct 2026
- S33Shareholding pattern (XBRL) as of 30 Jun 2026 · NSE (company filing, nsearchives.nseindia.com) · Tier 1: company or exchange filing · 14 Jul 2026
- S34Shareholding pattern (XBRL) as of 31 Mar 2026 · NSE (company filing, nsearchives.nseindia.com) · Tier 1: company or exchange filing · 10 Apr 2026
- S35Shareholding pattern (XBRL) as of 31 Dec 2025 · NSE (company filing, nsearchives.nseindia.com) · Tier 1: company or exchange filing · 9 Jan 2026
- S36Shareholding pattern (XBRL) as of 30 Sep 2025 · NSE (company filing, nsearchives.nseindia.com) · Tier 1: company or exchange filing · 14 Oct 2025
- S37Shareholding pattern (XBRL) as of 30 Jun 2025 · NSE (company filing, nsearchives.nseindia.com) · Tier 1: company or exchange filing · 18 Jul 2025
- S38Shareholding pattern (XBRL) as of 31 Mar 2025 · NSE (company filing, nsearchives.nseindia.com) · Tier 1: company or exchange filing · 9 Apr 2025
- S39Shareholding pattern (XBRL) as of 31 Dec 2024 · NSE (company filing, nsearchives.nseindia.com) · Tier 1: company or exchange filing · 16 Jan 2025
- S40Shareholding pattern (XBRL) as of 30 Sep 2024 · NSE (company filing, nsearchives.nseindia.com) · Tier 1: company or exchange filing · 18 Oct 2024
- S41Shareholding pattern (XBRL) as of 30 Jun 2024 · NSE (company filing, nsearchives.nseindia.com) · Tier 1: company or exchange filing · 19 Jul 2024
- S42Shareholding pattern (XBRL) as of 31 Mar 2024 · NSE (company filing, nsearchives.nseindia.com) · Tier 1: company or exchange filing · 17 Apr 2024
- S43Shareholding pattern (XBRL) as of 31 Dec 2023 · NSE (company filing, nsearchives.nseindia.com) · Tier 1: company or exchange filing · 18 Jan 2024
- S44Shareholding pattern (XBRL) as of 30 Sep 2023 · NSE (company filing, nsearchives.nseindia.com) · Tier 1: company or exchange filing · 19 Oct 2023
- S45Shareholding pattern (XBRL) as of 14 Aug 2023 (filed after the QIP allotment) · NSE (company filing, nsearchives.nseindia.com) · Tier 1: company or exchange filing · 15 Aug 2023
- S46Shareholding pattern (XBRL) as of 31 Mar 2023 · NSE (company filing, nsearchives.nseindia.com) · Tier 1: company or exchange filing · 20 Apr 2023
- S47NSE CM bhavcopy for 11 Nov 2026 (SUZLON EQ close Rs 38.88) · NSE (nsearchives.nseindia.com) · Tier 1: company or exchange filing · 11 Nov 2026
Changes to this page (v1 · 12 Nov 2026)
- v1 · 12 Nov 2026First version. (first version)
Numbers come only from tier 1 and tier 2 sources. Read how we research.
Disclaimer
For learning only. Cityfort is not a SEBI-registered adviser and does not recommend buying or selling any security. Prices shown are dated and may be out of date.
Investing in securities involves risk, including loss of capital. Before making any investment decision, do your own research and consider consulting a SEBI-registered investment adviser.
Cityfort, its owners and contributors may or may not hold securities of companies covered. Content is not an offer or solicitation to buy or sell any security.
Read the full disclaimerHide the full disclaimer
Cityfort publishes educational content that explains how listed companies work. Cityfort is not registered with the Securities and Exchange Board of India (SEBI) as an Investment Adviser or Research Analyst and does not provide investment advice, recommendations, ratings, price targets or any opinion on whether to buy, sell or hold any security.
All information is taken from publicly available sources, mainly company filings on BSE and NSE, which are listed on each page with dates. We work to keep it accurate and correct errors publicly, but we do not guarantee that it is complete, accurate or up to date. Any market price or price-based ratio shown is dated, may be out of date by the time you read it, and is included only to explain concepts.
Statements by company management are reported as statements, with their date and source; they are not our forecasts.