Capital Goods · NSE: MTARTECH · BSE: 543270
MTAR Technologies: how the business works
MTAR Technologies, based in Hyderabad, machines and assembles precision parts for fuel cells, nuclear reactors, space launch vehicles and defence; its FY26 revenue was ₹876.2 crore.
Follow MTAR Technologies
Email me when MTAR Technologies's page is updated after results.
We store your email address with Kit, our email provider, which also records when you sign up and whether you open or click our emails. We send a confirmation email first. See our privacy policy.
MTAR Technologies Limited · Hyderabad, Telangana · Founded 1970
Updated for Q2 FY27 · checked
- Revenue, FY26
- ₹876.2 cr
- Net profit, FY26
- ₹94.0 cr
- Order book, 30 Sep 2026 (company figure)
- ₹5,976.5 cr
- Founded
- 1970
- Promoter group, Sep 2026
- 29.23%
The short version
MTAR Technologies in 5 points
1 · What it sells
MTAR Technologies machines and assembles precision parts for fuel cells, nuclear reactors, space launch vehicles and defence, and its FY26 revenue from operations was ₹876.2 crore.
2 · Who pays it
By the company's FY26 split, fuel-cell, hydro and other clean-energy customers paid 70.2% of revenue, products and others 15.3%, aerospace and defence 11.8% and civil nuclear 2.7%.
3 · What it keeps from ₹100
Of every ₹100 that came in during FY26, MTAR kept ₹10.5 as profit after a one-time ₹3.8 crore Labour Codes charge, and its operating profit before depreciation (EBITDA) was ₹19.1 per ₹100 of revenue.
4 · Where the operating profit comes from
MTAR reports one business segment, so it gives no profit by customer group; its FY26 EBITDA was ₹167 crore, and fuel-cell, hydro and other clean-energy customers gave ₹614.6 crore of revenue.
5 · The one thing to watch
One customer gave 72.3% of MTAR's FY26 revenue, against 71.6% in FY25, and ICRA's Jul 2026 report names Bloom Energy as the source of more than 70%.
Sources: From MTAR's FY26 annual report, its Q2 FY27 results and presentation, and ICRA's Jul 2026 rating report · checked
01Where the money goes · FY26
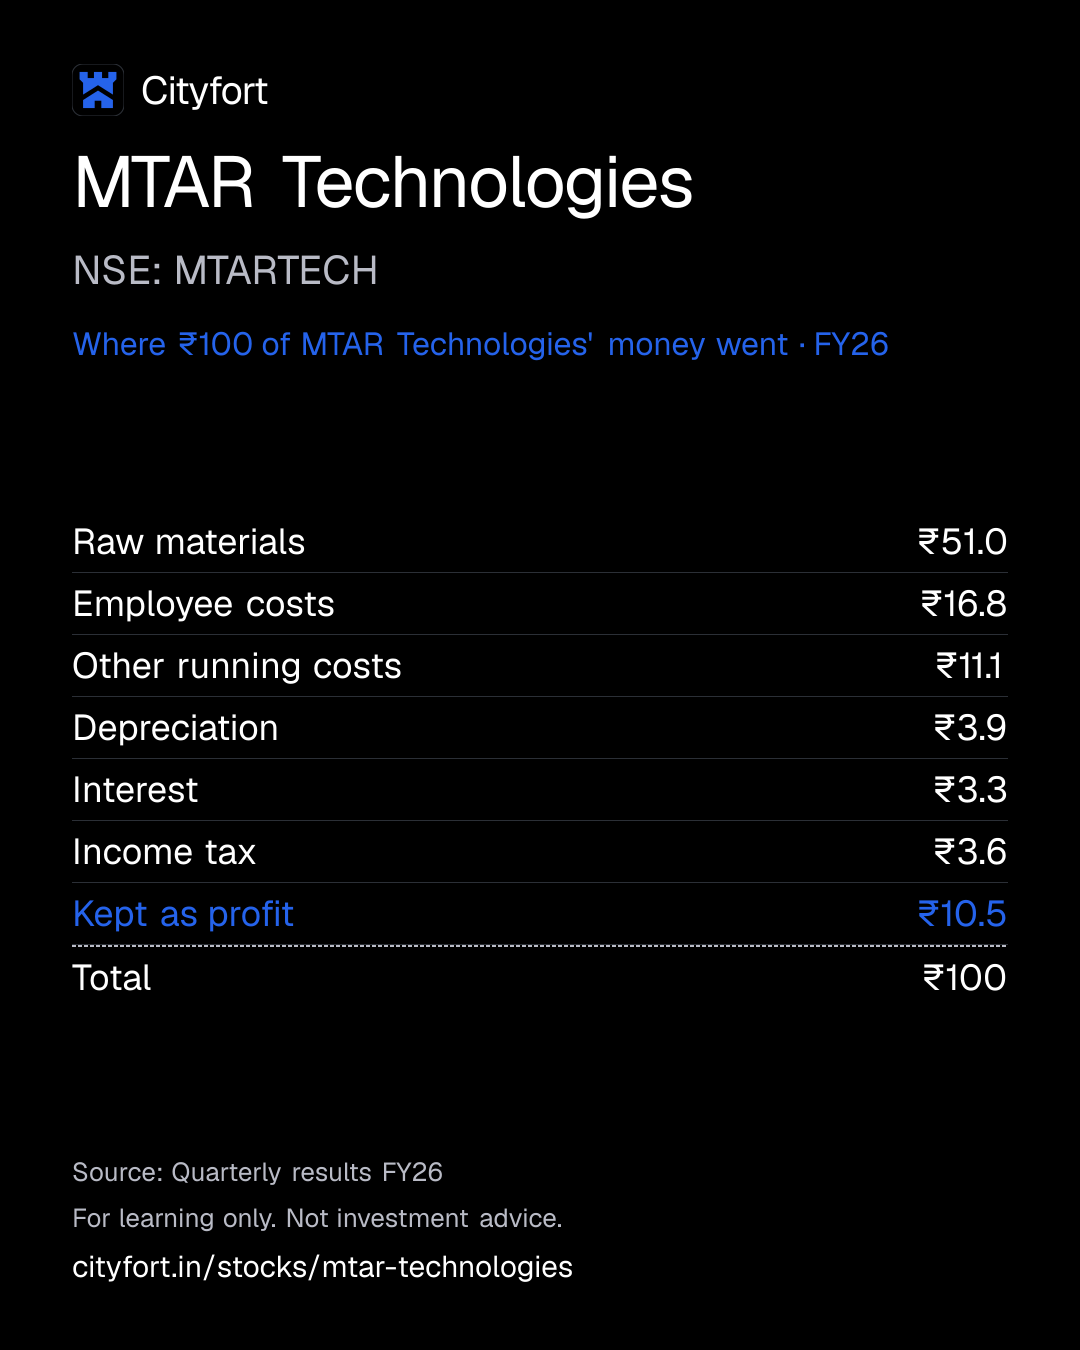
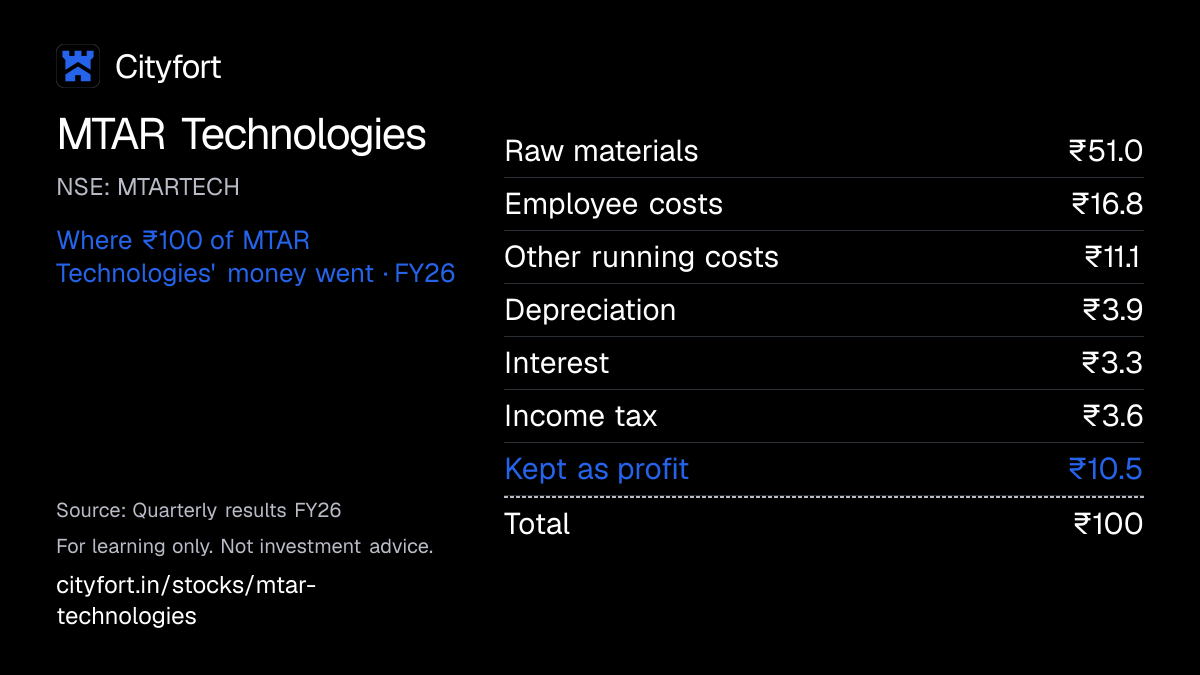
Where does ₹100 of MTAR Technologies' money go?
MTAR Technologies · FY26
Receipt for every ₹100
| Raw materials | ₹51.0 |
|---|---|
| Employee costs | ₹16.8 |
| Other running costs | ₹11.1 |
| Depreciation | ₹3.9 |
| Interest | ₹3.3 |
| Income tax | ₹3.6 |
| Kept as profit | ₹10.5 |
| Total | ₹100 |
Each line = amount ÷ total money in × 100. Lines may not add to exactly ₹100 because of rounding.
How this is worked out
Of every ₹100 that came in during FY26: revenue (₹876.2 crore) plus other income (₹23.1 crore). Cityfort calculation from the FY26 annual report. Other running costs include the one-time ₹3.8 crore Labour Codes charge.
Save this receipt as an image
Embed this receipt or the key numbers
Paste this code into a blog or website to show the card you choose, with a link back to this page.
Each week: the next company due to report results, explained in 5 points.
We'll email you once a week with what changed on Cityfort. Facts only, no tips. Unsubscribe any time.
We store your email address with Kit, our email provider, which also records when you sign up and whether you open or click our emails. We send a confirmation email first. See our privacy policy.
02The business in one line
What does MTAR Technologies do?
Fuel-cell, space, nuclear and defence customers pay MTAR Technologies to machine and assemble precision parts to their designs; during FY26 raw materials took ₹51.0 of every ₹100 that came in, staff ₹16.8, and ₹10.5 was left as profit.
- One customer gave 72.3% of FY26 revenue. ICRA's 7 Jul 2026 report says more than 70% of FY26 revenue came from Bloom Energy Corporation of the US.
- In Q2 FY27 (Jul–Sep 2026) revenue was ₹406.8 crore, three times the ₹135.6 crore of Q2 FY26. Net profit was ₹59.8 crore, against ₹4.2 crore.
03Who pays it
Who pays MTAR Technologies?
Fuel-cell, hydro and other clean-energy customers
70.2%
of revenue
Mainly a US fuel-cell customer, which buys solid oxide fuel-cell and electrolyser assemblies; also hydro-power customers such as Andritz, GE Power and Voith. Share is the company's split of FY26 revenue.
Products and others
15.3%
of revenue
Buyers of ball screws, roller screws, box-build assemblies and other import substitutes, and oil and gas firms such as Weatherford and SLB.
Aerospace and defence
11.8%
of revenue
ISRO, DRDO and Indian defence programmes, and foreign aerospace and defence firms such as Rafael, Elbit, IAI, Thales and GKN Aerospace.
Civil nuclear
2.7%
of revenue
NPCIL (Nuclear Power Corporation of India) and its contractors, for reactor-core assemblies, including orders for Kaiga units 5 and 6.
- Fuel-cell, hydro and other clean-energy customers70.2%
- Products and others15.3%
- Aerospace and defence11.8%
- Civil nuclear2.7%
Customer concentration
One customer gave ₹633.4 crore, or 72.3% of FY26 revenue, against ₹483.7 crore (71.6%) in FY25; the annual report does not name it. ICRA's 7 Jul 2026 report says more than 70% of FY26 revenue came from Bloom Energy Corporation of the US. The ₹633.4 crore is more than the whole fuel-cell, hydro and others group (₹614.6 crore).
- Largest customer
- 72%
Sources (5)
04How it makes money
How does MTAR Technologies make money?
MTAR earns by being an approved maker of hard-to-make parts for a few large programmes, so its revenue moves with those customers' orders.
ICRA says MTAR is the key supplier of several products to its clients, which limits competition. In FY26, 70.2% of revenue came from fuel-cell, hydro and other clean-energy customers. EBITDA per ₹100 of revenue fell from ₹29.3 in FY22 to ₹17.9 in FY25, then was ₹19.1 in FY26 and ₹24.4 in Q2 FY27.
EBITDA per ₹100 of revenue
₹29.3₹19.1
FY22 to FY26
- A customer such as ISRO, NPCIL or a fuel-cell maker approves MTAR to make a part.
- It places orders, sometimes years of work at once.
- MTAR buys metals and holds stock through long making cycles, often helped by customer advances.
- Its plants machine, assemble and test the parts.
- Deliveries turn the order book into revenue.
- Profit, advances and loans pay for more capacity.
↺ Step 6 feeds back into step 1.
05Business segments · FY26
Which businesses make up MTAR Technologies?
Fuel cells, hydro & others
70.2%Fuel-cell and electrolyser assemblies, and hydro and other clean-energy parts. MTAR reports one business segment, so no profit is given by group; this is the company's split of revenue by customer group.
Revenue ₹615 cr
Products & others
15.3%Ball screws, roller screws, box-build assemblies and other import substitutes, and oil and gas parts.
Revenue ₹134 cr
Aerospace & defence
11.8%Engine parts for space launch vehicles, defence assemblies and parts for foreign aerospace firms.
Revenue ₹104 cr
Civil nuclear
2.7%Assemblies for the core of nuclear reactors. It was 14.2% of revenue in FY22.
Revenue ₹23.6 cr
How the mix changed
- Fuel cells, hydro & others
- Products & others
- Aerospace & defence
- Civil nuclear
Revenue by segment, FY22 to FY26.
₹ crore
See the numbers
06The numbers · Consolidated · ₹ crore
How has MTAR Technologies done?
Revenue
₹876 crFY26
Revenue rose from ₹322.0 crore in FY22 to ₹876.2 crore in FY26 and was ₹406.8 crore in Q2 FY27, the first quarter filed as one company after MTAR merged its two wholly owned subsidiaries into itself; earlier periods are consolidated, and the restated Q2 FY26, Q1 FY27 and FY26 figures in the Q2 FY27 filing equal them.
₹ crore
See the numbers
Net profit
₹94 crFY26
Net profit fell from ₹103.4 crore in FY23 to ₹52.9 crore in FY25, then rose to ₹94.0 crore in FY26, including a one-time ₹3.8 crore Labour Codes charge; Q2 FY27 profit was ₹59.8 crore, against ₹4.2 crore in Q2 FY26.
₹ crore
See the numbers
Net profit for every ₹100 of revenue
₹10.7FY26
EBITDA per ₹100 of revenue (Cityfort calculation on reported profit before tax, leaving out other income) fell from ₹29.3 in FY22 to ₹17.9 in FY25, was ₹19.1 in FY26 (₹19.5 by the company's own EBITDA, which adds back the ₹3.8 crore Labour Codes charge) and ₹24.4 in Q2 FY27.
Net margin: ₹ of net profit per ₹100 of revenue
See the numbers
Free cash flow
₹63.3 crFY26
Free cash flow (operating cash minus capex) was negative from FY22 to FY24 and ₹63.3 crore in FY26, when operating cash flow of ₹196.9 crore included a ₹210.7 crore rise in other liabilities, mainly advances from customers.
₹ crore · cash from operations minus spending on plants and equipment
See the numbers
See all yearly numbers
EBITDA = profit before interest, tax and wear-and-tear of assets. Financial year runs April to March (March year end). Net profit is the share belonging to the company's owners.
Sources (14)
- Annual Report FY2022-23
- Annual Report FY2023-24
- Annual Report FY2024-25
- Annual Report FY2025-26
- Financial results Q2 FY25, consolidated XBRL
- Financial results Q3 FY25, consolidated XBRL
- Integrated filing (financials) Q4 FY25, consolidated iXBRL
- Integrated filing (financials) Q1 FY26, consolidated iXBRL
- Integrated filing (financials) Q2 FY26, consolidated iXBRL
- Unaudited results Q2 and H1 FY27 (standalone, after merger of subsidiaries), outcome of board meeting
- Integrated filing (financials) Q3 FY26, consolidated iXBRL
- Integrated filing (financials) Q4 FY26, consolidated iXBRL
- Integrated filing (financials) Q1 FY27, consolidated iXBRL
- Press release: Q2 FY27 results
07Who runs it
Who runs MTAR Technologies, and did they deliver?
Parvat Srinivas Reddy
Managing Director (promoter)
The annual report credits him with building the export business, including fuel cells and export aerospace.
B.V.R. Subbu (Subbu Venkata Rama Behara)
Chairman, independent non-executive director
A. Praveen Kumar Reddy
Whole-time Director
Anushman Reddy
Whole-time Director (promoter group)
Gunneswara Rao Pusarla
Chief Financial Officer
Priyanka Agarwal
Company Secretary · since 2026
Company Secretary from Jan 2026.
What they said, and what happened
1 partly delivered · 2 missed · 3 too early to tell
Said on 23 May 2025
Management said on the Q4 FY25 call that it expected FY26 revenue growth of 25% "on a conservative note, with 21% EBITDA margins plus/minus 100 basis points".
Partly deliveredWhat happened
FY26 revenue grew 29.6%, to ₹876.2 crore. The company's own FY26 EBITDA margin was 19.52%, below the 20–22% range; management cited a lower gross margin and added staff.
Said on 30 Jan 2026
Management said on the Q3 FY26 call that it expected FY26 growth of 30% to 35%: "we'll cross about INR900 crores plus".
MissedWhat happened
FY26 revenue was ₹876.2 crore, up 29.6%.
Said on 30 Jan 2026
Management said on the Q3 FY26 call that it expected a closing order book of ₹2,800 crore at the end of FY26.
MissedWhat happened
The order book was ₹2,580 crore on 31 Mar 2026; management said nuclear and defence orders had been deferred.
Said on 13 May 2026
Management said on the Q4 FY26 call that it raised FY27 guidance to "80% plus - revenue growth, plus/minus 5%", with an EBITDA margin of around 24%.
Too early to tellWhat happened
H1 FY27 revenue was ₹767.5 crore, up 162.7% on H1 FY26, with an EBITDA margin of 24.0%, per the company's presentation. Management repeated the guidance on the Q1 FY27 call (30 Jul 2026).
Said on 13 May 2026
Management said on the Q4 FY26 call that it expected a closing order book of about ₹5,000 crore at the end of FY27.
Too early to tellWhat happened
The order book was ₹5,976.5 crore on 30 Sep 2026, by the company's figure.
Said on 19 Jun 2025
The company said the 10-year Weatherford contract should bring about ₹10 crore of revenue in FY26 and about ₹90 crore a year from FY27.
Too early to tellWhat happened
On 30 Oct 2026 management said the oil and gas facility should be running by the end of Nov 2026, with the ramp-up in FY28.
Sources (11)
- Annual Report FY2025-26
- Red Herring Prospectus (IPO)
- Unaudited results Q2 and H1 FY27 (standalone, after merger of subsidiaries), outcome of board meeting
- Q4 FY25 earnings call transcript (call 23 May 2025)
- Q4 FY26 earnings call transcript (call 13 May 2026)
- Q3 FY26 earnings call transcript (call 30 Jan 2026)
- Investor presentation Q2 FY27 (October 2026)
- Integrated filing (financials) H1 FY27, standalone iXBRL
- Q1 FY27 earnings call transcript (call 30 Jul 2026)
- 10-year long-term contract with Weatherford Products GmbH
- Q2 and H1 FY27 earnings call transcript (call 30 Oct 2026)
08What could go wrong
What could go wrong for MTAR Technologies?
- Concentration
One customer gives most of the revenue
One customer gave 72.3% of FY26 revenue and 71.6% of FY25 revenue. ICRA's 7 Jul 2026 report says more than 70% of FY26 revenue came from Bloom Energy Corporation of the US, and lists this concentration among MTAR's rating constraints. On 12 Jun 2026, replying to an exchange query about media reports of an order cancellation, MTAR said it had received no communication of any cancellation.
Watch The largest customer's share of revenue in the FY27 annual report, and any company filing on its orders.
- Cash and liquidity
Cash flow helped by customer advances
FY26 operating cash flow of ₹196.9 crore included a ₹210.7 crore rise in other liabilities, mainly customer advances. H1 FY27 operating cash flow of ₹350.0 crore included a ₹217.8 crore rise. Advances are used up as the company delivers the orders they pay for.
Watch Operating cash flow and other current liabilities (₹478.7 crore on 30 Sep 2026) in each half-year.
- Governance
Promoter pledge and a falling promoter stake
3.89% of the promoter group's shares were pledged on 30 Sep 2026. If a lender sells pledged shares, the promoter stake falls further. The promoter group's stake fell from 37.26% in Dec 2023 to 29.23% in Sep 2026.
Watch Pledged shares and promoter holding in each quarterly shareholding pattern.
- Execution
Big orders with open delivery dates
The blanket orders of May 2026, amended in Jul 2026 to USD 324.62 million (about ₹3,100.09 crore), have a delivery period "to be decided later", per the filings. Management said on 13 May 2026 that it expects FY27 revenue growth of 80% plus (±5%), and on 30 Oct 2026 that H2 FY27 should be stronger than H1.
Watch Revenue in Q3 and Q4 FY27 against the order book.
- Cash and liquidity
Money tied up in stock
Inventories rose to ₹678.8 crore on 30 Sep 2026 from ₹500.5 crore on 31 Mar 2026. The company reported an inventory cycle of 208 days in FY26, against 186 days in FY25. ICRA calls the business working-capital intensive.
Watch Inventories against revenue in each half-year.
- Debt
Rising borrowings for expansion
Borrowings rose from ₹177.3 crore on 31 Mar 2025 to ₹466.3 crore on 30 Sep 2026, and H1 FY27 capex was ₹273.1 crore. ICRA says a sustained fall in interest cover below 5 times could lead to a downgrade; it was 5.8 times in FY26 on ICRA's definition.
Watch Borrowings and interest cost in each quarter.
- Currency
Currency swings
Exports were 83% of FY26 revenue, by the company's figure. FY26 other income included ₹8.6 crore of unrealised currency gains. ICRA lists foreign-exchange exposure among its rating factors.
Watch Currency gains or losses in other income.
Sources (10)
- Annual Report FY2025-26
- ICRA rationale: long-term ratings upgraded to [ICRA]A+ (Stable)
- Clarification on news item about order cancellation reports (letter dated 12 Jun 2026)
- Unaudited results Q2 and H1 FY27 (standalone, after merger of subsidiaries), outcome of board meeting
- Shareholding pattern as of 30 Sep 2026 (XBRL)
- Shareholding pattern as of 31 Dec 2023 (XBRL)
- Receipt of purchase orders worth Rs 2,278.96 crore from an international customer
- Amended purchase order worth USD 324.62 million (about Rs 3,100.09 crore)
- Q4 FY26 earnings call transcript (call 13 May 2026)
- Q2 and H1 FY27 earnings call transcript (call 30 Oct 2026)
09Supporters and critics
What do supporters and critics point to?
What supporters point to
- Revenue rose from ₹322.0 crore in FY22 to ₹876.2 crore in FY26, and H1 FY27 revenue was ₹767.5 crore, against ₹292.2 crore in H1 FY26.
- The company reported an order book of ₹5,976.5 crore on 30 Sep 2026, against ₹2,580 crore on 31 Mar 2026.
- EBITDA per ₹100 of revenue was ₹24.4 in Q2 FY27, against ₹12.5 in Q2 FY26.
- ICRA upgraded MTAR's long-term rating to [ICRA]A+ in Jul 2026.
- Net debt fell to ₹83.2 crore on 30 Sep 2026 from ₹160.3 crore on 31 Mar 2025.
What critics point to
- One customer gave 72.3% of FY26 revenue.
- FY26 fell short of management's own targets: revenue of ₹876.2 crore against "about INR900 crores plus" (said 30 Jan 2026), and a 19.52% EBITDA margin against 21% plus or minus 1 point (said 23 May 2025).
- H1 FY27 operating cash flow of ₹350.0 crore included a ₹217.8 crore rise in liabilities that include customer advances.
- The promoter group's stake fell from 37.26% in Dec 2023 to 29.23% in Sep 2026, and 3.89% of its shares were pledged.
- Free cash flow was negative in FY22, FY23 and FY24.
10What to watch next
What should you watch next at MTAR Technologies?
Next event
Q3 FY27 results
Date not announced yet.
Growth against the FY27 target
Management said on 13 May 2026 it expects FY27 revenue growth of 80% plus (±5%) and an EBITDA margin of about 24%. H1 FY27 revenue rose 162.7%, with a 24.0% margin.
Cash once advances are used
Other current liabilities, mainly customer advances, were ₹478.7 crore on 30 Sep 2026. Operating cash flow was ₹350.0 crore in H1 FY27.
Promoter stake and pledge
The promoter group held 29.23% on 30 Sep 2026, and 3.89% of its shares were pledged.
11Key facts
Key facts about MTAR Technologies
- What does MTAR Technologies do?
- MTAR Technologies, based in Hyderabad, machines and assembles precision parts for fuel cells, nuclear reactors, space launch vehicles and defence systems, to its customers' designs. MTAR Technologies' FY26 revenue from operations was ₹876.2 crore.
- How does MTAR Technologies make money?
- MTAR Technologies is paid for the parts and assemblies it delivers against customer orders. In FY26, fuel-cell, hydro and other clean-energy customers gave 70.2% of MTAR Technologies' revenue, products and others 15.3%, aerospace and defence 11.8% and civil nuclear 2.7%, by the company's split.
- Who are MTAR Technologies' customers?
- One customer gave ₹633.4 crore, or 72.3%, of MTAR Technologies' FY26 revenue; the annual report does not name it. ICRA's 7 Jul 2026 rating report says more than 70% of MTAR Technologies' FY26 revenue came from Bloom Energy Corporation of the US. Other customers named in MTAR Technologies' FY26 annual report include ISRO, DRDO, Rafael, Elbit and Thales, and ICRA also names NPCIL.
- How big is MTAR Technologies?
- MTAR Technologies' revenue from operations was ₹876.2 crore in FY26, up from ₹676.0 crore in FY25, and its FY26 net profit was ₹94.0 crore. In Q2 FY27 (Jul–Sep 2026) MTAR Technologies' revenue was ₹406.8 crore.
- Who owns MTAR Technologies?
- On 30 Sep 2026 MTAR Technologies' promoter group, which includes Managing Director Parvat Srinivas Reddy, held 29.23%, down from 37.26% on 31 Dec 2023. Foreign investors held 20.87% of MTAR Technologies, Indian institutions 27.09% and individuals and others 22.81%. 3.89% of the promoter group's shares were pledged.
- How large is MTAR Technologies' order book?
- MTAR Technologies reported an order book of ₹5,976.5 crore on 30 Sep 2026, against ₹2,580 crore on 31 Mar 2026. An order book is orders received but not yet delivered; these are company figures from its presentations and calls.
- Does MTAR Technologies have debt?
- On 30 Sep 2026 MTAR Technologies had borrowings of ₹466.3 crore and ₹383.2 crore of cash, bank balances and mutual-fund investments, so net debt was ₹83.2 crore (Cityfort calculation from the Q2 FY27 results). ICRA upgraded MTAR Technologies' long-term rating to [ICRA]A+ (Stable) on 7 Jul 2026.
- When did MTAR Technologies list on the stock market?
- MTAR Technologies listed on NSE and BSE on 15 Mar 2021 after an IPO at ₹575 a share. The IPO's fresh issue raised ₹123.5 crore for MTAR Technologies; the other ₹472.9 crore was shares sold by existing shareholders.
- Why does MTAR Technologies report standalone results from Q2 FY27?
- On 28 Oct 2026 the NCLT approved the merger of MTAR Technologies' two wholly owned subsidiaries, Gee Pee Aerospace & Defence and Magnatar Aero Systems, into the company, effective 1 Apr 2025. From Q2 FY27 MTAR Technologies files one set of accounts, and its restated FY26 figures equal the consolidated ones first reported.
Sources (9)
- Annual Report FY2025-26
- ICRA rationale: long-term ratings upgraded to [ICRA]A+ (Stable)
- Unaudited results Q2 and H1 FY27 (standalone, after merger of subsidiaries), outcome of board meeting
- Shareholding pattern as of 30 Sep 2026 (XBRL)
- Shareholding pattern as of 31 Dec 2023 (XBRL)
- Investor presentation Q2 FY27 (October 2026)
- Q4 FY26 earnings call transcript (call 13 May 2026)
- Annual Report FY2022-23
- Intimation of NCLT order (28 Oct 2026) sanctioning merger of Gee Pee Aerospace and Defence and Magnatar Aero Systems into MTAR
Terms on this page
- Capital expenditure (capex)
- Credit rating
- Customer concentration
- Dividend payout ratio
- EBITDA
- FII and DII holding
- Free cash flow
- Market capitalisation
- Net debt
- Net profit
Each explains the term in plain English, with the same number from other companies on Cityfort.
Go deeper
More detail from the same filings. Open any section.
12What it sells
12What it sells
What does MTAR Technologies sell?
Fuel-cell and electrolyser assemblies
Assemblies for solid oxide fuel cells (which turn gas into electricity) and solid oxide electrolysers, for a US-based customer. With hydro and other clean-energy parts, this group gave ₹614.6 crore of FY26 revenue.
Nuclear reactor assemblies
Fuelling machine heads, fuel transfer systems, bridge and column assemblies, coolant channel assemblies and drive mechanisms for the core of civil nuclear reactors. Civil nuclear gave ₹23.6 crore of FY26 revenue.
Space and defence parts
Liquid propulsion engines, cryogenic engine sub-systems and satellite valves for space launch vehicles, actuator assemblies for the LCA Tejas fighter, and parts for foreign aerospace firms. Aerospace and defence gave ₹103.8 crore of FY26 revenue.
Products and others
Ball screws, roller screws and water-lubricated bearings that replace imports, box-build assemblies, and oil and gas parts under a 10-year Weatherford contract signed in Jun 2025. This group gave ₹134.1 crore of FY26 revenue.
Data-centre products (new)
Components and assemblies for data-centre infrastructure, starting with first-article (trial) orders, including a ₹35.56 crore international order in Apr 2026.
What it does
- Does: Machines, assembles and tests parts and assemblies to customers' designs
- Does: Sells mostly abroad: exports were 83% of FY26 revenue, by the company's figure
- Does: Works from a large order book: ₹5,976.5 crore on 30 Sep 2026 (company figure)
What it does not do
- Does not: Make or sell fuel cells, reactors or rockets: it supplies parts to the organisations that do
- Does not: Report profit by business line: it has one reportable segment
- Does not: Pay a dividend: the board decided not to pay one for FY26
Sources (6)
- Annual Report FY2025-26
- ICRA rationale: long-term ratings upgraded to [ICRA]A+ (Stable)
- Investor presentation Q2 FY27 (October 2026)
- 10-year long-term contract with Weatherford Products GmbH
- Purchase order worth Rs 35.56 crore for data-centre products (international)
- Q2 and H1 FY27 earnings call transcript (call 30 Oct 2026)
13How the money flows
13How the money flows · FY26
How does money flow through MTAR Technologies?
Money in
- Revenue from operations₹876 cr
- Other income (incl. ₹8.6 crore unrealised currency gains)₹23.1 cr
The company
MTAR Technologies
₹899 cr came in
Money out
- Raw materials (after ₹45.1 crore of goods added to stock)₹458 cr
- Employee costs₹151 cr
- Other running costs (incl. ₹3.8 crore one-time Labour Codes charge)₹99.5 cr
- Depreciation₹35 cr
- Interest₹29.4 cr
- Income tax₹32.1 cr
- Net profit₹94 cr
- In FY26 MTAR brought in ₹876.2 crore of revenue, plus ₹23.1 crore of other income, including ₹8.6 crore of unrealised currency gains.
- Raw materials took ₹458.4 crore, after ₹45.1 crore of unfinished and finished goods were added to stock.
- Employees took ₹150.9 crore. Other running costs took ₹95.7 crore, plus a one-time ₹3.8 crore charge for India's new Labour Codes.
- Depreciation (wear and tear of plants and machines) took ₹35.0 crore and interest ₹29.4 crore.
- Tax took ₹32.1 crore. ₹94.0 crore was left as profit.
14What it needs to run
14What it needs to run
What does MTAR Technologies need to run?
Plants in India
The FY26 sustainability report (BRSR) lists 11 plants and one office, all in India, and none abroad. A dedicated aerospace facility opened in Jan 2025.
Metals held for long making cycles
ICRA says MTAR makes products with a long cycle, so stock levels stay high. Inventories were ₹678.8 crore on 30 Sep 2026, against ₹500.5 crore on 31 Mar 2026.
Skilled people
4,467 people on 31 Mar 2026: 903 staff, 1,613 workmen and 1,951 third-party contract workers.
Money for capacity
Capex (spending on plants and machines) was ₹133.6 crore in FY26 and ₹273.1 crore in H1 FY27. ICRA says MTAR plans about ₹250–300 crore of capex over the medium term, funded by debt and its own cash.
Sources (5)
15Where it sells
15Where it sells · FY26
Where does MTAR Technologies sell?
- Outside India83%
- India17%
Sources (1)
16Competitors and what protects it
16Competitors and what protects it
Who does MTAR Technologies compete with?
Larsen & Toubro
NSE: LT
Named in MTAR's Feb 2021 IPO prospectus as a competitor in nuclear (L&T Heavy Engineering) and in space and defence, citing an industry report commissioned by the company from CRISIL.
Godrej & Boyce
Named in MTAR's Feb 2021 IPO prospectus as a competitor in nuclear and in space and defence, citing an industry report commissioned by the company from CRISIL.
Hindustan Aeronautics
NSE: HAL
Named in MTAR's Feb 2021 IPO prospectus as a competitor in space and defence, citing an industry report commissioned by the company from CRISIL.
Walchandnagar Industries
Named in MTAR's Feb 2021 IPO prospectus as a competitor in space and defence, citing an industry report commissioned by the company from CRISIL.
What protects the business
Each strength is scored 1 (weak) to 5 (strong) for the business, with the reason. It is not a rating of the share.
- Approved supplier of hard-to-make parts4 of 5
ICRA says MTAR is the key supplier of several products to its clients, which limits competition. The company describes itself as one of the top three suppliers to India's civil nuclear, space and defence programmes.
- Order book3 of 5
The company reported an order book of ₹5,976.5 crore on 30 Sep 2026, about 6.8 times FY26 revenue of ₹876.2 crore (Cityfort calculation). The largest orders, from an unnamed international customer, have delivery periods "to be decided later".
- Long ties with Indian programmes3 of 5
The annual report says MTAR has more than five decades of experience and has supplied ISRO since 1983. ICRA names ISRO, NPCIL and DRDL among its clients.
Weak spot
One customer gives most of the revenue
One customer gave 72.3% of FY26 revenue. ICRA lists this customer concentration among MTAR's rating constraints.
Sources (6)
- Red Herring Prospectus (IPO)
- ICRA rationale: long-term ratings upgraded to [ICRA]A+ (Stable)
- Annual Report FY2025-26
- Investor presentation Q2 FY27 (October 2026)
- Receipt of purchase orders worth Rs 2,278.96 crore from an international customer
- Amended purchase order worth USD 324.62 million (about Rs 3,100.09 crore)
17Where growth could come from
17Where growth could come from
Where could MTAR Technologies' growth come from?
Management said on the Q4 FY26 call (13 May 2026) that it raised its FY27 guidance "from 50% revenue growth to 80% plus - revenue growth, plus/minus 5%", with an EBITDA margin of around 24%. The Q2 FY27 presentation (30 Oct 2026) repeated 80% growth with a 24% margin, plus or minus 1 percentage point. On the 30 Oct 2026 call management said it expects H2 FY27 to be stronger than H1.
Fuel-cell and electrolyser assemblies
Working₹614.6 crore, FY26 (+47.4%)
Fuel cells, hydro and others rose from ₹416.9 crore in FY25, and was ₹554.7 crore in H1 FY27 alone. This group was ₹4,075.5 crore (68.2%) of the 30 Sep 2026 order book, by the company's figures.
Status: Working, on track against what the company said.
Civil nuclear orders
Mixed₹23.6 crore, FY26
Revenue was ₹61.9 crore in FY24 and ₹18.4 crore in FY25. New orders since include ₹504 crore for Kaiga units 5 and 6 in FY26, of which ₹194 crore came from Megha Engineering, and ₹126.7 crore from NPCIL in Aug 2026. Management put the nuclear order book at about ₹820 crore on 30 Oct 2026.
Status: Mixed, partly on track.
Aerospace and defence
Working₹103.8 crore, FY26 (+11.4%)
Revenue rose from ₹93.2 crore in FY25 and was ₹80.2 crore in H1 FY27. Management said on 30 Oct 2026 it expects about ₹150 crore plus of revenue from one multinational aerospace customer in FY27.
Status: Working, on track against what the company said.
Oil and gas parts (Weatherford)
Early10-year contract, Jun 2025
The company said on 19 Jun 2025 that the Weatherford contract should bring about ₹90 crore a year from FY27. On 30 Oct 2026 management said the oil and gas facility should be running by the end of Nov 2026, with the ramp-up in FY28.
Status: Early, too early to judge.
Data-centre products
New₹35.56 crore order, Apr 2026
Management said on 30 Oct 2026 that first-article orders were about ₹45 crore and that the business has the "potential to scale up to INR350 crores to INR450 crores over the next 2 years".
Status: New, recently announced.
Status compares progress with what the company itself said it would do: Working = on track against what the company said; Mixed = partly on track; Behind = behind the company's own plan; New = recently announced; Early = too early to judge.
Sources (8)
- Q4 FY26 earnings call transcript (call 13 May 2026)
- Investor presentation Q2 FY27 (October 2026)
- Q2 and H1 FY27 earnings call transcript (call 30 Oct 2026)
- Annual Report FY2025-26
- Orders worth Rs 194 crore from Megha Engineering and Infrastructures (Kaiga 5 and 6)
- NPCIL orders worth Rs 126.7 crore (RAPS-4 and MAPS-2 refurbishment)
- 10-year long-term contract with Weatherford Products GmbH
- Purchase order worth Rs 35.56 crore for data-centre products (international)
18Financial strength and debt
18Financial strength · 30 Sep 2026
How much debt does MTAR Technologies have?
- Total debt₹466 cr
- Cash and investments₹383 cr
- Net debt (debt minus cash)₹83.2 cr
- Net worth (shareholders' money)₹933 cr
- Debt to equity
- 0.5×
- ₹ of debt for every ₹1 of shareholders' money
- Net debt = borrowings − cash − other bank balances − mutual funds (Cityfort calculation from the annual reports and Q2 FY27 results): net cash of ₹33.4 crore on 31 Mar 2022, then net debt of ₹84.7 crore (Mar 2023), ₹140.1 crore (Mar 2024), ₹160.3 crore (Mar 2025), ₹132.7 crore (Mar 2026) and ₹83.2 crore (Sep 2026). Lease liabilities (₹8.9 crore on 30 Sep 2026) are not counted.
- Borrowings rose from ₹177.3 crore on 31 Mar 2025 to ₹369.2 crore on 31 Mar 2026 and ₹466.3 crore on 30 Sep 2026; mutual-fund investments rose from nil to ₹215.3 crore and ₹362.0 crore over the same dates.
- Advances from customers (contract liabilities) were ₹252.7 crore on 31 Mar 2026, against ₹43.3 crore a year earlier. Other current liabilities were ₹478.7 crore on 30 Sep 2026.
- Inventories were ₹678.8 crore and receivables ₹285.8 crore on 30 Sep 2026, against ₹500.5 crore and ₹336.8 crore on 31 Mar 2026.
- ICRA put FY26 gearing at 0.46x, total debt at 2.2 times operating profit (OPBDITA) and interest cover at 5.8x, on its own definitions, and calls liquidity adequate.
- The 30 Sep 2026 balance sheet is MTAR's own after the merger of its two wholly owned subsidiaries; the 31 Mar 2026 column in the same filing equals the consolidated one.
19Who owns it
19Who owns it · Q2 FY27
Who owns MTAR Technologies?
- Promoters (founders or parent company)29.2%, of which pledged 1.1%
- Foreign institutions (FII)20.9%
- Indian institutions (DII)27.1%
- Public and others22.8%
- Pledged: 3.9% of promoter shares (1.1% of all shares)1.1%
Promoter shares pledged
3.9% of promoter shares
A pledge means promoters gave shares as security for a loan. If the loan isn't repaid, the lender can sell them.
How ownership changed
* Pledged = share of the promoters' own holding reported as pledged. In older filings this can include shares “otherwise encumbered”; the governance flags say when.
Sources (12)
- Shareholding pattern as of 31 Dec 2023 (XBRL)
- Shareholding pattern as of 31 Mar 2024 (XBRL)
- Shareholding pattern as of 30 Jun 2024 (XBRL)
- Shareholding pattern as of 30 Sep 2024 (XBRL)
- Shareholding pattern as of 31 Dec 2024 (XBRL)
- Shareholding pattern as of 31 Mar 2025 (XBRL)
- Shareholding pattern as of 30 Jun 2025 (XBRL)
- Shareholding pattern as of 30 Sep 2025 (XBRL)
- Shareholding pattern as of 31 Dec 2025 (XBRL)
- Shareholding pattern as of 31 Mar 2026 (XBRL)
- Shareholding pattern as of 30 Jun 2026 (XBRL)
- Shareholding pattern as of 30 Sep 2026 (XBRL)
20What it does with profit
20What it does with profit
What does MTAR Technologies do with its profit?
Dividend per share
₹0.00FY26
Dividend paid for each share, by financial year.
₹ per share
See the numbers
Money raised · 15 Mar 2021
IPO at ₹575 a share; shares listed on NSE and BSE on 15 Mar 2021. The fresh issue of 2,148,149 shares raised ₹123.5 crore for the company; 8,224,270 shares (₹472.9 crore) were sold by existing shareholders.
₹124 cr
21Governance signals
21Governance signals
What do MTAR Technologies' governance filings show?
- Auditor
- S.R. Batliboi & Associates LLP
- Auditor changes
- None in the period covered
- Audit qualifications
- None reported
- Related-party dealings
- The FY26 board's report says all related-party transactions were at arm's length and in the ordinary course of business, and none with promoters, directors or key managers was materially significant. Form AOC-2 lists dealings with the two wholly owned subsidiaries, rent with promoter K. Shalini Reddy, and internet services from Nettlinx Limited, a promoter-group entity.
- Credit rating
- ICRA [ICRA]A+ (long term, upgraded from [ICRA]A); [ICRA]A1 (short term, reaffirmed) (outlook Stable), 7 Jul 2026
A credit rating describes the company's ability to repay debt. It is not a rating of the share.
Flags to know about
pledge · 14 Oct 2026
Promoter shares pledged: 3.89% of the promoter holding
On 30 Sep 2026, 350,000 promoter-group shares were pledged (given as loan collateral): 3.89% of the promoter group's holding and 1.14% of all shares (Cityfort calculation). The pledged share was 10.90% on 30 Sep 2025 and 3.52% on 30 Jun 2026.
other · 14 Oct 2026
Promoter group's stake fell from 37.26% to 29.23%
Promoter-group shares fell from 11,461,974 on 31 Dec 2023 to 8,991,664 on 30 Sep 2026. The total share count stayed at 30,759,591, so the lower stake reflects fewer shares held by the promoter group, not new shares issued.
disclosure · 30 Jul 2026
Largest customer not named in company filings
The FY26 annual report does not name the customer that gave 72.3% of revenue. The May and Jul 2026 order filings (₹2,278.96 crore, amended to about ₹3,100.09 crore, and ₹467.30 crore) say the company cannot disclose the customer's name.
regulatory · 5 Sep 2026
NSE fine for a one-day filing delay
The FY26 annual report says NSE levied a fine of ₹5,000 (excluding GST) for a one-day delay in filing the XBRL of integrated financials, including the related-party disclosure, for the half year to 30 Sep 2025. The company says it paid the fine and made the disclosure.
other · 5 Sep 2026
Insider-trading code breaches by designated persons
The FY26 annual report lists two instances in which designated persons traded MTAR shares without pre-clearance, including contra trades. In the first, the board imposed a penalty of ₹179,998, equal to the profits from the trades; in the second, the profit and the board's penalty together came to ₹92,501.21. Both amounts were remitted to SEBI's Investor Protection and Education Fund and disclosed to the exchanges on 7 Feb 2026 and 25 May 2026.
other · 29 Oct 2026
Subsidiaries merged into the company
The NCLT Hyderabad sanctioned the merger of Gee Pee Aerospace & Defence and Magnatar Aero Systems into MTAR on 28 Oct 2026, effective 1 Apr 2025. From Q2 FY27 the company files standalone results only; it says the effect on past periods is not material.
Sources (12)
- Annual Report FY2025-26
- Annual Report FY2022-23
- ICRA rationale: long-term ratings upgraded to [ICRA]A+ (Stable)
- Shareholding pattern as of 30 Sep 2026 (XBRL)
- Shareholding pattern as of 30 Sep 2025 (XBRL)
- Shareholding pattern as of 30 Jun 2026 (XBRL)
- Shareholding pattern as of 31 Dec 2023 (XBRL)
- Receipt of purchase orders worth Rs 2,278.96 crore from an international customer
- Receipt of purchase orders worth Rs 467.30 crore from an international customer
- Amended purchase order worth USD 324.62 million (about Rs 3,100.09 crore)
- Intimation of NCLT order (28 Oct 2026) sanctioning merger of Gee Pee Aerospace and Defence and Magnatar Aero Systems into MTAR
- Unaudited results Q2 and H1 FY27 (standalone, after merger of subsidiaries), outcome of board meeting
22What the market paid
22What the market paid · price as of 11 Nov 2026
What did the market pay for MTAR Technologies on 11 Nov 2026?
Price as of 11 Nov 2026 (shown for education; prices change daily).
Price as of 11 Nov 2026: ₹5,775.50, the NSE closing price. Market value as of 11 Nov 2026 was ₹17,765 crore (Cityfort calculation: price × 30,759,591 shares in the Sep 2026 shareholding pattern). P/E as of 11 Nov 2026 was 94.0: price ÷ ₹61.46 of earnings per share in the four quarters Q3 FY26 to Q2 FY27 (Cityfort calculation from the quarterly results); on FY26 earnings per share of ₹30.57 it was 188.9. P/E is the rupees paid for each rupee of a year's profit. P/B as of 11 Nov 2026 was 19.0: market value ÷ shareholders' equity of ₹932.6 crore on 30 Sep 2026 (Cityfort calculation).
- Share price
- ₹5,775.50
- Market value (market cap)
- ₹17,765 cr
- P/E
- 94×
- P/B
- 19×
Source: Security-wise historical price data MTARTECH (EQ), 2 to 11 Nov 2026; Shareholding pattern as of 30 Sep 2026 (XBRL); Unaudited results Q2 and H1 FY27 (standalone, after merger of subsidiaries), outcome of board meeting and 4 more
Sources (7)
- Security-wise historical price data MTARTECH (EQ), 2 to 11 Nov 2026
- Shareholding pattern as of 30 Sep 2026 (XBRL)
- Unaudited results Q2 and H1 FY27 (standalone, after merger of subsidiaries), outcome of board meeting
- Integrated filing (financials) Q1 FY27, consolidated iXBRL
- Integrated filing (financials) Q4 FY26, consolidated iXBRL
- Integrated filing (financials) Q3 FY26, consolidated iXBRL
- Annual Report FY2025-26
23How it got here
23How it got here
How did MTAR Technologies get here?
1970
Milestone
Founded in Hyderabad
The IPO prospectus says MTAR was constituted as a partnership firm in Hyderabad on 23 Jul 1970; the FY26 annual report gives 1969 as the year it was established.
1999
Milestone
Became a company
The partnership firm was incorporated as a private limited company in 1999, per ICRA and the IPO prospectus.
2021
Milestone
IPO and listing
Listed on NSE and BSE on 15 Mar 2021 after an IPO at ₹575 a share; the fresh issue raised ₹123.5 crore.
2022
Milestone
Bought Gee Pee Aerospace & Defence
Acquired Gee Pee Aerospace & Defence on 2 Jun 2022 for a purchase consideration of ₹6.7 crore.
2024
Crisis
Flat year (FY24)
FY24 revenue rose 1.2% to ₹580.8 crore and net profit fell 45.7% to ₹56.1 crore. Fuel cells, hydro and others fell from ₹441.7 crore to ₹351.1 crore.
2025
Milestone
Aerospace plant and Weatherford contract
A dedicated aerospace facility opened in Jan 2025. A 10-year contract with Weatherford for oil and gas parts was signed in Jun 2025.
2026
Business-model change
Large orders from an international customer
In May 2026 an unnamed international customer placed blanket orders of ₹2,278.96 crore, amended in Jul 2026 to about ₹3,100.09 crore, plus ₹467.30 crore of other orders. The order book reached ₹5,143.3 crore on 30 Jun 2026.
2026
Milestone
Rating upgrade
ICRA upgraded MTAR's long-term rating to [ICRA]A+ (Stable) from [ICRA]A on 7 Jul 2026.
2026
Milestone
Subsidiaries merged in
The NCLT sanctioned the merger of both wholly owned subsidiaries into MTAR on 28 Oct 2026, effective 1 Apr 2025.
Sources (12)
- Red Herring Prospectus (IPO)
- Annual Report FY2025-26
- ICRA rationale: long-term ratings upgraded to [ICRA]A+ (Stable)
- Annual Report FY2022-23
- Annual Report FY2024-25
- Investor presentation Q2 FY27 (October 2026)
- 10-year long-term contract with Weatherford Products GmbH
- Receipt of purchase orders worth Rs 2,278.96 crore from an international customer
- Amended purchase order worth USD 324.62 million (about Rs 3,100.09 crore)
- Receipt of purchase orders worth Rs 467.30 crore from an international customer
- Investor presentation Q1 FY27
- Intimation of NCLT order (28 Oct 2026) sanctioning merger of Gee Pee Aerospace and Defence and Magnatar Aero Systems into MTAR
24Sources and changes
Where every number on this page comes from
Sources (47 documents)
- S1Annual Report FY2025-26 · MTAR Technologies Ltd (via NSE) · Tier 1: company or exchange filing · 5 Sep 2026
- S2Annual Report FY2024-25 · MTAR Technologies Ltd (via NSE) · Tier 1: company or exchange filing · 26 Aug 2025
- S3Annual Report FY2023-24 · MTAR Technologies Ltd · Tier 1: company or exchange filing · 14 Aug 2024
- S4Annual Report FY2022-23 · MTAR Technologies Ltd (via NSE) · Tier 1: company or exchange filing · 21 Jul 2023
- S5Unaudited results Q2 and H1 FY27 (standalone, after merger of subsidiaries), outcome of board meeting · MTAR Technologies Ltd (via NSE) · Tier 1: company or exchange filing · 29 Oct 2026
- S6Integrated filing (financials) H1 FY27, standalone iXBRL · NSE · Tier 1: company or exchange filing · 29 Oct 2026
- S7Press release: Q2 FY27 results · MTAR Technologies Ltd (via NSE) · Tier 1: company or exchange filing · 29 Oct 2026
- S8Investor presentation Q2 FY27 (October 2026) · MTAR Technologies Ltd (via NSE) · Tier 1: company or exchange filing · 30 Oct 2026
- S9Q2 and H1 FY27 earnings call transcript (call 30 Oct 2026) · MTAR Technologies Ltd (via NSE) · Tier 1: company or exchange filing · 6 Nov 2026
- S10Integrated filing (financials) Q1 FY27, consolidated iXBRL · NSE · Tier 1: company or exchange filing · 29 Jul 2026
- S11Investor presentation Q1 FY27 · MTAR Technologies Ltd (via NSE) · Tier 1: company or exchange filing · 30 Jul 2026
- S12Q1 FY27 earnings call transcript (call 30 Jul 2026) · MTAR Technologies Ltd (via NSE) · Tier 1: company or exchange filing · 6 Aug 2026
- S13Integrated filing (financials) Q4 FY26, consolidated iXBRL · NSE · Tier 1: company or exchange filing · 12 May 2026
- S14Q4 FY26 earnings call transcript (call 13 May 2026) · MTAR Technologies Ltd (via NSE) · Tier 1: company or exchange filing · 20 May 2026
- S15Integrated filing (financials) Q3 FY26, consolidated iXBRL · NSE · Tier 1: company or exchange filing · 29 Jan 2026
- S16Q3 FY26 earnings call transcript (call 30 Jan 2026) · MTAR Technologies Ltd (via NSE) · Tier 1: company or exchange filing · 5 Feb 2026
- S17Integrated filing (financials) Q2 FY26, consolidated iXBRL · NSE · Tier 1: company or exchange filing · 6 Nov 2025
- S18Integrated filing (financials) Q1 FY26, consolidated iXBRL · NSE · Tier 1: company or exchange filing · 5 Aug 2025
- S19Integrated filing (financials) Q4 FY25, consolidated iXBRL · NSE · Tier 1: company or exchange filing · 22 May 2025
- S20Financial results Q3 FY25, consolidated XBRL · NSE · Tier 1: company or exchange filing · 10 Feb 2025
- S21Financial results Q2 FY25, consolidated XBRL · NSE · Tier 1: company or exchange filing · 30 Oct 2024
- S22Q4 FY25 earnings call transcript (call 23 May 2025) · MTAR Technologies Ltd (via NSE) · Tier 1: company or exchange filing · 30 May 2025
- S23Intimation of NCLT order (28 Oct 2026) sanctioning merger of Gee Pee Aerospace and Defence and Magnatar Aero Systems into MTAR · MTAR Technologies Ltd (via NSE) · Tier 1: company or exchange filing · 29 Oct 2026
- S24ICRA rationale: long-term ratings upgraded to [ICRA]A+ (Stable) · ICRA Ltd · Tier 2: rating agency or regulator · 7 Jul 2026
- S25Red Herring Prospectus (IPO) · MTAR Technologies Ltd (via NSE) · Tier 1: company or exchange filing · 22 Feb 2021
- S26Business Responsibility and Sustainability Report FY2025-26 · MTAR Technologies Ltd (via NSE) · Tier 1: company or exchange filing · 5 Sep 2026
- S27Clarification on news item about order cancellation reports (letter dated 12 Jun 2026) · MTAR Technologies Ltd (via NSE) · Tier 1: company or exchange filing · 15 Jun 2026
- S28Receipt of purchase orders worth Rs 2,278.96 crore from an international customer · MTAR Technologies Ltd (via NSE) · Tier 1: company or exchange filing · 14 May 2026
- S29Receipt of purchase orders worth Rs 467.30 crore from an international customer · MTAR Technologies Ltd (via NSE) · Tier 1: company or exchange filing · 22 May 2026
- S30Amended purchase order worth USD 324.62 million (about Rs 3,100.09 crore) · MTAR Technologies Ltd (via NSE) · Tier 1: company or exchange filing · 30 Jul 2026
- S31NPCIL orders worth Rs 126.7 crore (RAPS-4 and MAPS-2 refurbishment) · MTAR Technologies Ltd (via NSE) · Tier 1: company or exchange filing · 26 Aug 2026
- S32Orders worth Rs 194 crore from Megha Engineering and Infrastructures (Kaiga 5 and 6) · MTAR Technologies Ltd (via NSE) · Tier 1: company or exchange filing · 6 Dec 2025
- S33Purchase order worth Rs 35.56 crore for data-centre products (international) · MTAR Technologies Ltd (via NSE) · Tier 1: company or exchange filing · 1 Apr 2026
- S3410-year long-term contract with Weatherford Products GmbH · MTAR Technologies Ltd (via NSE) · Tier 1: company or exchange filing · 19 Jun 2025
- S35Shareholding pattern as of 31 Dec 2023 (XBRL) · NSE · Tier 1: company or exchange filing · 21 Jan 2024
- S36Shareholding pattern as of 31 Mar 2024 (XBRL) · NSE · Tier 1: company or exchange filing · 20 Apr 2024
- S37Shareholding pattern as of 30 Jun 2024 (XBRL) · NSE · Tier 1: company or exchange filing · 17 Jul 2024
- S38Shareholding pattern as of 30 Sep 2024 (XBRL) · NSE · Tier 1: company or exchange filing · 8 Oct 2024
- S39Shareholding pattern as of 31 Dec 2024 (XBRL) · NSE · Tier 1: company or exchange filing · 20 Jan 2025
- S40Shareholding pattern as of 31 Mar 2025 (XBRL) · NSE · Tier 1: company or exchange filing · 16 Apr 2025
- S41Shareholding pattern as of 30 Jun 2025 (XBRL) · NSE · Tier 1: company or exchange filing · 18 Jul 2025
- S42Shareholding pattern as of 30 Sep 2025 (XBRL) · NSE · Tier 1: company or exchange filing · 17 Oct 2025
- S43Shareholding pattern as of 31 Dec 2025 (XBRL) · NSE · Tier 1: company or exchange filing · 20 Jan 2026
- S44Shareholding pattern as of 31 Mar 2026 (XBRL) · NSE · Tier 1: company or exchange filing · 13 Apr 2026
- S45Shareholding pattern as of 30 Jun 2026 (XBRL) · NSE · Tier 1: company or exchange filing · 17 Jul 2026
- S46Shareholding pattern as of 30 Sep 2026 (XBRL) · NSE · Tier 1: company or exchange filing · 14 Oct 2026
- S47Security-wise historical price data MTARTECH (EQ), 2 to 11 Nov 2026 · NSE · Tier 1: company or exchange filing · 11 Nov 2026
Changes to this page (v1 · 12 Nov 2026)
- v1 · 12 Nov 2026First version. (first version)
Numbers come only from tier 1 and tier 2 sources. Read how we research.
Disclaimer
For learning only. Cityfort is not a SEBI-registered adviser and does not recommend buying or selling any security. Prices shown are dated and may be out of date.
Investing in securities involves risk, including loss of capital. Before making any investment decision, do your own research and consider consulting a SEBI-registered investment adviser.
Cityfort, its owners and contributors may or may not hold securities of companies covered. Content is not an offer or solicitation to buy or sell any security.
Read the full disclaimerHide the full disclaimer
Cityfort publishes educational content that explains how listed companies work. Cityfort is not registered with the Securities and Exchange Board of India (SEBI) as an Investment Adviser or Research Analyst and does not provide investment advice, recommendations, ratings, price targets or any opinion on whether to buy, sell or hold any security.
All information is taken from publicly available sources, mainly company filings on BSE and NSE, which are listed on each page with dates. We work to keep it accurate and correct errors publicly, but we do not guarantee that it is complete, accurate or up to date. Any market price or price-based ratio shown is dated, may be out of date by the time you read it, and is included only to explain concepts.
Statements by company management are reported as statements, with their date and source; they are not our forecasts.