Telecommunication · NSE: INDUSTOWER · BSE: 534816
Indus Towers: how the business works
Indus Towers owns 270,480 mobile towers across India and rents space on them to telecom operators, with revenue of ₹32,493 crore in FY26.
Follow Indus Towers
Email me when Indus Towers's page is updated after results.
We store your email address with Kit, our email provider, which also records when you sign up and whether you open or click our emails. We send a confirmation email first. See our privacy policy.
Indus Towers Limited · Gurugram, Haryana · Founded 2006
Updated for Q2 FY27 · checked
- Revenue, FY26
- ₹32,493 cr
- Profit, FY26
- ₹7,145 cr
- Towers, 30 Sep 2026
- 270,480
- Incorporated
- 2006
- Promoter (Bharti Airtel), Sep 2026
- 51.26%
The short version
Indus Towers in 5 points
1 · What it sells
Indus Towers rents space on 270,480 mobile towers in India to telecom operators and bills them for powering the sites, for FY26 revenue of ₹32,493 crore.
2 · Who pays it
Telecom operators such as Bharti Airtel, Vodafone Idea, Reliance Jio and BSNL pay Indus Towers; it does not give each one's share, but its FY26 billing to its parent Bharti Airtel was ₹19,583 crore against revenue of ₹32,493 crore.
3 · What it keeps from ₹100
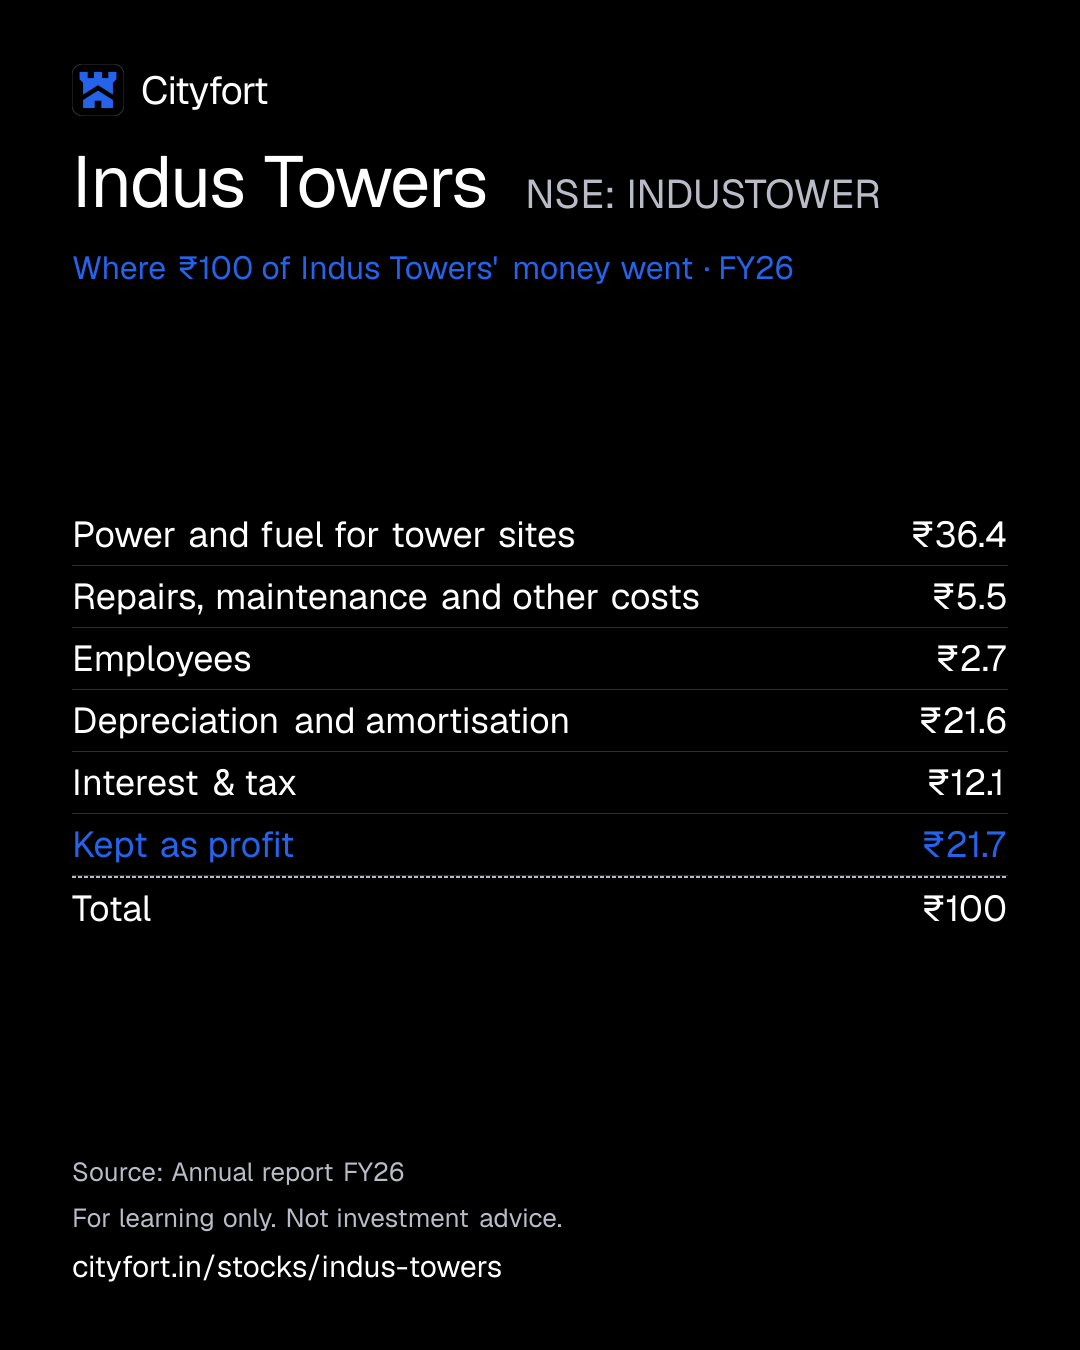
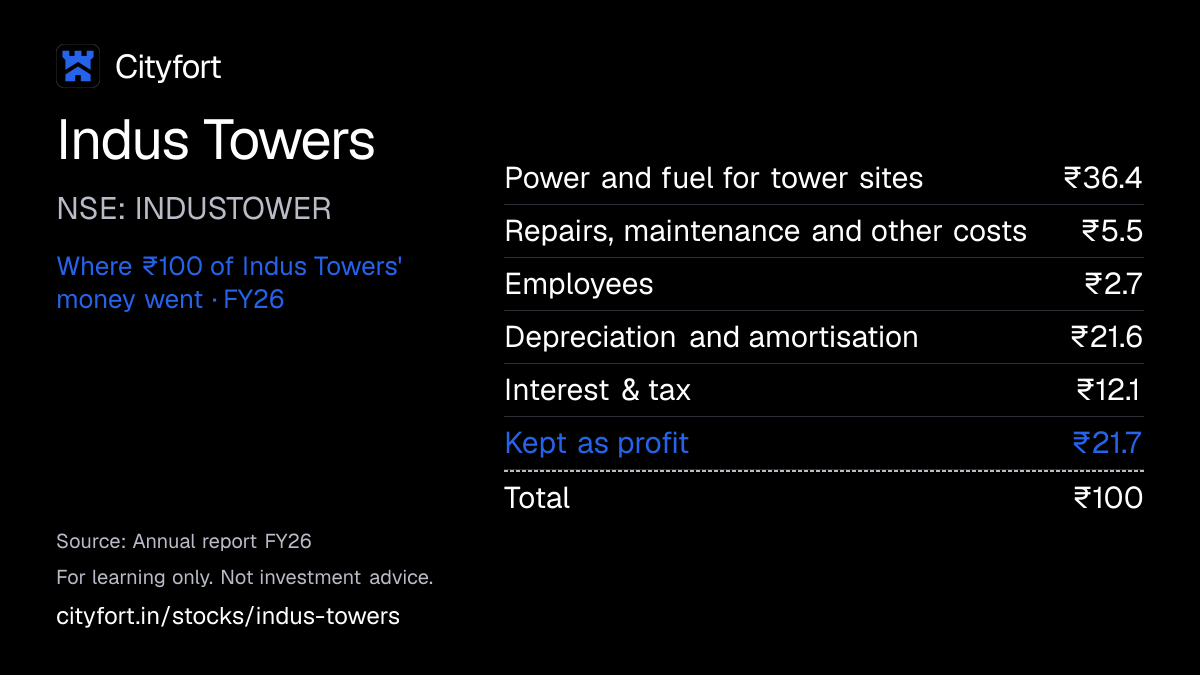
Of every ₹100 that came in during FY26, Indus Towers kept ₹21.7 as profit, after ₹36.4 on power and fuel for tower sites and ₹21.6 of depreciation and amortisation.
4 · Where the operating profit comes from
Indus Towers reports a single business; its FY26 EBITDA (profit before interest, tax, depreciation and amortisation) as Cityfort calculates it was ₹18,155 crore, or ₹55.9 of every ₹100 of revenue, against the company's own ₹17,976 crore (55.3%).
5 · The one thing to watch
Indus Towers' average sharing factor (operators per tower) was 1.80 in FY22 and 1.62 in FY26, while its towers rose from 185,447 to 264,514.
Sources: From Indus Towers' FY26 integrated annual report, its Q4 FY26 results and its Q2 FY27 quarterly report · checked
01Where the money goes · FY26
Where does ₹100 of Indus Towers' money go?
Indus Towers · FY26
Receipt for every ₹100
| Power and fuel for tower sites | ₹36.4 |
|---|---|
| Repairs, maintenance and other costs | ₹5.5 |
| Employees | ₹2.7 |
| Depreciation and amortisation | ₹21.6 |
| Interest & tax | ₹12.1 |
| Kept as profit | ₹21.7 |
| Total | ₹100 |
Each line = amount ÷ total money in × 100. Lines may not add to exactly ₹100 because of rounding.
How this is worked out
Of every ₹100 that came in during FY26 (revenue ₹32,493 crore + other income ₹477 crore = ₹32,970 crore). Interest & tax = net interest ₹1,552 crore + tax ₹2,453 crore. Rounded so the lines add to 100.
Save this receipt as an image
Embed this receipt or the key numbers
Paste this code into a blog or website to show the card you choose, with a link back to this page.
Each week: the next company due to report results, explained in 5 points.
We'll email you once a week with what changed on Cityfort. Facts only, no tips. Unsubscribe any time.
We store your email address with Kit, our email provider, which also records when you sign up and whether you open or click our emails. We send a confirmation email first. See our privacy policy.
02The business in one line
What does Indus Towers do?
Telecom operators pay Indus Towers rent to put their antennas on its towers, plus the cost of powering those sites. Most of that money goes on power and on the wear of the towers; what's left is profit.
- In FY26 operators paid ₹20,928 crore of rent and ₹11,550 crore of energy charges. Power and fuel for the sites cost ₹11,996 crore.
- A tower earns more when more operators share it. The average number of operators per tower fell from 1.80 in FY22 to 1.62 in FY26.
03Who pays it
Who pays Indus Towers?
Indus Towers does not disclose how much each type of customer pays.
Bharti Airtel and its group
The parent company (51.26%) rents tower slots for its mobile network. Related-party billing in FY26 (billed and unbilled, gross): ₹19,583 crore to Bharti Airtel and ₹1,411 crore to fellow subsidiaries such as Bharti Hexacom.
Vodafone Idea
Rents tower slots and pays an amount equal to its monthly billing. The FY26 chairman's letter says a major customer cleared overdues of about ₹5,100 crore in FY25.
Reliance Jio and BSNL
Named as customers in the FY26 annual report. Amounts are not disclosed.
How spread out the customers are
Indus Towers does not disclose revenue by customer. Its FY26 annual report says Bharti Airtel contributes a significant portion of total revenue. Gross related-party billing to Bharti Airtel was ₹19,583 crore in FY26, against revenue of ₹32,493 crore.
04How it makes money
How does Indus Towers make money?
Each tower is paid for once; every extra operator on it adds rent
Indus Towers builds a tower, then earns rent from each operator that hangs equipment on it. From FY22 to FY26 towers grew faster (185,447 to 264,514) than tenancies (335,791 to 428,014). The tower count includes about 10,093 towers bought from Airtel in Mar 2025. So operators per tower fell, and sharing revenue per tower fell from ₹80,467 to ₹66,995 a month.
Average operators per tower (sharing factor)
x1.8x1.6
FY22 to FY26
- Build or buy a tower and sign a long contract with one operator
- Add more operators to the same tower
- Each operator pays rent, with yearly increases in the contract
- Power costs are billed back to operators
- Cash pays for new towers and shareholder payouts
↺ Step 5 feeds back into step 1.
05Business segments · FY26
Which businesses make up Indus Towers?
Telecom towers
100%Indus Towers reports a single business segment: tower space and the power that comes with it. Within FY26 revenue, rent was ₹20,928 crore and energy charges ₹11,550 crore.
Revenue ₹32,493 cr
How the mix changed
- Telecom towers
Revenue by segment, FY22 to FY26.
₹ crore
See the numbers
Sources (6)
- Consolidated financial results Q4 FY22 and FY22 (XBRL)
- Consolidated financial results Q4 FY23 and FY23 (XBRL)
- Consolidated financial results Q4 FY24 and FY24 (XBRL)
- Consolidated financial results Q4 FY25 and FY25 (XBRL, integrated filing)
- Consolidated financial results Q4 FY26 and FY26 (XBRL, integrated filing)
- Integrated Annual Report FY26 (incl. BRSR)
06The numbers · Consolidated · ₹ crore
How has Indus Towers done?
Revenue
₹32,493 crFY26
Revenue grew every year, from ₹27,717 crore in FY22 to ₹32,493 crore in FY26, and was ₹8,516 crore in Q2 FY27, up 4.0% from a year earlier.
₹ crore
See the numbers
Net profit
₹7,145 crFY26
Profit moved with one customer's unpaid bills: ₹2,040 crore in FY23 after ₹5,801 crore of provisions and impairment, ₹9,932 crore in FY25 after a ₹5,077 crore write-back, and ₹7,145 crore in FY26.
₹ crore
See the numbers
Net profit for every ₹100 of revenue
₹22.0FY26
EBITDA as Cityfort calculates it was ₹53.8 of every ₹100 of revenue in FY22 and ₹55.9 in FY26 (FY23 at ₹32.3 and FY25 at ₹68.6 were moved by provisions and write-backs for one customer's dues); the company's own FY26 EBITDA was ₹17,976 crore, or 55.3%, because it moves finance income into net finance cost and leaves out charity.
Net margin: ₹ of net profit per ₹100 of revenue
See the numbers
Free cash flow
₹7,058 crFY26
Free cash flow (operating cash flow minus capex) was ₹7,058 crore in FY26, before ₹2,513 crore of tower-site lease principal payments that the cash flow statement shows under financing.
₹ crore · cash from operations minus spending on plants and equipment
See the numbers
See all yearly numbers
EBITDA = profit before interest, tax and wear-and-tear of assets. Financial year runs April to March (March year end). Net profit is the share belonging to the company's owners.
Sources (17)
- Consolidated financial results Q4 FY22 and FY22 (XBRL)
- Integrated Annual Report FY22 (NSE ZIP; PDF inside)
- Consolidated financial results Q4 FY23 and FY23 (XBRL)
- Integrated Annual Report FY24
- Consolidated financial results Q4 FY24 and FY24 (XBRL)
- Consolidated financial results Q4 FY25 and FY25 (XBRL, integrated filing)
- Integrated Annual Report FY26 (incl. BRSR)
- Consolidated financial results Q4 FY26 and FY26 (XBRL, integrated filing)
- Consolidated financial results Q3 FY24 (XBRL)
- Consolidated financial results Q1 FY25 (XBRL)
- Consolidated financial results Q2 FY25 (XBRL)
- Consolidated financial results Q3 FY25 (XBRL)
- Consolidated financial results Q1 FY26 (XBRL, integrated filing)
- Consolidated financial results Q2 FY26 (XBRL, integrated filing)
- Consolidated financial results Q3 FY26 (XBRL, integrated filing)
- Consolidated financial results Q1 FY27 (XBRL, integrated filing)
- Consolidated financial results Q2 FY27 (XBRL, integrated filing)
07Who runs it
Who runs Indus Towers, and did they deliver?
Prachur Sah
Managing Director & CEO · since 2023
On the board since 3 Jan 2023.
Dinesh Kumar Mittal
Chairman (Independent Director) · since 2024
On the board since 1 Apr 2024.
Abhishek Maheshwari
Chief Financial Officer · since 2026
CFO from 19 Aug 2026, after Vikas Poddar resigned.
Rajan Bharti Mittal
Non-Executive Director · since 2016
Non-executive, non-independent director, on the board since 27 Jan 2016.
What they said, and what happened
2 delivered · 1 too early to tell
Said on 30 Jul 2025
The board decided on 30 Jul 2025 to conserve cash in the short term and to look at shareholder payouts again later.
DeliveredWhat happened
On 30 Apr 2026 the board recommended a ₹14 a share final dividend for FY26. It was paid in Q2 FY27 (₹3,693 crore).
Said on 28 Jul 2026
MD & CEO Prachur Sah said on 28 Jul 2026 that Africa "Rollouts are expected to commence in the next quarter".
DeliveredWhat happened
The CFO said on 28 Oct 2026 that towers were deployed in Zambia and Uganda in Q2 FY27 and had started earning revenue. No tower count was given.
Said on 28 Oct 2026
CFO Abhishek Maheshwari said on 28 Oct 2026 that tower deployment in Nigeria would happen in Q3 FY27.
Too early to tellWhat happened
To be checked against the Q3 FY27 results and call.
Sources (7)
- Integrated Annual Report FY26 (incl. BRSR)
- Appointment of Abhishek Maheshwari as CFO from 19 Aug 2026
- Board decides to conserve cash in the short term (shareholder-returns committee recommendation)
- Board recommends final dividend of ₹14 per share for FY26
- Quarterly Report Q2 FY27 (KPI and results report)
- Earnings call transcript Q1 FY27 (call 28 Jul 2026)
- Earnings call transcript Q2 FY27 (call 28 Oct 2026)
08What could go wrong
What could go wrong for Indus Towers?
- Concentration
A few operators pay almost everything
India went from over 10 telecom operators to 3 major ones over the past decade, the FY24 annual report notes. The FY26 annual report says Bharti Airtel contributes a significant portion of total revenue; gross billing to Bharti Airtel was ₹19,583 crore in FY26, against revenue of ₹32,493 crore.
Watch Co-location exits each quarter (472 in Q2 FY27) and any change in Airtel's network plans.
- Cash and liquidity
Vodafone Idea's ability to pay
Indus set aside ₹5,308 crore and impaired ₹493 crore for Vodafone Idea's unpaid dues in FY23, then wrote back ₹5,077 crore in FY25 after the dues were cleared. ICRA's 27 Nov 2025 rationale calls a key customer's credit profile weak, though improving.
Watch Trade receivables (₹4,794 crore at 30 Sep 2026) and any new provisions in quarterly results.
- Demand
Fewer operators per tower
The average sharing factor fell from 1.80 in FY22 to 1.62 in FY26, and sharing revenue per tower fell from ₹80,467 to ₹66,995 a month. In the Q4 FY26 call the MD & CEO said expired tenancies of one customer are "a very small portion of the entire portfolio".
Watch The sharing factor (1.63 closing at 30 Sep 2026) and exits in each quarterly report.
- Raw-material prices
Power costs
Power and fuel cost ₹11,996 crore in FY26, slightly more than the ₹11,550 crore billed to operators for energy. Any gap between power costs and energy billing reaches profit.
Watch Power and fuel cost against energy revenue in the annual report.
- Debt
Large lease bills
Lease liabilities for tower sites were ₹20,206 crore at 31 Mar 2026, against borrowings of ₹921 crore. Lease payments (₹2,513 crore of principal in FY26) sit outside free cash flow as the page calculates it.
Watch The company's net debt including leases (₹17,516 crore at 30 Sep 2026).
- Execution
Africa is new ground
Indus has started building towers in Zambia and Uganda, with Nigeria next. In the Q3 FY26 call the CFO said Africa capital "would be debt funded". No tower count or capex has been disclosed yet.
Watch Africa tower counts, capex and debt once the company starts reporting them.
- Governance
Deals with the parent
Bharti Airtel owns 51.26% and is also the largest named customer and a seller of towers to Indus (about 10,093 towers for ₹1,921 crore in Mar 2025). Terms of such deals are set between related parties.
Watch Related-party transactions in the annual report and any shareholder approvals for new Airtel deals.
Sources (12)
- Integrated Annual Report FY24
- Integrated Annual Report FY26 (incl. BRSR)
- Quarterly Report Q2 FY27 (KPI and results report)
- Consolidated financial results Q4 FY23 and FY23 (XBRL)
- ICRA rating rationale: long-term rating upgraded to [ICRA]AAA (Stable)
- Consolidated financial results Q2 FY27 (XBRL, integrated filing)
- Pledge release on 17.98% and Vodafone sale of 18.0% stake
- Pledge release on 3.003% and Vodafone placing of its remaining 3.0%
- Earnings call transcript Q4 FY26 (call 1 May 2026)
- Earnings call transcript Q2 FY27 (call 28 Oct 2026)
- Earnings call transcript Q3 FY26 (call 3 Feb 2026)
- Shareholding pattern as of 2026-09-30 (XBRL)
09Supporters and critics
What do supporters and critics point to?
What supporters point to
- Revenue rose every year, from ₹27,717 crore in FY22 to ₹32,493 crore in FY26.
- Service contracts had 5.89 years left on average at 30 Sep 2026, with ₹119,230 crore of minimum lease payments receivable.
- Borrowings of ₹1,094 crore at 30 Sep 2026 were below cash and investments of ₹4,585 crore, and CRISIL and ICRA both rate Indus AAA.
- Co-locations rose from 415,717 to 440,153 in the year to Sep 2026, and a ₹14 dividend was paid for FY26.
What critics point to
- The average sharing factor fell from 1.80 in FY22 to 1.62 in FY26, and sharing revenue per tower fell from ₹80,467 to ₹66,995 a month.
- Bharti Airtel is the 51.26% owner, the largest named customer (₹19,583 crore billed in FY26) and a seller of towers to Indus.
- Profit has swung with one customer's payments: ₹5,801 crore of provisions and impairment in FY23, then a ₹5,077 crore write-back in FY25.
- Lease liabilities were ₹20,206 crore at 31 Mar 2026, and FY26 free cash flow of ₹7,058 crore does not subtract ₹2,513 crore of lease principal payments.
10What to watch next
What should you watch next at Indus Towers?
Next event
Q3 FY27 results (expected; Q3 FY26 results came on 2 Feb 2026)
2 Feb 2027
Expected, based on last year's date
Tenancies and exits
Indus had 440,153 co-locations on 270,480 towers at 30 Sep 2026, with a closing sharing factor of 1.63. Exits were 472 in Q2 FY27.
Africa rollout
The CFO said Nigeria deployment is due in Q3 FY27. The company has not yet disclosed Africa tower counts or capex.
Payouts and lease costs
The CFO said on 1 May 2026 there is no minimum payout. Watch the FY27 dividend decision alongside free cash flow after lease payments (₹2,513 crore of lease principal in FY26).
11Key facts
Key facts about Indus Towers
- What does Indus Towers do?
- Indus Towers builds and owns mobile phone towers and rents space on them to telecom operators. It had 270,480 towers carrying 440,153 operator tenancies (co-locations) across India's 22 telecom circles at 30 Sep 2026.
- How does Indus Towers make money?
- Indus Towers earns monthly rent from each operator on a tower, plus energy charges that recover the cost of powering the sites. In FY26 rent was ₹20,928 crore and energy charges ₹11,550 crore, out of revenue of ₹32,493 crore.
- Who are Indus Towers' customers?
- Indus Towers' customers are India's telecom operators, including Bharti Airtel, Vodafone Idea, Reliance Jio and BSNL. Indus Towers does not publish each customer's share of revenue. Its FY26 related-party billing to its parent Bharti Airtel was ₹19,583 crore, against revenue of ₹32,493 crore.
- How big is Indus Towers?
- Indus Towers reported revenue of ₹32,493 crore and profit of ₹7,145 crore in FY26 (April 2025 to March 2026). In Q2 FY27 (July to September 2026) its revenue was ₹8,516 crore and profit ₹1,793 crore.
- Who owns Indus Towers?
- Bharti Airtel, the promoter, owned 51.26% of Indus Towers at 30 Sep 2026. Domestic institutions held 22.97%, foreign institutions 21.72% and other shareholders 4.05%. No promoter shares were pledged.
- Why did Indus Towers' profit swing between FY23 and FY26?
- Indus Towers' profit fell to ₹2,040 crore in FY23 after ₹5,308 crore of provisions and a ₹493 crore impairment linked to Vodafone Idea's unpaid dues. It rose to ₹9,932 crore in FY25 when ₹5,077 crore of provisions were written back, and was ₹7,145 crore in FY26.
- Does Indus Towers pay a dividend?
- Indus Towers paid a final dividend of ₹14 a share for FY26, ₹3,693 crore in total, after its annual general meeting on 29 Jul 2026. It paid no dividend in FY24 or FY25, and bought back ₹2,640 crore of shares in Aug–Sep 2024.
- How much debt does Indus Towers have?
- Indus Towers had borrowings of ₹1,094 crore and cash and investments of ₹4,585 crore at 30 Sep 2026. Its lease liabilities for tower sites, which are not counted as borrowings, were ₹20,206 crore at 31 Mar 2026.
Sources (10)
- Quarterly Report Q2 FY27 (KPI and results report)
- Integrated Annual Report FY26 (incl. BRSR)
- Consolidated financial results Q2 FY27 (XBRL, integrated filing)
- Shareholding pattern as of 2026-09-30 (XBRL)
- Integrated Annual Report FY24
- Consolidated financial results Q4 FY23 and FY23 (XBRL)
- Pledge release on 17.98% and Vodafone sale of 18.0% stake
- Pledge release on 3.003% and Vodafone placing of its remaining 3.0%
- Board recommends final dividend of ₹14 per share for FY26
- Board approves buyback of up to 5,67,74,193 shares at ₹465 (up to ₹2,640 cr)
Terms on this page
- Capital expenditure (capex)
- Credit rating
- Dividend payout ratio
- EBITDA
- FII and DII holding
- Free cash flow
- Market capitalisation
- Net debt
- Net profit
- Operating margin
Each explains the term in plain English, with the same number from other companies on Cityfort.
Go deeper
More detail from the same filings. Open any section.
12What it sells
12What it sells
What does Indus Towers sell?
Space on towers
Slots on 270,480 towers in all 22 telecom circles at 30 Sep 2026, rented under long master service agreements (MSAs) with yearly price increases built in.
Power at the site
Indus Towers runs the power supply for operators' equipment and bills them for it: ₹11,550 crore of FY26 revenue.
Lean co-locations and indoor coverage
Smaller tenancies that the company counts separately (14,037 at 30 Sep 2026), and in-building solutions that carry mobile signal indoors.
Towers in Africa (new)
First towers went live in Zambia and Uganda in Q2 FY27, and started earning revenue; Nigeria is next. No tower count has been disclosed yet.
Think of it like this
Like the owner of a shopping building: one building, several tenants, and each tenant pays its own rent.
What it does
- Does: Builds, owns and maintains towers and rents space on them to operators
- Does: Supplies and bills power for operators' equipment at the site
- Does: Lets several operators share one tower
What it does not do
- Does not: It does not sell mobile plans or carry calls: operators own the antennas and radios on its towers
- Does not: It is no longer part-owned by Vodafone: Vodafone sold its last 3.0% on 5 Dec 2024
- Does not: It does not report each customer's share of revenue
13How the money flows
13How the money flows · FY26
How does money flow through Indus Towers?
Money in
- Revenue from operations (rent ₹20,928 crore, energy ₹11,550 crore)₹32,493 cr
- Other income₹477 cr
The company
Indus Towers
₹32,970 cr came in
Money out
- Power and fuel for tower sites₹11,996 cr
- Repairs, maintenance and other costs (after ₹256 crore of bad-debt write-backs)₹1,805 cr
- Employees₹878 cr
- Depreciation and amortisation₹7,141 cr
- Interest (finance costs ₹1,893 crore less ₹341 crore finance income)₹1,552 cr
- Tax₹2,453 cr
- Net profit₹7,145 cr
- Operators paid ₹32,493 crore in FY26: ₹20,928 crore of rent and ₹11,550 crore of energy charges. Other income added ₹477 crore.
- Power and fuel for the sites cost ₹11,996 crore, a little more than the energy charges billed.
- Repairs, maintenance and other running costs took ₹1,805 crore, and employees ₹878 crore.
- Wear and tear of towers and leased sites (depreciation) was ₹7,141 crore. Net interest was ₹1,552 crore and tax ₹2,453 crore.
- ₹7,145 crore was left as profit.
Sources (1)
14What it needs to run
14What it needs to run
What does Indus Towers need to run?
Leased tower sites
Indus leases the sites its towers stand on. Lease liabilities were ₹20,206 crore at 31 Mar 2026, and lease principal paid in FY26 was ₹2,513 crore.
Power
Power and fuel cost ₹11,996 crore in FY26, ₹36.4 of every ₹100 that came in. In May 2025 Indus agreed to take 26% of JSW Green Energy Eight, a solar power company set up to supply it.
Money to build towers
The company's own capex figure was ₹8,817 crore in FY26, of which ₹2,182 crore was maintenance and corporate spending.
People
3,891 employees on the rolls at 30 Sep 2026 run and maintain the sites.
15Competitors and what protects it
15Competitors and what protects it
Who does Indus Towers compete with?
Data Infrastructure Trust (Summit Digitel, Crest Digitel, ATC India)
A Brookfield-sponsored trust that owns the Summit Digitel and Crest Digitel tower businesses. In Jan 2024 it agreed to buy 100% of ATC India for a base price of USD 2 billion, Indus Towers' FY24 annual report says.
What protects the business
Each strength is scored 1 (weak) to 5 (strong) for the business, with the reason. It is not a rating of the share.
- Size of the tower network4 of 5
270,480 towers with 440,153 co-locations at 30 Sep 2026. ICRA estimates more than 30% of India's towers and more than 40% of tenancies (Sep 2025).
- Long contracts4 of 5
Service contracts had 5.89 years left on average at 30 Sep 2026, with ₹119,230 crore of minimum lease payments receivable. ICRA notes exit penalties in the contracts.
- Hard for operators to move3 of 5
ICRA describes high client stickiness, because moving equipment means reorganising a network. Indus still lost 472 co-locations to exits in Q2 FY27.
Weak spot
A few operators pay the bills
India went from over 10 telecom operators to 3 major ones over the past decade (FY24 annual report). The FY26 annual report says Bharti Airtel contributes a significant portion of revenue, and ICRA (27 Nov 2025) calls another key customer's credit profile weak, though improving.
16Where growth could come from
16Where growth could come from
Where could Indus Towers' growth come from?
Management said in the Q3 FY26 earnings call (3 Feb 2026): "we refrain from giving any forward-looking guidance". In the Q2 FY27 call (28 Oct 2026) the MD & CEO said "we expect the growth momentum to continue".
More tenancies in India
Working415,717 → 440,153 co-locations (Sep 2025 → Sep 2026)
Co-locations rose 5.9% in a year. In Q2 FY27 Indus added 7,903 net co-locations and lost 472 to exits.
Status: Working, on track against what the company said.
More operators on each tower
MixedClosing sharing factor 1.62 → 1.63 (Mar 2026 → Sep 2026)
The closing number of operators per tower rose slightly in H1 FY27, after falling from 1.81 at 31 Mar 2022.
Status: Mixed, partly on track.
Towers in Nigeria, Uganda and Zambia
EarlyFirst towers live in Zambia and Uganda (Q2 FY27)
The board approved the move on 2 Sep 2025. In the 28 Oct 2026 call the MD & CEO said Airtel is the primary anchor customer there, and the CFO said Nigeria rollout is due in Q3 FY27. No tower count or capex is disclosed yet.
Status: Early, too early to judge.
Cheaper power from solar
Early26% stake agreed in JSW Green Energy Eight (May 2025)
A captive solar power company set up to supply Indus; the agreement was announced on 22 May 2025.
Status: Early, too early to judge.
EV charging
NewPilots in Gurugram and Bengaluru
The board approved entering electric-vehicle charging on 23 Jan 2025, starting with pilots.
Status: New, recently announced.
Status compares progress with what the company itself said it would do: Working = on track against what the company said; Mixed = partly on track; Behind = behind the company's own plan; New = recently announced; Early = too early to judge.
Sources (8)
- Earnings call transcript Q3 FY26 (call 3 Feb 2026)
- Earnings call transcript Q2 FY27 (call 28 Oct 2026)
- Quarterly Report Q2 FY27 (KPI and results report)
- Press release: results for Q2 FY27
- Integrated Annual Report FY26 (incl. BRSR)
- Press release: Indus Towers forays into international markets (Nigeria, Uganda, Zambia)
- Agreement to acquire 26% of JSW Green Energy Eight (captive solar power SPV)
- Press release: plan to enter EV charging infrastructure
17Financial strength and debt
17Financial strength · 30 Sep 2026
How much debt does Indus Towers have?
- Total debt₹1,094 cr
- Cash and investments₹4,585 cr
- Net cash (cash minus debt)₹3,491 cr
- Net worth (shareholders' money)₹39,463 cr
- Debt to equity
- 0.03×
- ₹ of debt for every ₹1 of shareholders' money
- Borrowings leave out lease liabilities for tower sites, which were ₹20,206 crore at 31 Mar 2026.
- Cash and investments = cash and bank balances ₹172 crore + mutual fund investments ₹4,413 crore. Cash fell in Q2 FY27 because the ₹3,693 crore FY26 dividend was paid.
- The company's own net debt without leases was −₹3,436 crore (net cash) at 30 Sep 2026; its definition counts bank balances slightly differently.
18Who owns it
18Who owns it · Q2 FY27
Who owns Indus Towers?
- Promoters (founders or parent company)51.3%
- Foreign institutions (FII)21.7%
- Indian institutions (DII)23.0%
- Public and others4.1%
Promoter pledge
No promoter shares were pledged in Q2 FY27.
How ownership changed
* Pledged = share of the promoters' own holding reported as pledged. In older filings this can include shares “otherwise encumbered”; the governance flags say when.
Sources (15)
- Shareholding pattern as of 2026-09-30 (XBRL)
- Shareholding pattern as of 2026-06-30 (XBRL)
- Shareholding pattern as of 2026-03-31 (XBRL)
- Shareholding pattern as of 2025-12-31 (XBRL)
- Shareholding pattern as of 2025-09-30 (XBRL)
- Shareholding pattern as of 2025-06-30 (XBRL)
- Shareholding pattern as of 2025-03-31 (XBRL)
- Shareholding pattern as of 2024-12-31 (XBRL)
- Shareholding pattern as of 2024-09-30 (XBRL)
- Shareholding pattern as of 2024-06-30 (XBRL)
- Shareholding pattern as of 2024-03-31 (XBRL)
- Shareholding pattern as of 2023-12-31 (XBRL)
- Pledge release on 17.98% and Vodafone sale of 18.0% stake
- Pledge release on 3.003% and Vodafone placing of its remaining 3.0%
- NSE and BSE approve reclassification of Vodafone promoters to public
19What it does with profit
19What it does with profit
What does Indus Towers do with its profit?
Dividend per share
₹14.00FY26
Dividend paid for each share, by financial year.
₹ per share
See the numbers
Buyback · 31 Jul 2024
The board approved buying back up to 5,67,74,193 shares at ₹465 each. Bharti Airtel did not offer its shares, and the bought-back shares were cancelled by 4 Sep 2024.
₹2,640 cr
20Governance signals
20Governance signals
What do Indus Towers' governance filings show?
- Auditor
- Deloitte Haskins & Sells LLP
- Auditor changes
- 10 Mar 2026: Deloitte Haskins & Sells LLP → S.R. Batliboi & Associates LLP (from the 21st AGM in 2027, subject to shareholder approval) (Deloitte retires at the end of its term at the 21st AGM in 2027; the board approved the new auditor on 10 Mar 2026.)
- Audit qualifications
- None reported
- Related-party dealings
- Bharti Airtel, which owns 51.26%, is also a major customer: FY26 related-party billing was ₹19,583 crore to Airtel and ₹1,411 crore to fellow Airtel subsidiaries, and Airtel owed ₹3,711 crore at 31 Mar 2026. Indus bought about 10,093 towers from Airtel on 24 Mar 2025 for ₹1,921 crore.
- Credit rating
- CRISIL AAA (outlook Stable), 17 Jul 2026
A credit rating describes the company's ability to repay debt. It is not a rating of the share.
Flags to know about
pledge · 4 Dec 2024
Promoter shares were pledged until Dec 2024
Vodafone's promoter shares were pledged as security for Vodafone Idea's dues to Indus: 30.5% of the promoter group's holding in Dec 2023. The pledges were released in Jun and Dec 2024, and no promoter shares have been pledged since Dec 2024.
related party · 19 Nov 2024
The parent is also the largest named customer
Bharti Airtel controls Indus Towers (a subsidiary since 19 Nov 2024) and is billed ₹19,583 crore a year (FY26). Deals between the two, such as the Mar 2025 tower purchase, are related-party transactions.
disclosure
No revenue split by customer; KPI reports now India-only
The company does not give each customer's share of revenue. From Q4 FY26 its quarterly KPI reports cover India only, so their figures differ slightly from the consolidated results (Q2 FY27 revenue ₹8,515 crore against ₹8,516 crore).
Sources (10)
- Integrated Annual Report FY26 (incl. BRSR)
- Appointment of S.R. Batliboi & Associates LLP as statutory auditors from the 21st AGM (2027)
- Quarterly Report Q2 FY27 (KPI and results report)
- Update: Airtel tower purchase executed; Bharti Hexacom transfer kept in abeyance
- Update on credit ratings: CRISIL reaffirms Crisil AAA/Stable and Crisil A1+
- Shareholding pattern as of 2023-12-31 (XBRL)
- Pledge release on 17.98% and Vodafone sale of 18.0% stake
- Pledge release on 3.003% and Vodafone placing of its remaining 3.0%
- Shareholding pattern as of 2024-12-31 (XBRL)
- Quarterly Report Q4 FY26 (revised, filed 1 May 2026)
21What the market paid
21What the market paid · price as of 13 Nov 2026
What did the market pay for Indus Towers on 13 Nov 2026?
Price as of 13 Nov 2026 (shown for education; prices change daily).
Price as of 13 Nov 2026: ₹396.00, the NSE closing price. Market value = that price × 263.82 crore shares = ₹104,471 crore. P/E of 14.7 divides market value by profit in the four quarters to Sep 2026 (₹7,108 crore). P/B of 2.65 divides it by shareholders' equity of ₹39,463 crore at 30 Sep 2026. The FY26 dividend of ₹14 a share was 3.54% of that price.
- Share price
- ₹396.00
- Market value (market cap)
- ₹104,471 cr
- P/E
- 14.7×
- P/B
- 2.7×
Source: NSE historical price, volume and deliverable data, INDUSTOWER EQ, 1–14 Nov 2026; Shareholding pattern as of 2026-09-30 (XBRL); Consolidated financial results Q2 FY27 (XBRL, integrated filing) and 4 more
Sources (7)
- NSE historical price, volume and deliverable data, INDUSTOWER EQ, 1–14 Nov 2026
- Shareholding pattern as of 2026-09-30 (XBRL)
- Consolidated financial results Q2 FY27 (XBRL, integrated filing)
- Consolidated financial results Q1 FY27 (XBRL, integrated filing)
- Consolidated financial results Q4 FY26 and FY26 (XBRL, integrated filing)
- Consolidated financial results Q3 FY26 (XBRL, integrated filing)
- Board recommends final dividend of ₹14 per share for FY26
22How it got here
22How it got here
How did Indus Towers get here?
2006
Milestone
Bharti Infratel incorporated
The company was set up in 2006 as Bharti Infratel.
2007
Milestone
Original Indus Towers formed
Bharti Airtel, Vodafone India and Idea Cellular set up a separate tower joint venture called Indus Towers in Nov 2007.
2020
Business-model change
Merger and new name
Indus Towers merged into Bharti Infratel on 19 Nov 2020, and Bharti Infratel took the Indus Towers name. Vodafone Idea took ₹3,764 crore in cash for its 11.15%; Vodafone Group received 28.12% of the merged company.
2023
Crisis
Provisions for Vodafone Idea's dues
In FY23 Indus set aside ₹5,308 crore and impaired ₹493 crore for Vodafone Idea's unpaid bills, and profit fell to ₹2,040 crore.
2024
Business-model change
Vodafone exits and Airtel takes control
Vodafone sold 18.0% on 19 Jun 2024 and its last 3.0% on 5 Dec 2024. After a buyback, Airtel held 50% and Indus became its subsidiary on 19 Nov 2024.
2024
Milestone
Supreme Court tax ruling
On 20 Nov 2024 the Supreme Court allowed CENVAT tax credit on towers, cutting the company's contingent liability by ₹3,704 crore.
2025
Milestone
Towers bought from Airtel
On 24 Mar 2025 Indus bought about 10,093 towers from Bharti Airtel for ₹1,921 crore after closing adjustments. The Bharti Hexacom part of the deal was put on hold.
2025
Business-model change
Move into Africa
On 2 Sep 2025 the board approved entering Nigeria, Uganda and Zambia. The first towers in Zambia and Uganda went live in Q2 FY27.
2026
Milestone
Dividend resumes
On 30 Apr 2026 the board recommended a ₹14 a share final dividend for FY26, the first since the ₹11 a share interim dividend declared on 5 May 2022 for FY22.
Sources (11)
- Quarterly Report Q2 FY27 (KPI and results report)
- Integrated Annual Report FY24
- Consolidated financial results Q4 FY23 and FY23 (XBRL)
- Pledge release on 17.98% and Vodafone sale of 18.0% stake
- Pledge release on 3.003% and Vodafone placing of its remaining 3.0%
- Supreme Court allows CENVAT credit on towers; contingent liability falls by ₹3,704 cr
- Integrated Annual Report FY26 (incl. BRSR)
- Update: Airtel tower purchase executed; Bharti Hexacom transfer kept in abeyance
- Press release: Indus Towers forays into international markets (Nigeria, Uganda, Zambia)
- Earnings call transcript Q2 FY27 (call 28 Oct 2026)
- Board recommends final dividend of ₹14 per share for FY26
23Sources and changes
Where every number on this page comes from
Sources (53 documents)
- S1Integrated Annual Report FY26 (incl. BRSR) · Indus Towers Ltd (filed with NSE/BSE) · Tier 1: company or exchange filing · 28 Jul 2026
- S3Integrated Annual Report FY24 · Indus Towers Ltd (filed with NSE/BSE) · Tier 1: company or exchange filing · 7 Aug 2024
- S4Integrated Annual Report FY22 (NSE ZIP; PDF inside) · Indus Towers Ltd (filed with NSE/BSE) · Tier 1: company or exchange filing · 1 Aug 2022
- S5Consolidated financial results Q2 FY27 (XBRL, integrated filing) · Indus Towers Ltd (filed with NSE/BSE) · Tier 1: company or exchange filing · 27 Oct 2026
- S6Consolidated financial results Q1 FY27 (XBRL, integrated filing) · Indus Towers Ltd (filed with NSE/BSE) · Tier 1: company or exchange filing · 27 Jul 2026
- S7Consolidated financial results Q4 FY26 and FY26 (XBRL, integrated filing) · Indus Towers Ltd (filed with NSE/BSE) · Tier 1: company or exchange filing · 30 Apr 2026
- S8Consolidated financial results Q3 FY26 (XBRL, integrated filing) · Indus Towers Ltd (filed with NSE/BSE) · Tier 1: company or exchange filing · 2 Feb 2026
- S9Consolidated financial results Q2 FY26 (XBRL, integrated filing) · Indus Towers Ltd (filed with NSE/BSE) · Tier 1: company or exchange filing · 27 Oct 2025
- S10Consolidated financial results Q1 FY26 (XBRL, integrated filing) · Indus Towers Ltd (filed with NSE/BSE) · Tier 1: company or exchange filing · 30 Jul 2025
- S11Consolidated financial results Q4 FY25 and FY25 (XBRL, integrated filing) · Indus Towers Ltd (filed with NSE/BSE) · Tier 1: company or exchange filing · 30 Apr 2025
- S12Consolidated financial results Q3 FY25 (XBRL) · Indus Towers Ltd (filed with NSE/BSE) · Tier 1: company or exchange filing · 24 Jan 2025
- S13Consolidated financial results Q2 FY25 (XBRL) · Indus Towers Ltd (filed with NSE/BSE) · Tier 1: company or exchange filing · 23 Oct 2024
- S14Consolidated financial results Q1 FY25 (XBRL) · Indus Towers Ltd (filed with NSE/BSE) · Tier 1: company or exchange filing · 31 Jul 2024
- S15Consolidated financial results Q4 FY24 and FY24 (XBRL) · Indus Towers Ltd (filed with NSE/BSE) · Tier 1: company or exchange filing · 1 May 2024
- S16Consolidated financial results Q3 FY24 (XBRL) · Indus Towers Ltd (filed with NSE/BSE) · Tier 1: company or exchange filing · 24 Jan 2024
- S17Consolidated financial results Q4 FY23 and FY23 (XBRL) · Indus Towers Ltd (filed with NSE/BSE) · Tier 1: company or exchange filing · 27 Apr 2023
- S18Consolidated financial results Q4 FY22 and FY22 (XBRL) · Indus Towers Ltd (filed with NSE/BSE) · Tier 1: company or exchange filing · 6 May 2022
- S20Press release: results for Q2 FY27 · Indus Towers Ltd (filed with NSE/BSE) · Tier 1: company or exchange filing · 27 Oct 2026
- S22Quarterly Report Q2 FY27 (KPI and results report) · Indus Towers Ltd (filed with NSE/BSE) · Tier 1: company or exchange filing · 27 Oct 2026
- S24Quarterly Report Q4 FY26 (revised, filed 1 May 2026) · Indus Towers Ltd (filed with NSE/BSE) · Tier 1: company or exchange filing · 1 May 2026
- S26Earnings call transcript Q2 FY27 (call 28 Oct 2026) · Indus Towers Ltd (filed with NSE/BSE) · Tier 1: company or exchange filing · 2 Nov 2026
- S27Earnings call transcript Q1 FY27 (call 28 Jul 2026) · Indus Towers Ltd (filed with NSE/BSE) · Tier 1: company or exchange filing · 3 Aug 2026
- S28Earnings call transcript Q4 FY26 (call 1 May 2026) · Indus Towers Ltd (filed with NSE/BSE) · Tier 1: company or exchange filing · 8 May 2026
- S29Earnings call transcript Q3 FY26 (call 3 Feb 2026) · Indus Towers Ltd (filed with NSE/BSE) · Tier 1: company or exchange filing · 9 Feb 2026
- S30Shareholding pattern as of 2026-09-30 (XBRL) · Indus Towers Ltd (filed with NSE/BSE) · Tier 1: company or exchange filing · 21 Oct 2026
- S31Shareholding pattern as of 2026-06-30 (XBRL) · Indus Towers Ltd (filed with NSE/BSE) · Tier 1: company or exchange filing · 21 Jul 2026
- S32Shareholding pattern as of 2026-03-31 (XBRL) · Indus Towers Ltd (filed with NSE/BSE) · Tier 1: company or exchange filing · 21 Apr 2026
- S33Shareholding pattern as of 2025-12-31 (XBRL) · Indus Towers Ltd (filed with NSE/BSE) · Tier 1: company or exchange filing · 21 Jan 2026
- S34Shareholding pattern as of 2025-09-30 (XBRL) · Indus Towers Ltd (filed with NSE/BSE) · Tier 1: company or exchange filing · 20 Oct 2025
- S35Shareholding pattern as of 2025-06-30 (XBRL) · Indus Towers Ltd (filed with NSE/BSE) · Tier 1: company or exchange filing · 21 Jul 2025
- S36Shareholding pattern as of 2025-03-31 (XBRL) · Indus Towers Ltd (filed with NSE/BSE) · Tier 1: company or exchange filing · 21 Apr 2025
- S37Shareholding pattern as of 2024-12-31 (XBRL) · Indus Towers Ltd (filed with NSE/BSE) · Tier 1: company or exchange filing · 21 Jan 2025
- S38Shareholding pattern as of 2024-09-30 (XBRL) · Indus Towers Ltd (filed with NSE/BSE) · Tier 1: company or exchange filing · 21 Oct 2024
- S39Shareholding pattern as of 2024-06-30 (XBRL) · Indus Towers Ltd (filed with NSE/BSE) · Tier 1: company or exchange filing · 20 Jul 2024
- S40Shareholding pattern as of 2024-03-31 (XBRL) · Indus Towers Ltd (filed with NSE/BSE) · Tier 1: company or exchange filing · 19 Apr 2024
- S41Shareholding pattern as of 2023-12-31 (XBRL) · Indus Towers Ltd (filed with NSE/BSE) · Tier 1: company or exchange filing · 20 Jan 2024
- S42ICRA rating rationale: long-term rating upgraded to [ICRA]AAA (Stable) · ICRA Ltd · Tier 2: rating agency or regulator · 27 Nov 2025
- S43Update on credit ratings: CRISIL reaffirms Crisil AAA/Stable and Crisil A1+ · Indus Towers Ltd (filed with NSE/BSE) · Tier 1: company or exchange filing · 18 Jul 2026
- S44Board recommends final dividend of ₹14 per share for FY26 · Indus Towers Ltd (filed with NSE/BSE) · Tier 1: company or exchange filing · 30 Apr 2026
- S45Board decides to conserve cash in the short term (shareholder-returns committee recommendation) · Indus Towers Ltd (filed with NSE/BSE) · Tier 1: company or exchange filing · 30 Jul 2025
- S47Press release: Indus Towers forays into international markets (Nigeria, Uganda, Zambia) · Indus Towers Ltd (filed with NSE/BSE) · Tier 1: company or exchange filing · 2 Sep 2025
- S50Update: Airtel tower purchase executed; Bharti Hexacom transfer kept in abeyance · Indus Towers Ltd (filed with NSE/BSE) · Tier 1: company or exchange filing · 9 Apr 2025
- S51Pledge release on 17.98% and Vodafone sale of 18.0% stake · Indus Towers Ltd (filed with NSE/BSE) · Tier 1: company or exchange filing · 19 Jun 2024
- S52Pledge release on 3.003% and Vodafone placing of its remaining 3.0% · Indus Towers Ltd (filed with NSE/BSE) · Tier 1: company or exchange filing · 4 Dec 2024
- S54NSE and BSE approve reclassification of Vodafone promoters to public · Indus Towers Ltd (filed with NSE/BSE) · Tier 1: company or exchange filing · 16 May 2025
- S55Board approves buyback of up to 5,67,74,193 shares at ₹465 (up to ₹2,640 cr) · Indus Towers Ltd (filed with NSE/BSE) · Tier 1: company or exchange filing · 31 Jul 2024
- S56Post-buyback public announcement · Indus Towers Ltd (filed with NSE/BSE) · Tier 1: company or exchange filing · 30 Aug 2024
- S57Supreme Court allows CENVAT credit on towers; contingent liability falls by ₹3,704 cr · Indus Towers Ltd (filed with NSE/BSE) · Tier 1: company or exchange filing · 20 Nov 2024
- S58Appointment of S.R. Batliboi & Associates LLP as statutory auditors from the 21st AGM (2027) · Indus Towers Ltd (filed with NSE/BSE) · Tier 1: company or exchange filing · 10 Mar 2026
- S59Appointment of Abhishek Maheshwari as CFO from 19 Aug 2026 · Indus Towers Ltd (filed with NSE/BSE) · Tier 1: company or exchange filing · 10 Jul 2026
- S60Press release: plan to enter EV charging infrastructure · Indus Towers Ltd (filed with NSE/BSE) · Tier 1: company or exchange filing · 23 Jan 2025
- S61Agreement to acquire 26% of JSW Green Energy Eight (captive solar power SPV) · Indus Towers Ltd (filed with NSE/BSE) · Tier 1: company or exchange filing · 22 May 2025
- S62NSE historical price, volume and deliverable data, INDUSTOWER EQ, 1–14 Nov 2026 · National Stock Exchange of India · Tier 1: company or exchange filing · 13 Nov 2026
Changes to this page (v1 · 16 Nov 2026)
- v1 · 16 Nov 2026First version. (first version)
Numbers come only from tier 1 and tier 2 sources. Read how we research.
Disclaimer
For learning only. Cityfort is not a SEBI-registered adviser and does not recommend buying or selling any security. Prices shown are dated and may be out of date.
Investing in securities involves risk, including loss of capital. Before making any investment decision, do your own research and consider consulting a SEBI-registered investment adviser.
Cityfort, its owners and contributors may or may not hold securities of companies covered. Content is not an offer or solicitation to buy or sell any security.
Read the full disclaimerHide the full disclaimer
Cityfort publishes educational content that explains how listed companies work. Cityfort is not registered with the Securities and Exchange Board of India (SEBI) as an Investment Adviser or Research Analyst and does not provide investment advice, recommendations, ratings, price targets or any opinion on whether to buy, sell or hold any security.
All information is taken from publicly available sources, mainly company filings on BSE and NSE, which are listed on each page with dates. We work to keep it accurate and correct errors publicly, but we do not guarantee that it is complete, accurate or up to date. Any market price or price-based ratio shown is dated, may be out of date by the time you read it, and is included only to explain concepts.
Statements by company management are reported as statements, with their date and source; they are not our forecasts.