Automobile and Auto Components · NSE: M&M · BSE: 500520
Mahindra & Mahindra: how the business works
Mahindra & Mahindra makes SUVs, pickups and tractors and owns 52.51% of lender Mahindra Finance; FY26 revenue was ₹197,793 crore.
Follow Mahindra & Mahindra
Email me when Mahindra & Mahindra's page is updated after results.
We store your email address with Kit, our email provider, which also records when you sign up and whether you open or click our emails. We send a confirmation email first. See our privacy policy.
Mahindra and Mahindra Limited · Mumbai, Maharashtra · Founded 1945
Updated for Q2 FY27 · checked
- Revenue, FY26
- ₹197,793 cr
- Profit to shareholders, FY26
- ₹17,099 cr
- Tractors sold, FY26
- 526,403
- Incorporated
- 1945
- Promoter group holding, 30 Sep 2026
- 18.39%
The short version
Mahindra & Mahindra in 5 points
1 · What it sells
Mahindra & Mahindra makes SUVs, pickups, electric three-wheelers and tractors and lends through 52.51%-owned Mahindra Finance, and its FY26 revenue was ₹197,793 crore.
2 · Who pays it
In FY26, vehicle buyers paid about 58% of M&M's segment revenue, farmers 21%, Mahindra Finance's borrowers 10% and customers of its other businesses 11%.
3 · What it keeps from ₹100
Of every ₹100 that came in during FY26, M&M kept ₹8.4 as profit for its shareholders, a figure that includes other income, its share of Tech Mahindra's and other part-owned companies' profit and a ₹293 crore one-off labour-code charge, after ₹60.2 for materials and ₹4.7 for interest, mostly Mahindra Finance's.
4 · Where the operating profit comes from
Automotive earned ₹10,383 crore of M&M's ₹23,384 crore FY26 segment profit, or 44.4%, while Farm Equipment earned ₹5,517 crore and Financial Services ₹3,779 crore.
5 · The one thing to watch
M&M sold 116,027 tractors in Q2 FY27, 6% fewer than a year earlier, and on 5 Nov 2026 management cut its FY27 tractor industry outlook from about 5% growth to flattish.
Sources: From M&M's FY26 and Q2 FY27 results filings, its FY26 and Q2 FY27 press releases and its 5 Nov 2026 earnings call · checked
Sources (4)
- Audited standalone and consolidated financial results, quarter and year ended 31 Mar 2026 (Q4 FY26), with dividend recommendation
- Integrated Annual Report 2025-26 (FY26), incl. standalone and consolidated financial statements
- Press release: M&M results Q2 F27
- Transcript of analyst meet / earnings call Q2 F27 (held 5 Nov 2026)
01Where the money goes · FY26
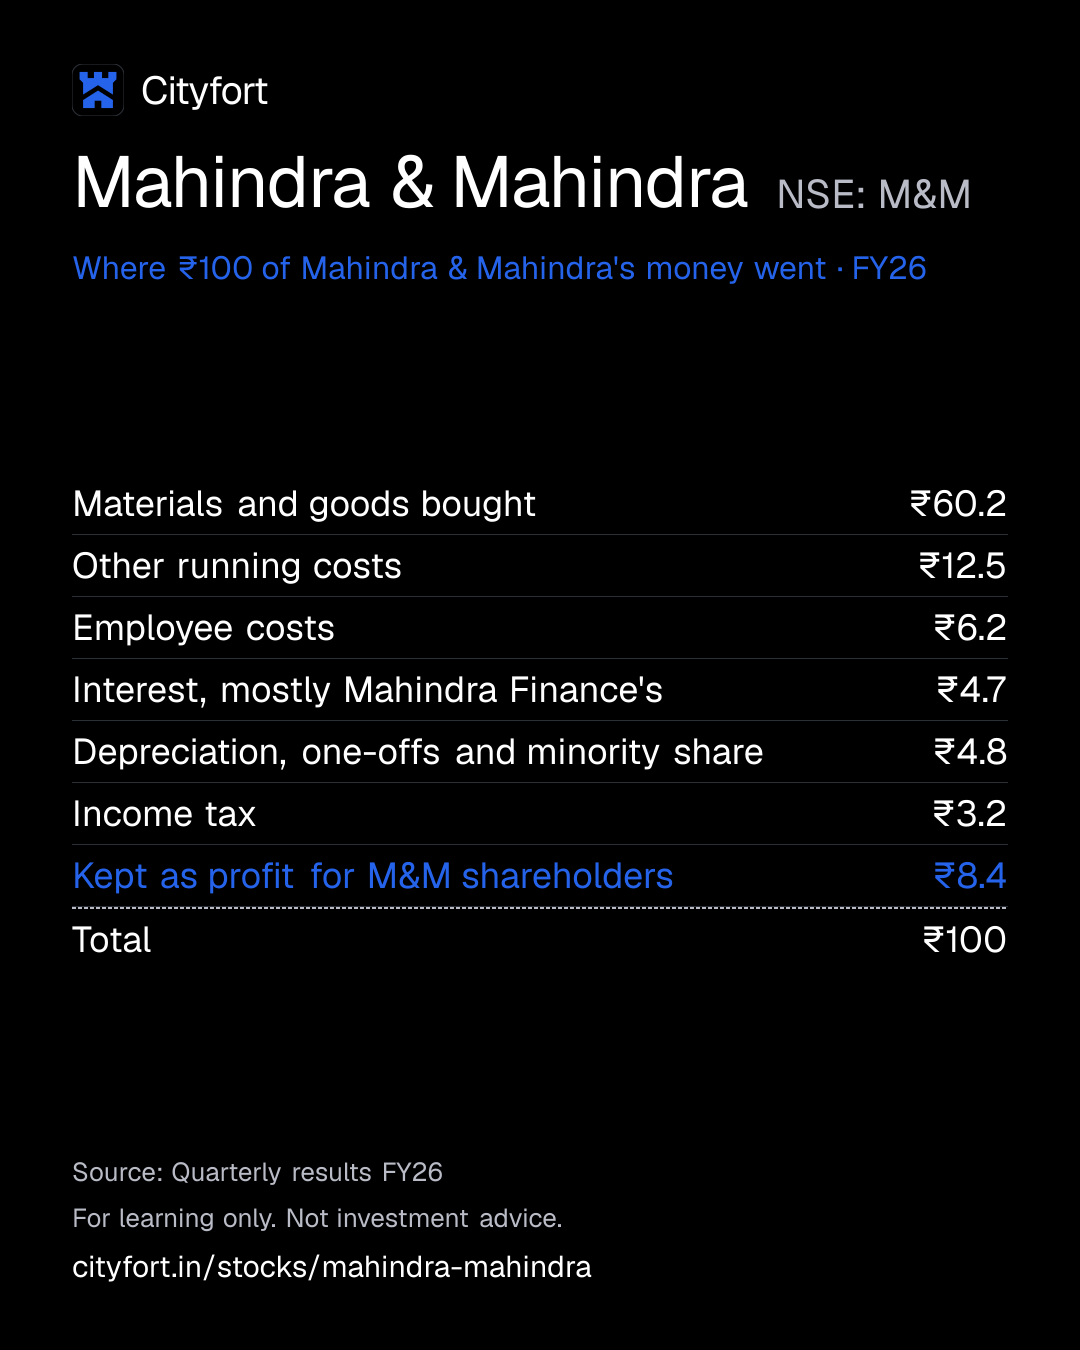
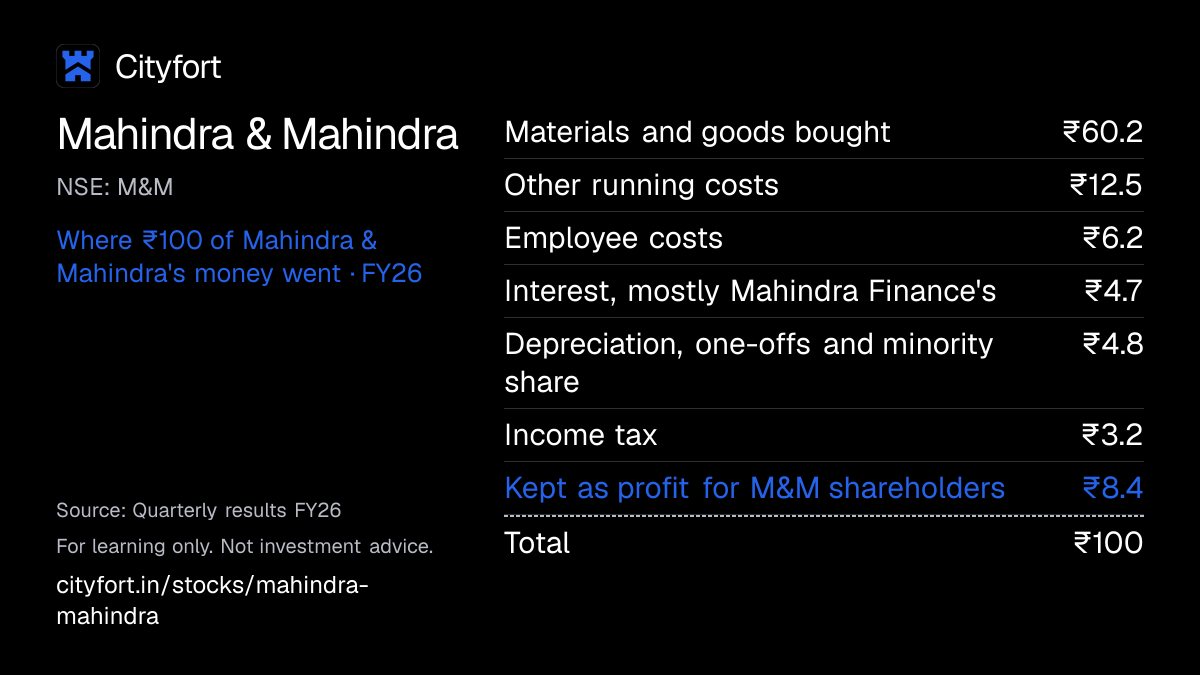
Where does ₹100 of Mahindra & Mahindra's money go?
Mahindra & Mahindra · FY26
Receipt for every ₹100
| Materials and goods bought | ₹60.2 |
|---|---|
| Other running costs | ₹12.5 |
| Employee costs | ₹6.2 |
| Interest, mostly Mahindra Finance's | ₹4.7 |
| Depreciation, one-offs and minority share | ₹4.8 |
| Income tax | ₹3.2 |
| Kept as profit for M&M shareholders | ₹8.4 |
| Total | ₹100 |
Each line = amount ÷ total money in × 100. Lines may not add to exactly ₹100 because of rounding.
How this is worked out
Cityfort calculation from the Q4 FY26 results filing: each line ÷ total money in during FY26 (revenue ₹197,793 crore + other income ₹3,446 crore + investment income and share of part-owned companies' profit ₹2,811 crore = ₹204,050 crore). The depreciation line also holds a ₹293 crore one-off labour-code charge, ₹582 crore of investment losses and ₹1,523 crore of profit belonging to minority shareholders of subsidiaries.
Save this receipt as an image
Embed this receipt or the key numbers
Paste this code into a blog or website to show the card you choose, with a link back to this page.
Each week: the next company due to report results, explained in 5 points.
We'll email you once a week with what changed on Cityfort. Facts only, no tips. Unsubscribe any time.
We store your email address with Kit, our email provider, which also records when you sign up and whether you open or click our emails. We send a confirmation email first. See our privacy policy.
02The business in one line
What does Mahindra & Mahindra do?
Vehicle buyers, farmers and borrowers pay M&M for SUVs, tractors and loans; materials take ₹60 of every ₹100 that comes in, and ₹8.4 is profit.
- Vehicles were 58% of M&M's FY26 segment revenue and earned 44% of segment profit. Tractors were 21% of revenue and earned 24% of profit.
- M&M owns 52.51% of Mahindra Finance but counts all of it. So the lender's loans, borrowings and ₹8,919 crore of FY26 interest cost sit in the group's numbers.
03Who pays it
Who pays Mahindra & Mahindra?
Vehicle buyers
57.7%
of revenue
Individuals, companies and small businesses buying SUVs, pickups, three-wheelers, trucks and buses, plus spares. Share is of FY26 segment revenue (Automotive).
Farmers and farm businesses
20.9%
of revenue
Buy tractors, implements and spares (Farm Equipment segment).
Borrowers
10.3%
of revenue
Pay interest on Mahindra Finance's retail, small-business and housing loans (Financial Services segment).
Customers of the other businesses
11.1%
of revenue
Buyers of homes, holidays, logistics, clean energy and other services (Industrial Businesses and Consumer Services segment).
- Vehicle buyers57.7%
- Farmers and farm businesses20.9%
- Borrowers10.3%
- Customers of the other businesses11.1%
How spread out the customers are
Shares are of FY26 segment revenue before removing ₹5,462 crore of sales between M&M's own businesses. The documents collected do not report revenue by customer.
04How it makes money
How does Mahindra & Mahindra make money?
Scale in SUVs and tractors earns most of the profit; the lending arm adds profit and most of the debt.
In FY26 Automotive kept ₹8.8 of every ₹100 of segment revenue as segment profit. Tractors kept ₹13.0 and Financial Services ₹18.0. As SUV sales grew, Automotive's profit per ₹100 rose from ₹8.0 in FY24.
Automotive segment profit per ₹100 of segment revenue
₹8.0₹8.8
FY24 to FY26
- Buyers pay for SUVs, pickups and tractors.
- Bigger SUV plants spread fixed costs: capacity reached 64,500 a month at the end of FY26.
- Automotive kept ₹8.8 per ₹100 of segment revenue in FY26, up from ₹8.0 in FY24.
- Tractors kept ₹13.0 per ₹100, but tractor demand follows the monsoon.
- Mahindra Finance lends and earns interest; it paid ₹8,919 crore of interest in FY26.
- Profit pays for new models and plants: ₹9,605 crore of capital spending in FY26.
↺ Step 6 feeds back into step 1.
05Business segments · FY26
Which businesses make up Mahindra & Mahindra?
Automotive
57.7%SUVs, pickups, trucks and buses, three-wheelers, spares and construction equipment; SML Mahindra from 1 Aug 2025.
Revenue ₹117,834 cr · Operating profit ₹10,383 cr
Farm Equipment
20.9%Tractors (Mahindra, Swaraj, Trakstar), implements, spares and Powerol.
Revenue ₹42,568 cr · Operating profit ₹5,517 cr
Financial Services
10.3%Mahindra Finance: retail, small-business and housing loans, mutual funds and insurance broking.
Revenue ₹20,949 cr · Operating profit ₹3,779 cr
Industrial Businesses and Consumer Services
11.1%Real estate, holidays, logistics, renewables, steel trading, defence and more, plus the share of Tech Mahindra's profit.
Revenue ₹22,749 cr · Operating profit ₹3,705 cr
How the mix changed
- Automotive
- Farm Equipment
- Financial Services
- Industrial Businesses and Consumer Services
Revenue by segment, FY24 to FY26.
₹ crore
See the numbers
06The numbers · Consolidated · ₹ crore
How has Mahindra & Mahindra done?
Revenue
₹197,793 crFY26
Revenue rose every year, from ₹90,171 crore in FY22 to ₹197,793 crore in FY26; it includes Mahindra Finance's interest income, and SML Mahindra from 1 Aug 2025.
₹ crore
See the numbers
Net profit
₹17,099 crFY26
Profit for shareholders rose from ₹6,577 crore in FY22 to ₹17,099 crore in FY26; FY23 includes a ₹1,250 crore net one-off gain, 12.2% of that year's profit.
₹ crore
See the numbers
Net profit for every ₹100 of revenue
₹8.6FY26
Mahindra & Mahindra kept between ₹7.3 and ₹8.6 of profit per ₹100 of revenue each year from FY22 to FY26; the EBITDA margin in the table adds back Mahindra Finance's interest, a lender's main cost.
Net margin: ₹ of net profit per ₹100 of revenue
See the numbers
Free cash flow
₹2,052 crFY26
Cash from operations was negative in FY23 and FY24 because growth in Mahindra Finance's loans (₹18,797 crore and ₹19,887 crore) counts as an operating outflow.
₹ crore · cash from operations minus spending on plants and equipment
See the numbers
See all yearly numbers
EBITDA = profit before interest, tax and wear-and-tear of assets. Financial year runs April to March (March year end). Net profit is the share belonging to the company's owners. Total net income differs from net profit to the company's owners: total profit includes the share of minority shareholders in subsidiaries such as Mahindra Finance (52.51% owned), ₹1,523 crore in FY26.
Sources (7)
- Audited standalone and consolidated financial results, quarter and year ended 31 Mar 2023 (Q4 FY23), with dividend recommendation
- Audited standalone and consolidated financial results, quarter and year ended 31 Mar 2024 (Q4 FY24), with dividend recommendation
- Audited standalone and consolidated financial results, quarter and year ended 31 Mar 2025 (Q4 FY25), with dividend recommendation
- Audited standalone and consolidated financial results, quarter and year ended 31 Mar 2026 (Q4 FY26), with dividend recommendation
- Unaudited standalone and consolidated financial results, quarter and nine months ended 31 Dec 2025 (Q3 FY26)
- Unaudited standalone and consolidated financial results, quarter ended 30 Jun 2026 (Q1 FY27)
- Unaudited standalone and consolidated financial results, quarter and half year ended 30 Sep 2026 (Q2 FY27), with limited review reports
07Who runs it
Who runs Mahindra & Mahindra, and did they deliver?
Anand G. Mahindra
Chairman (non-executive)
Dr Anish Shah
Group CEO & Managing Director
Rajesh Jejurikar
Executive Director & CEO, Auto and Farm
Amarjyoti Barua
Group Chief Financial Officer
Sailesh Kumar Daga
Company Secretary
What they said, and what happened
1 delivered · 4 too early to tell
Said on 5 May 2026
Management said on the Q4 FY26 call that in fiscal 2021 it had promised 15–20% yearly growth in earnings per share.
DeliveredWhat happened
Consolidated basic EPS rose from ₹59.20 in FY22 to ₹153.10 in FY26, about 26.8% a year (Cityfort calculation from the FY22 and FY26 results).
Said on 5 May 2026
Keep return on equity at 18% while growing.
Too early to tellWhat happened
ROE was 20.1% in FY26. The 5 Nov 2026 deck gives an annualised 21.0% for H1 FY27.
Said on 5 Nov 2026
Raise SUV capacity to 82,000 a month by the end of FY27, including 14,000 for FY28 launches.
Too early to tellWhat happened
The deck says capacity reached 68,000 a month at the end of H1 FY27.
Said on 5 Nov 2026
Five big launches by the end of Jun 2027.
Too early to tellWhat happened
Not yet reported.
Said on 29 Jul 2026
Complete the sale of the truck and bus division to SML Mahindra for ₹525 crore by 31 Jan 2027.
Too early to tellWhat happened
On 30 Sep 2026 the division's assets and liabilities were shown as held for sale in M&M's own accounts.
Sources (9)
- Integrated Annual Report 2025-26 (FY26), incl. standalone and consolidated financial statements
- Press release: M&M results Q2 F27
- Transcript of analyst meet / earnings call Q4 F26 (held 5 May 2026)
- Audited standalone and consolidated financial results, quarter and year ended 31 Mar 2023 (Q4 FY23), with dividend recommendation
- Audited standalone and consolidated financial results, quarter and year ended 31 Mar 2026 (Q4 FY26), with dividend recommendation
- Press release: M&M results Q4 and full year F26
- Analyst and press meet presentation, Q2 F27 (5 Nov 2026)
- Board approval: slump sale of the Truck and Bus division (MTBD) to SML Mahindra Ltd for Rs 525 crore
- Unaudited standalone and consolidated financial results, quarter and half year ended 30 Sep 2026 (Q2 FY27), with limited review reports
08What could go wrong
What could go wrong for Mahindra & Mahindra?
- Demand
Tractor demand depends on the monsoon
On 5 Nov 2026 management cut its FY27 tractor industry outlook from about 5% to flattish. It cited a monsoon at 87% of normal and droughts in Maharashtra and Karnataka.
Watch Tractor sales each quarter (116,027 in Q2 FY27, down 6%).
- Competition
Competition in SUVs and electric vehicles
CARE names intense competition in utility vehicles, and an electric-vehicle shift that needs continuous investment, as risks. M&M's SUV revenue share was 24.3% in Q2 FY27, against 25.3% in FY26.
Watch SUV revenue market share in each results press release.
- Raw-material prices
Steel and other material costs
Materials and goods bought took ₹60.2 of every ₹100 that came in during FY26. M&M named commodity cost increases in its Q2 FY27 results.
Watch EBITDA margin each quarter (18.6% in Q2 FY27, against 20.5% a year earlier).
- Debt
Lending risk at Mahindra Finance
Group borrowings were ₹149,385 crore on 30 Sep 2026, mostly for Mahindra Finance's loans. M&M said Mahindra Finance's gross stage 3 (bad) loans were 3.42% in Q2 FY27. CARE notes M&M's support of group companies, including Mahindra Finance.
Watch Mahindra Finance's stage 3 loans and the Financial Services segment profit each quarter.
- Demand
Weak farm markets abroad
On the 5 Nov 2026 call management said tractor industries had fallen in the US (15%), Brazil (18%) and Turkey (36%). M&M has farm subsidiaries abroad that are under stress.
Watch Farm Equipment segment profit each quarter.
- Regulation
New end-of-life vehicle rules
The End-of-Life Vehicle Rules 2025 give vehicle makers extended producer responsibility (duties for old vehicles to be recycled). M&M says it is unable to reliably estimate the impact.
Watch Notes on the rules in the results filings.
- Execution
Several group deals at once
M&M is selling its truck and bus division to SML Mahindra. It may put up to about ₹1,450 crore into SML Mahindra's rights issue. Outside investors are also coming into Mahindra Last Mile Mobility.
Watch Completion of the truck and bus sale by 31 Jan 2027.
- Governance
Small promoter stake, with a small pledge
The promoter group (the founding shareholders and their companies, as named in the filings) held 18.39% on 30 Sep 2026. It held 19.32% in Dec 2023. 40,000 of its shares (0.02%) were pledged.
Watch Promoter holding and pledged shares in each shareholding pattern.
Sources (12)
- Transcript of analyst meet / earnings call Q2 F27 (held 5 Nov 2026)
- Press release: M&M results Q2 F27
- CARE Ratings press release: CARE AAA; Stable / CARE A1+ reaffirmed (filed by M&M with the exchanges, 4 Nov 2026)
- Press release: M&M results Q4 and full year F26
- Audited standalone and consolidated financial results, quarter and year ended 31 Mar 2026 (Q4 FY26), with dividend recommendation
- Unaudited standalone and consolidated financial results, quarter and half year ended 30 Sep 2026 (Q2 FY27), with limited review reports
- Analyst and press meet presentation, Q2 F27 (5 Nov 2026)
- Board approval: slump sale of the Truck and Bus division (MTBD) to SML Mahindra Ltd for Rs 525 crore
- Approval to subscribe to the SML Mahindra Ltd rights issue (issue up to Rs 1,450 crore)
- Proposed fund raise by Mahindra Last Mile Mobility Ltd (~Rs 322 crore) at a post-money valuation of ~Rs 10,822 crore
- Shareholding pattern as of 30 Sep 2026 (XBRL, Reg 31)
- Shareholding pattern as of 31 Dec 2023 (XBRL, Reg 31)
09Supporters and critics
What do supporters and critics point to?
What supporters point to
- Profit for shareholders rose 32.3% in FY26 to ₹17,099 crore, on revenue up 24.6%.
- M&M says it had 25.3% of India's SUV revenue, 52.3% of light commercial vehicles under 3.5 tonnes and 43.6% of tractors in FY26.
- Excluding financial services, debt-to-equity was 0.03 on 30 Sep 2026. CARE and Crisil rate M&M AAA/Stable.
- Return on equity was 20.1% in FY26.
- The dividend rose from ₹11.55 a share for FY22 to ₹33.00 for FY26.
What critics point to
- Tractor sales fell 6% in Q2 FY27, and management cut its FY27 tractor industry outlook to flattish.
- Group cash from operations was −₹673 crore in H1 FY27, and was negative in FY23 and FY24, as Mahindra Finance's lending grew.
- Group borrowings rose from ₹129,615 crore on 31 Mar 2026 to ₹149,385 crore on 30 Sep 2026.
- M&M's SUV revenue share was 24.3% in Q2 FY27 and its electric three-wheeler share 36.2%, below FY26's 25.3% and 40.0%.
- Q1 FY27 profit included a ₹641 crore gain from selling an associate stake, which lifts that quarter's growth.
10What to watch next
What should you watch next at Mahindra & Mahindra?
Next event
Q3 FY27 results
Date not announced yet.
Tractor sales after a weak monsoon
Management cut its FY27 tractor industry outlook to flattish on 5 Nov 2026. Q2 FY27 tractor sales were 116,027, down 6%.
Truck and bus sale to SML Mahindra
The ₹525 crore sale is due to close by 31 Jan 2027. M&M also approved putting up to about ₹1,450 crore into SML Mahindra's rights issue.
Mahindra Finance's loans and group cash
Group cash from operations was −₹673 crore in H1 FY27, after ₹13,482 crore of growth in financial services loans. Borrowings reached ₹149,385 crore on 30 Sep 2026.
11Key facts
Key facts about Mahindra & Mahindra
- What does Mahindra & Mahindra do?
- Mahindra & Mahindra Ltd, based in Mumbai, makes SUVs, pickups, electric three-wheelers, trucks and tractors. Mahindra & Mahindra also owns 52.51% of the lender Mahindra & Mahindra Financial Services (Mahindra Finance). Its FY26 consolidated revenue from operations was ₹197,793 crore.
- How does Mahindra & Mahindra make money?
- Mahindra & Mahindra makes most of its money from vehicles. In FY26 its Automotive segment was 57.7% of segment revenue and earned ₹10,383 crore, or 44.4%, of ₹23,384 crore segment profit. Tractors and farm machinery earned 23.6% of Mahindra & Mahindra's FY26 segment profit.
- Who are Mahindra & Mahindra's customers?
- Mahindra & Mahindra's FY26 sustainability report (BRSR) lists individuals in towns and villages, government agencies, companies, small businesses and farm businesses as customers. The documents collected give no revenue split by customer. Exports were 4.11% of Mahindra & Mahindra's standalone FY26 turnover.
- How big is Mahindra & Mahindra?
- In FY26 Mahindra & Mahindra's consolidated revenue from operations was ₹197,793 crore and profit for shareholders was ₹17,099 crore. Mahindra & Mahindra sold 1,117,698 vehicles, including sales by Mahindra Last Mile Mobility and Mahindra Electric Automobile, and 526,403 tractors in FY26.
- Who owns Mahindra & Mahindra?
- On 30 Sep 2026 Mahindra & Mahindra's promoter group held 18.39%, foreign investors 33.35%, Indian institutions 34.24%, two employee trusts 3.45%, and individuals and others 10.57%. These percentages leave out the 2.16 crore shares held behind global depositary receipts (GDRs).
- Does Mahindra & Mahindra include Mahindra Finance in its results?
- Yes. Mahindra & Mahindra owned 52.51% of Mahindra Finance on 31 Mar 2026 and counts all of its revenue, loans and borrowings. Mahindra Finance's interest cost of ₹8,919 crore was 93% of Mahindra & Mahindra's FY26 finance costs of ₹9,591 crore.
- Does Mahindra & Mahindra own Tech Mahindra?
- Mahindra & Mahindra owned 28.06% of Tech Mahindra on 31 Mar 2026, so Tech Mahindra is an associate, not a subsidiary. Only Mahindra & Mahindra's share of Tech Mahindra's profit is in its results, not Tech Mahindra's revenue.
- How much debt does Mahindra & Mahindra have?
- On 31 Mar 2026 Mahindra & Mahindra's group borrowings were ₹129,615 crore, mostly funding Mahindra Finance's loans. Excluding financial services, Mahindra & Mahindra's debt-to-equity ratio was 0.04, according to its FY26 results. CARE reaffirmed its AAA/Stable rating on 4 Nov 2026.
- What dividend did Mahindra & Mahindra pay for FY26?
- Mahindra & Mahindra declared a dividend of ₹33.00 per share for FY26, up from ₹25.30 for FY25. That was 21.6% of Mahindra & Mahindra's FY26 consolidated basic earnings per share of ₹153.10.
Sources (7)
- Audited standalone and consolidated financial results, quarter and year ended 31 Mar 2026 (Q4 FY26), with dividend recommendation
- Integrated Annual Report 2025-26 (FY26), incl. standalone and consolidated financial statements
- Business Responsibility and Sustainability Report FY26 (standalone M&M Ltd)
- Press release: M&M results Q4 and full year F26
- Shareholding pattern as of 30 Sep 2026 (XBRL, Reg 31)
- CARE Ratings press release: CARE AAA; Stable / CARE A1+ reaffirmed (filed by M&M with the exchanges, 4 Nov 2026)
- Audited standalone and consolidated financial results, quarter and year ended 31 Mar 2025 (Q4 FY25), with dividend recommendation
Terms on this page
- Capital expenditure (capex)
- Credit rating
- Dividend payout ratio
- EBITDA
- FII and DII holding
- Free cash flow
- Market capitalisation
- Net debt
- Net profit
- Operating margin
Each explains the term in plain English, with the same number from other companies on Cityfort.
Go deeper
More detail from the same filings. Open any section.
12What it sells
12What it sells
What does Mahindra & Mahindra sell?
SUVs
Utility vehicles, including electric SUVs. M&M says it had 25.3% of India's SUV revenue in FY26, and 30.1% of electric SUV revenue in Q2 FY27.
Pickups and small trucks
Light commercial vehicles under 3.5 tonnes. M&M says its share of this market was 52.3% in FY26.
Electric three-wheelers and last-mile vehicles
Sold by Mahindra Last Mile Mobility (78.11% owned on 31 Mar 2026): 136,855 vehicles in FY26. M&M put its electric three-wheeler share at 40.0% in FY26.
Trucks and buses
M&M's own truck and bus division, plus SML Mahindra (a subsidiary since 1 Aug 2025, 58.97% owned on 31 Mar 2026). The division is being sold to SML Mahindra for ₹525 crore.
Tractors and farm machinery
Tractors under the Mahindra, Swaraj and Trakstar brands, plus implements, spares and Powerol. M&M sold 526,403 tractors in FY26 and says its share was 43.6%.
Loans (Mahindra Finance)
Mahindra & Mahindra Financial Services (52.51% owned) makes retail, small-business and housing loans, and runs mutual fund and insurance broking businesses.
Other businesses
Real estate (Mahindra Lifespace, 52.41%), holidays (Mahindra Holidays & Resorts, 66.87%), logistics (Mahindra Logistics, 59.58%), renewable energy (Mahindra Susten, 60.01%, accounted as a joint venture, so only its share of profit counts), steel trading and defence.
Stake in Tech Mahindra
M&M owns 28.06% of IT services firm Tech Mahindra. Only its share of Tech Mahindra's profit counts in M&M's results.
What it does
- Does: Makes SUVs, pickups, electric three-wheelers, trucks and buses in India
- Does: Makes tractors under three brands: Mahindra, Swaraj and Trakstar
- Does: Lends money through Mahindra Finance, which it owns 52.51% of
- Does: Owns majority stakes in listed property, holiday and logistics companies
What it does not do
- Does not: Count Tech Mahindra's revenue: it owns 28.06%, so only its share of profit is included
- Does not: Own all of Mahindra Finance, even though it counts all of its revenue, loans and debt
- Does not: Count income from its investments in group companies as revenue on this page; the company's own 'revenue' figure includes it
- Does not: Have a majority owner: the promoter group held 18.39% on 30 Sep 2026
Sources (5)
- Press release: M&M results Q4 and full year F26
- Press release: M&M results Q2 F27
- Integrated Annual Report 2025-26 (FY26), incl. standalone and consolidated financial statements
- Board approval: slump sale of the Truck and Bus division (MTBD) to SML Mahindra Ltd for Rs 525 crore
- Audited standalone and consolidated financial results, quarter and year ended 31 Mar 2026 (Q4 FY26), with dividend recommendation
13How the money flows
13How the money flows · FY26
How does money flow through Mahindra & Mahindra?
Money in
- Revenue from operations₹197,793 cr
- Investment income and share of part-owned companies' profit, incl. Tech Mahindra₹2,811 cr
- Other income₹3,446 cr
The company
Mahindra & Mahindra
₹204,050 cr came in
Money out
- Materials and goods bought₹122,922 cr
- Other running costs₹25,424 cr
- Employee costs₹12,731 cr
- Interest (₹8,919 crore of it Mahindra Finance's)₹9,591 cr
- Depreciation, one-offs, investment losses and minority partners' share₹9,719 cr
- Income tax₹6,563 cr
- Net profit for M&M shareholders₹17,099 cr
- In FY26 M&M's businesses brought in ₹197,793 crore of revenue, plus ₹3,446 crore of other income.
- Investment income and its share of part-owned companies' profit, including Tech Mahindra, added ₹2,811 crore.
- Materials and goods bought took ₹122,922 crore. Other running costs took ₹25,424 crore and employees ₹12,731 crore.
- Interest took ₹9,591 crore, of which ₹8,919 crore was Mahindra Finance's cost of the money it lends. Income tax took ₹6,563 crore.
- After depreciation, one-offs and the share of minority partners in subsidiaries, ₹17,099 crore was left for M&M's shareholders.
14What it needs to run
14What it needs to run
What does Mahindra & Mahindra need to run?
Plants
M&M itself has 55 plants in India and 24 abroad, according to its FY26 sustainability report (BRSR).
SUV capacity
SUV capacity was 64,500 a month at the end of FY26 and 68,000 at the end of H1 FY27, the company says.
People
M&M itself had 17,083 employees and 74,810 workers at the end of FY26, including 64,687 workers who are not permanent.
Steel and other materials
Materials and goods bought took ₹60.2 of every ₹100 that came in during FY26. M&M named commodity cost increases in its Q2 FY27 results.
Borrowed money to lend
Mahindra Finance borrows to make loans. Group borrowings were ₹149,385 crore on 30 Sep 2026, most of it for financial services.
Sources (5)
- Business Responsibility and Sustainability Report FY26 (standalone M&M Ltd)
- Analyst and press meet presentation, Q2 F27 (5 Nov 2026)
- Audited standalone and consolidated financial results, quarter and year ended 31 Mar 2026 (Q4 FY26), with dividend recommendation
- Press release: M&M results Q2 F27
- Unaudited standalone and consolidated financial results, quarter and half year ended 30 Sep 2026 (Q2 FY27), with limited review reports
15Where growth could come from
15Where growth could come from
Where could Mahindra & Mahindra's growth come from?
On the 5 Nov 2026 call management restated its aim of 15–20% EPS growth and 18% return on equity: "15% to 20% EPS growth and 18% RoE is what we continue to stay as a commitment." It kept its FY27 outlook of mid-to-high-teens growth for its SUVs. It cut its FY27 tractor industry outlook from about 5% to flattish.
SUVs
WorkingAutomotive revenue +29.7%, FY26
Automotive segment revenue rose from ₹90,825 crore in FY25 to ₹117,834 crore in FY26; SML Mahindra was added from 1 Aug 2025. M&M said Q2 FY27 Automotive revenue rose 39% to ₹37,756 crore.
Status: Working, on track against what the company said.
Electric cars
Working51,820 sold in FY26, against 8,048 in FY25
Mahindra Electric Automobile sold 51,820 battery electric vehicles in FY26. M&M put its share of electric SUV revenue at 30.1% in Q2 FY27.
Status: Working, on track against what the company said.
Last-mile mobility
Mixed136,855 vehicles in FY26 (+25.9%)
Mahindra Last Mile Mobility sold 136,855 vehicles in FY26, up from 108,661. Its electric three-wheeler share was 36.2% in Q2 FY27, against 40.0% in FY26. Investors agreed on 30 Jul 2026 to put in about ₹322 crore at a value of about ₹10,822 crore.
Status: Mixed, partly on track.
Trucks and buses
New6.7% market share, H1 FY27
SML Mahindra became a subsidiary on 1 Aug 2025, and M&M's truck and bus division is being sold to it for ₹525 crore. The 5 Nov 2026 deck aims for the top 3 in India's intermediate and light trucks and buses.
Status: New, recently announced.
Tractors
MixedTractor sales −6%, Q2 FY27
M&M sold 526,403 tractors in FY26, up 24.0% from 424,641. In Q2 FY27 it sold 116,027, 6% fewer than a year earlier; the company cited a shift in the festive season.
Status: Mixed, partly on track.
Status compares progress with what the company itself said it would do: Working = on track against what the company said; Mixed = partly on track; Behind = behind the company's own plan; New = recently announced; Early = too early to judge.
Sources (8)
- Transcript of analyst meet / earnings call Q2 F27 (held 5 Nov 2026)
- Analyst and press meet presentation, Q2 F27 (5 Nov 2026)
- Audited standalone and consolidated financial results, quarter and year ended 31 Mar 2026 (Q4 FY26), with dividend recommendation
- Integrated Annual Report 2025-26 (FY26), incl. standalone and consolidated financial statements
- Press release: M&M results Q2 F27
- Press release: M&M results Q4 and full year F26
- Proposed fund raise by Mahindra Last Mile Mobility Ltd (~Rs 322 crore) at a post-money valuation of ~Rs 10,822 crore
- Board approval: slump sale of the Truck and Bus division (MTBD) to SML Mahindra Ltd for Rs 525 crore
16Financial strength and debt
16Financial strength · 31 Mar 2026
How much debt does Mahindra & Mahindra have?
- Total debt₹129,615 cr
- Cash and investments₹52,783 cr
- Net debt (debt minus cash)₹76,831 cr
- Net worth (shareholders' money)₹109,491 cr
- Debt to equity
- 1.18×
- ₹ of debt for every ₹1 of shareholders' money
- Excluding financial services, M&M's results filings give debt-to-equity of 0.04 on 31 Mar 2026 and 0.03 on 30 Sep 2026. It was 0.15 on 31 Mar 2023.
- The Financial Services segment carried ₹131,591 crore of liabilities on 31 Mar 2026. The group's balance sheet held ₹140,317 crore of loans to customers, mostly Mahindra Finance's.
- On 30 Sep 2026 borrowings were ₹149,385 crore, and cash, bank balances and current investments ₹66,499 crore.
- Cash and short-term investments = cash, other bank balances and current investments. Lease liabilities were a further ₹4,349 crore, and preference shares counted as debt ₹2,973 crore.
- CARE's 4 Nov 2026 report puts FY26 interest cover for M&M excluding Mahindra Finance at 35.36 times.
- Net worth is total equity, including ₹16,395 crore that belongs to minority shareholders of subsidiaries. Equity of M&M's own shareholders was ₹93,096 crore. Debt to equity of 1.18 = borrowings ÷ total equity.
Sources (5)
- Audited standalone and consolidated financial results, quarter and year ended 31 Mar 2026 (Q4 FY26), with dividend recommendation
- Unaudited standalone and consolidated financial results, quarter and half year ended 30 Sep 2026 (Q2 FY27), with limited review reports
- Audited standalone and consolidated financial results, quarter and year ended 31 Mar 2024 (Q4 FY24), with dividend recommendation
- Audited standalone and consolidated financial results, quarter and year ended 31 Mar 2023 (Q4 FY23), with dividend recommendation
- CARE Ratings press release: CARE AAA; Stable / CARE A1+ reaffirmed (filed by M&M with the exchanges, 4 Nov 2026)
17Who owns it
17Who owns it · Q2 FY27
Who owns Mahindra & Mahindra?
- Promoters (founders or parent company)18.4%
- Foreign institutions (FII)33.4%
- Indian institutions (DII)34.2%
- Public and others14.0%
Promoter shares pledged
0.0% of promoter shares
A pledge means promoters gave shares as security for a loan. If the loan isn't repaid, the lender can sell them.
How ownership changed
* Pledged = share of the promoters' own holding reported as pledged. In older filings this can include shares “otherwise encumbered”; the governance flags say when.
† Others = Employee trusts (M&M ESOP Trust and M&M Benefit Trust).
Sources (12)
- Shareholding pattern as of 31 Dec 2023 (XBRL, Reg 31)
- Shareholding pattern as of 31 Mar 2024 (XBRL, Reg 31)
- Shareholding pattern as of 30 Jun 2024 (XBRL, Reg 31)
- Shareholding pattern as of 30 Sep 2024 (XBRL, Reg 31)
- Shareholding pattern as of 31 Dec 2024 (XBRL, Reg 31)
- Shareholding pattern as of 31 Mar 2025 (XBRL, Reg 31)
- Shareholding pattern as of 30 Jun 2025 (XBRL, Reg 31)
- Shareholding pattern as of 30 Sep 2025 (XBRL, Reg 31)
- Shareholding pattern as of 31 Dec 2025 (XBRL, Reg 31)
- Shareholding pattern as of 31 Mar 2026 (XBRL, Reg 31)
- Shareholding pattern as of 30 Jun 2026 (XBRL, Reg 31)
- Shareholding pattern as of 30 Sep 2026 (XBRL, Reg 31)
18What it does with profit
18What it does with profit
What does Mahindra & Mahindra do with its profit?
Dividend per share
₹33.00FY26
Dividend paid for each share, by financial year.
₹ per share
See the numbers
No buybacks or fund raises in the period covered.
Sources (5)
- Integrated Annual Report 2021-22 (FY22) (NSE zip; PDF inside)
- Audited standalone and consolidated financial results, quarter and year ended 31 Mar 2023 (Q4 FY23), with dividend recommendation
- Audited standalone and consolidated financial results, quarter and year ended 31 Mar 2024 (Q4 FY24), with dividend recommendation
- Audited standalone and consolidated financial results, quarter and year ended 31 Mar 2025 (Q4 FY25), with dividend recommendation
- Audited standalone and consolidated financial results, quarter and year ended 31 Mar 2026 (Q4 FY26), with dividend recommendation
19Governance signals
19Governance signals
What do Mahindra & Mahindra's governance filings show?
- Auditor
- B S R & Co. LLP
- Auditor changes
- None in the period covered
- Audit qualifications
- None reported
- Related-party dealings
- M&M's FY26 annual report discloses its related-party transactions, for example ₹12,413.01 crore of goods sold to its subsidiary Mahindra Electric Automobile. Inside the group, the board approved selling the truck and bus division to subsidiary SML Mahindra for ₹525 crore on 29 Jul 2026. On 6 Nov 2026 M&M approved putting up to about ₹1,450 crore into SML Mahindra's rights issue.
- Credit rating
- CARE Ratings (Crisil also rates it AAA/Stable, 18 Sep 2026) AAA (long term), A1+ (short term) (outlook Stable), 4 Nov 2026
A credit rating describes the company's ability to repay debt. It is not a rating of the share.
Flags to know about
disclosure · 31 Mar 2026
Mahindra Finance is inside the group numbers
M&M owns 52.51% of Mahindra Finance but counts all of its revenue, loans, borrowings and interest. Mahindra Finance's interest was ₹8,919 crore of the group's ₹9,591 crore FY26 finance costs.
pledge · 30 Sep 2026
Small promoter pledge
40,000 promoter-group shares were pledged on 30 Sep 2026, 0.02% of the promoter group's holding. The older shareholding format showed 140,000 shares (0.06%) pledged or encumbered until Sep 2024.
disclosure · 16 May 2024
Segment history starts in FY24
M&M reports four segments from FY24. Its re-presented FY23 segment revenue includes ₹3,056 crore of one-off gains, and FY22 used six older segments, so this page shows segments from FY24.
related party · 29 Jul 2026
Truck and bus sale within the group
On 29 Jul 2026 the board approved selling the truck and bus division to SML Mahindra, a 58.97%-owned subsidiary, for ₹525 crore. The division's FY26 total income was ₹2,989 crore.
Sources (12)
- Integrated Annual Report 2025-26 (FY26), incl. standalone and consolidated financial statements
- Integrated Annual Report 2021-22 (FY22) (NSE zip; PDF inside)
- Board approval: slump sale of the Truck and Bus division (MTBD) to SML Mahindra Ltd for Rs 525 crore
- Approval to subscribe to the SML Mahindra Ltd rights issue (issue up to Rs 1,450 crore)
- CARE Ratings press release: CARE AAA; Stable / CARE A1+ reaffirmed (filed by M&M with the exchanges, 4 Nov 2026)
- Crisil Ratings rationale: Crisil AAA/Stable/Crisil A1+ reaffirmed (filed by M&M, 18 Sep 2026)
- Audited standalone and consolidated financial results, quarter and year ended 31 Mar 2026 (Q4 FY26), with dividend recommendation
- Shareholding pattern as of 30 Sep 2026 (XBRL, Reg 31)
- Shareholding pattern as of 30 Sep 2024 (XBRL, Reg 31)
- Shareholding pattern as of 31 Dec 2024 (XBRL, Reg 31)
- Audited standalone and consolidated financial results, quarter and year ended 31 Mar 2024 (Q4 FY24), with dividend recommendation
- Audited standalone and consolidated financial results, quarter and year ended 31 Mar 2023 (Q4 FY23), with dividend recommendation
20What the market paid
20What the market paid · price as of 11 Nov 2026
What did the market pay for Mahindra & Mahindra on 11 Nov 2026?
Price as of 11 Nov 2026 (shown for education; prices change daily).
Price as of 11 Nov 2026: the NSE closing price was ₹3,465.00. Market value = that price × 124.35 crore issued shares, including those behind GDRs, or about ₹430,883 crore (Cityfort calculation from NSE price data and the Sep 2026 shareholding pattern). P/E (price ÷ earnings per share) of 22.6 means the price was 22.6 times M&M's FY26 consolidated basic earnings per share of ₹153.10. On the four quarters to Q2 FY27 (₹173.46 a share) it was 20.0.
- Share price
- ₹3,465.00
- Market value (market cap)
- ₹430,883 cr
- P/E
- 22.6×
Source: NSE historical price data, M&M (EQ series), 28 Oct to 11 Nov 2026 (daily closing prices); Shareholding pattern as of 30 Sep 2026 (XBRL, Reg 31); Audited standalone and consolidated financial results, quarter and year ended 31 Mar 2026 (Q4 FY26), with dividend recommendation and 1 more
Sources (4)
- NSE historical price data, M&M (EQ series), 28 Oct to 11 Nov 2026 (daily closing prices)
- Shareholding pattern as of 30 Sep 2026 (XBRL, Reg 31)
- Audited standalone and consolidated financial results, quarter and year ended 31 Mar 2026 (Q4 FY26), with dividend recommendation
- Unaudited standalone and consolidated financial results, quarter and half year ended 30 Sep 2026 (Q2 FY27), with limited review reports
21How it got here
21How it got here
How did Mahindra & Mahindra get here?
1945
Milestone
Incorporated in 1945
M&M was incorporated in 1945, according to its corporate identity number.
1998
Milestone
Mahindra Finance a subsidiary
Mahindra & Mahindra Financial Services has been a subsidiary since 30 Sep 1998. It now makes M&M a lender as well as a maker.
2012
Milestone
Tech Mahindra an associate
IT services firm Tech Mahindra has been an associate since 31 Aug 2012. M&M owned 28.06% on 31 Mar 2026.
2022
Business-model change
Electric car company set up
Mahindra Electric Automobile, which sells M&M's electric passenger vehicles, became a subsidiary on 25 Oct 2022.
2023
Business-model change
Last-mile mobility company
Mahindra Last Mile Mobility, which sells electric three-wheelers and small pickups, became a subsidiary on 29 May 2023.
2025
Business-model change
SML Isuzu bought
SML Isuzu became a subsidiary on 1 Aug 2025 and was renamed SML Mahindra. M&M owned 58.97% on 31 Mar 2026.
2026
Milestone
Outside investors in last-mile mobility
On 30 Jul 2026 Mahindra Last Mile Mobility agreed to raise about ₹322 crore at a value of about ₹10,822 crore. M&M's stake is to fall from 78.11% to 75.79%.
2026
Business-model change
Trucks and buses moved to SML Mahindra
On 29 Jul 2026 the board approved selling M&M's truck and bus division to SML Mahindra for ₹525 crore.
Sources (5)
- Unaudited standalone and consolidated financial results, quarter and half year ended 30 Sep 2026 (Q2 FY27), with limited review reports
- CARE Ratings press release: CARE AAA; Stable / CARE A1+ reaffirmed (filed by M&M with the exchanges, 4 Nov 2026)
- Integrated Annual Report 2025-26 (FY26), incl. standalone and consolidated financial statements
- Proposed fund raise by Mahindra Last Mile Mobility Ltd (~Rs 322 crore) at a post-money valuation of ~Rs 10,822 crore
- Board approval: slump sale of the Truck and Bus division (MTBD) to SML Mahindra Ltd for Rs 525 crore
22Sources and changes
Where every number on this page comes from
Sources (33 documents)
- S1Integrated Annual Report 2025-26 (FY26), incl. standalone and consolidated financial statements · Mahindra & Mahindra Ltd (filed with NSE/BSE; downloaded from NSE archives) · Tier 1: company or exchange filing · 4 Jul 2026
- S5Integrated Annual Report 2021-22 (FY22) (NSE zip; PDF inside) · Mahindra & Mahindra Ltd (filed with NSE/BSE; downloaded from NSE archives) · Tier 1: company or exchange filing · 4 Jul 2022
- S6Unaudited standalone and consolidated financial results, quarter and half year ended 30 Sep 2026 (Q2 FY27), with limited review reports · Mahindra & Mahindra Ltd (filed with NSE/BSE; downloaded from NSE archives) · Tier 1: company or exchange filing · 5 Nov 2026
- S7Unaudited standalone and consolidated financial results, quarter ended 30 Jun 2026 (Q1 FY27) · Mahindra & Mahindra Ltd (filed with NSE/BSE; downloaded from NSE archives) · Tier 1: company or exchange filing · 30 Jul 2026
- S8Audited standalone and consolidated financial results, quarter and year ended 31 Mar 2026 (Q4 FY26), with dividend recommendation · Mahindra & Mahindra Ltd (filed with NSE/BSE; downloaded from NSE archives) · Tier 1: company or exchange filing · 5 May 2026
- S9Unaudited standalone and consolidated financial results, quarter and nine months ended 31 Dec 2025 (Q3 FY26) · Mahindra & Mahindra Ltd (filed with NSE/BSE; downloaded from NSE archives) · Tier 1: company or exchange filing · 11 Feb 2026
- S10Audited standalone and consolidated financial results, quarter and year ended 31 Mar 2025 (Q4 FY25), with dividend recommendation · Mahindra & Mahindra Ltd (filed with NSE/BSE; downloaded from NSE archives) · Tier 1: company or exchange filing · 5 May 2025
- S11Audited standalone and consolidated financial results, quarter and year ended 31 Mar 2024 (Q4 FY24), with dividend recommendation · Mahindra & Mahindra Ltd (filed with NSE/BSE; downloaded from NSE archives) · Tier 1: company or exchange filing · 16 May 2024
- S12Audited standalone and consolidated financial results, quarter and year ended 31 Mar 2023 (Q4 FY23), with dividend recommendation · Mahindra & Mahindra Ltd (filed with NSE/BSE; downloaded from NSE archives) · Tier 1: company or exchange filing · 26 May 2023
- S13Press release: M&M results Q2 F27 · Mahindra & Mahindra Ltd (filed with NSE/BSE; downloaded from NSE archives) · Tier 1: company or exchange filing · 5 Nov 2026
- S15Press release: M&M results Q4 and full year F26 · Mahindra & Mahindra Ltd (filed with NSE/BSE; downloaded from NSE archives) · Tier 1: company or exchange filing · 5 May 2026
- S17Analyst and press meet presentation, Q2 F27 (5 Nov 2026) · Mahindra & Mahindra Ltd (filed with NSE/BSE; downloaded from NSE archives) · Tier 1: company or exchange filing · 5 Nov 2026
- S19Transcript of analyst meet / earnings call Q2 F27 (held 5 Nov 2026) · Mahindra & Mahindra Ltd (filed with NSE/BSE; downloaded from NSE archives) · Tier 1: company or exchange filing · 11 Nov 2026
- S21Transcript of analyst meet / earnings call Q4 F26 (held 5 May 2026) · Mahindra & Mahindra Ltd (filed with NSE/BSE; downloaded from NSE archives) · Tier 1: company or exchange filing · 8 May 2026
- S23CARE Ratings press release: CARE AAA; Stable / CARE A1+ reaffirmed (filed by M&M with the exchanges, 4 Nov 2026) · CARE Ratings Ltd (CareEdge), via M&M exchange filing · Tier 2: rating agency or regulator · 4 Nov 2026
- S24Crisil Ratings rationale: Crisil AAA/Stable/Crisil A1+ reaffirmed (filed by M&M, 18 Sep 2026) · Crisil Ratings Ltd, via M&M exchange filing · Tier 2: rating agency or regulator · 18 Sep 2026
- S25Business Responsibility and Sustainability Report FY26 (standalone M&M Ltd) · Mahindra & Mahindra Ltd (filed with NSE/BSE; downloaded from NSE archives) · Tier 1: company or exchange filing · 4 Jul 2026
- S26Board approval: slump sale of the Truck and Bus division (MTBD) to SML Mahindra Ltd for Rs 525 crore · Mahindra & Mahindra Ltd (filed with NSE/BSE; downloaded from NSE archives) · Tier 1: company or exchange filing · 29 Jul 2026
- S27Proposed fund raise by Mahindra Last Mile Mobility Ltd (~Rs 322 crore) at a post-money valuation of ~Rs 10,822 crore · Mahindra & Mahindra Ltd (filed with NSE/BSE; downloaded from NSE archives) · Tier 1: company or exchange filing · 30 Jul 2026
- S28Approval to subscribe to the SML Mahindra Ltd rights issue (issue up to Rs 1,450 crore) · Mahindra & Mahindra Ltd (filed with NSE/BSE; downloaded from NSE archives) · Tier 1: company or exchange filing · 6 Nov 2026
- S29Shareholding pattern as of 30 Sep 2026 (XBRL, Reg 31) · Mahindra & Mahindra Ltd (filed with NSE; NSE XBRL archive) · Tier 1: company or exchange filing · 16 Oct 2026
- S30Shareholding pattern as of 30 Jun 2026 (XBRL, Reg 31) · Mahindra & Mahindra Ltd (filed with NSE; NSE XBRL archive) · Tier 1: company or exchange filing · 20 Jul 2026
- S31Shareholding pattern as of 31 Mar 2026 (XBRL, Reg 31) · Mahindra & Mahindra Ltd (filed with NSE; NSE XBRL archive) · Tier 1: company or exchange filing · 16 Apr 2026
- S32Shareholding pattern as of 31 Dec 2025 (XBRL, Reg 31) · Mahindra & Mahindra Ltd (filed with NSE; NSE XBRL archive) · Tier 1: company or exchange filing · 21 Jan 2026
- S33Shareholding pattern as of 30 Sep 2025 (XBRL, Reg 31) · Mahindra & Mahindra Ltd (filed with NSE; NSE XBRL archive) · Tier 1: company or exchange filing · 20 Oct 2025
- S34Shareholding pattern as of 30 Jun 2025 (XBRL, Reg 31) · Mahindra & Mahindra Ltd (filed with NSE; NSE XBRL archive) · Tier 1: company or exchange filing · 21 Jul 2025
- S35Shareholding pattern as of 31 Mar 2025 (XBRL, Reg 31) · Mahindra & Mahindra Ltd (filed with NSE; NSE XBRL archive) · Tier 1: company or exchange filing · 19 Apr 2025
- S36Shareholding pattern as of 31 Dec 2024 (XBRL, Reg 31) · Mahindra & Mahindra Ltd (filed with NSE; NSE XBRL archive) · Tier 1: company or exchange filing · 21 Jan 2025
- S37Shareholding pattern as of 30 Sep 2024 (XBRL, Reg 31) · Mahindra & Mahindra Ltd (filed with NSE; NSE XBRL archive) · Tier 1: company or exchange filing · 17 Oct 2024
- S38Shareholding pattern as of 30 Jun 2024 (XBRL, Reg 31) · Mahindra & Mahindra Ltd (filed with NSE; NSE XBRL archive) · Tier 1: company or exchange filing · 19 Jul 2024
- S39Shareholding pattern as of 31 Mar 2024 (XBRL, Reg 31) · Mahindra & Mahindra Ltd (filed with NSE; NSE XBRL archive) · Tier 1: company or exchange filing · 17 Apr 2024
- S40Shareholding pattern as of 31 Dec 2023 (XBRL, Reg 31) · Mahindra & Mahindra Ltd (filed with NSE; NSE XBRL archive) · Tier 1: company or exchange filing · 19 Jan 2024
- S41NSE historical price data, M&M (EQ series), 28 Oct to 11 Nov 2026 (daily closing prices) · National Stock Exchange of India · Tier 1: company or exchange filing · 11 Nov 2026
Changes to this page (v2 · 17 Nov 2026)
- v2 · 17 Nov 2026Reworded the margin caption so it names the company (no numbers changed). (editorial update, Q2 FY27)
- v1 · 11 Nov 2026First version. (first version)
Numbers come only from tier 1 and tier 2 sources. Read how we research.
Disclaimer
For learning only. Cityfort is not a SEBI-registered adviser and does not recommend buying or selling any security. Prices shown are dated and may be out of date.
Investing in securities involves risk, including loss of capital. Before making any investment decision, do your own research and consider consulting a SEBI-registered investment adviser.
Cityfort, its owners and contributors may or may not hold securities of companies covered. Content is not an offer or solicitation to buy or sell any security.
Read the full disclaimerHide the full disclaimer
Cityfort publishes educational content that explains how listed companies work. Cityfort is not registered with the Securities and Exchange Board of India (SEBI) as an Investment Adviser or Research Analyst and does not provide investment advice, recommendations, ratings, price targets or any opinion on whether to buy, sell or hold any security.
All information is taken from publicly available sources, mainly company filings on BSE and NSE, which are listed on each page with dates. We work to keep it accurate and correct errors publicly, but we do not guarantee that it is complete, accurate or up to date. Any market price or price-based ratio shown is dated, may be out of date by the time you read it, and is included only to explain concepts.
Statements by company management are reported as statements, with their date and source; they are not our forecasts.