Automobile and Auto Components · NSE: MARUTI · BSE: 532500
Maruti Suzuki: how the business works
Maruti Suzuki makes cars and utility vehicles, sold about 40% of India's new passenger vehicles in FY26 by its own count, and earned ₹183,316 crore of revenue.
Follow Maruti Suzuki
Email me when Maruti Suzuki's page is updated after results.
We store your email address with Kit, our email provider, which also records when you sign up and whether you open or click our emails. We send a confirmation email first. See our privacy policy.
Maruti Suzuki India Ltd · New Delhi, Delhi · Founded 1981
Updated for Q2 FY27 · checked
- Revenue, FY26
- ₹183,316 cr
- Net profit, FY26
- ₹14,680 cr
- Vehicles sold, FY26 (India and exports)
- 2,422,713
- Founded
- 1981
- Promoter (Suzuki Motor Corporation), Sep 2026
- 58.72%
The short version
Maruti Suzuki in 5 points
1 · What it sells
Maruti Suzuki makes cars, utility vehicles, vans and spare parts, and sold 2,422,713 vehicles in FY26 for revenue of ₹183,316 crore.
2 · Who pays it
In FY26, buyers in India paid 80.6% of Maruti Suzuki's revenue and buyers abroad 19.4%, mostly a single customer based in Japan.
3 · What it keeps from ₹100
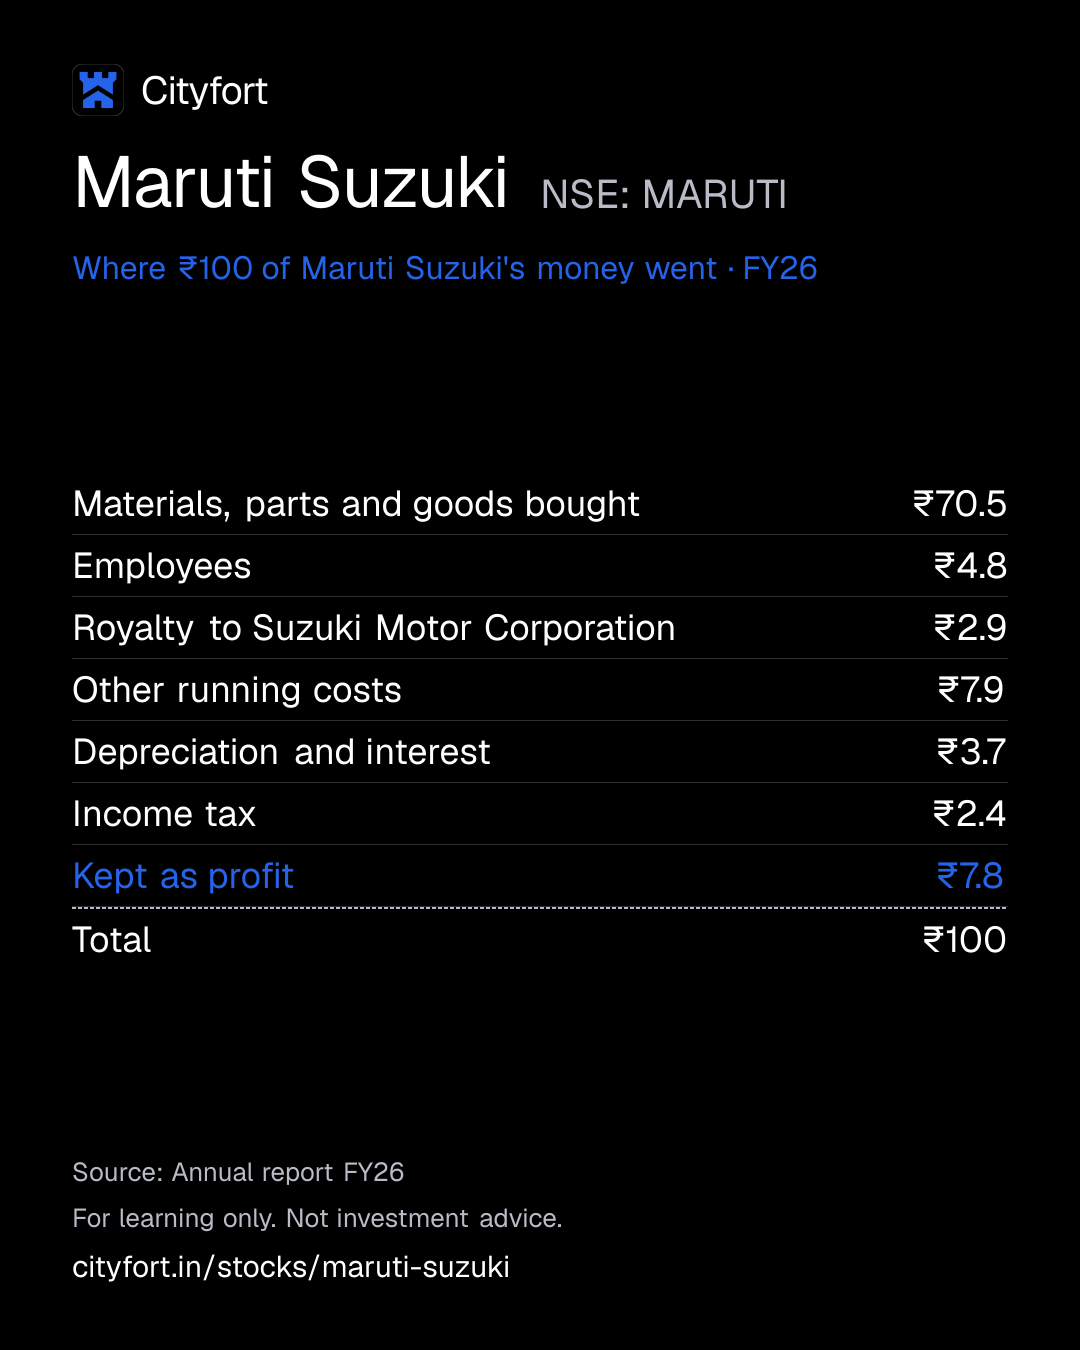
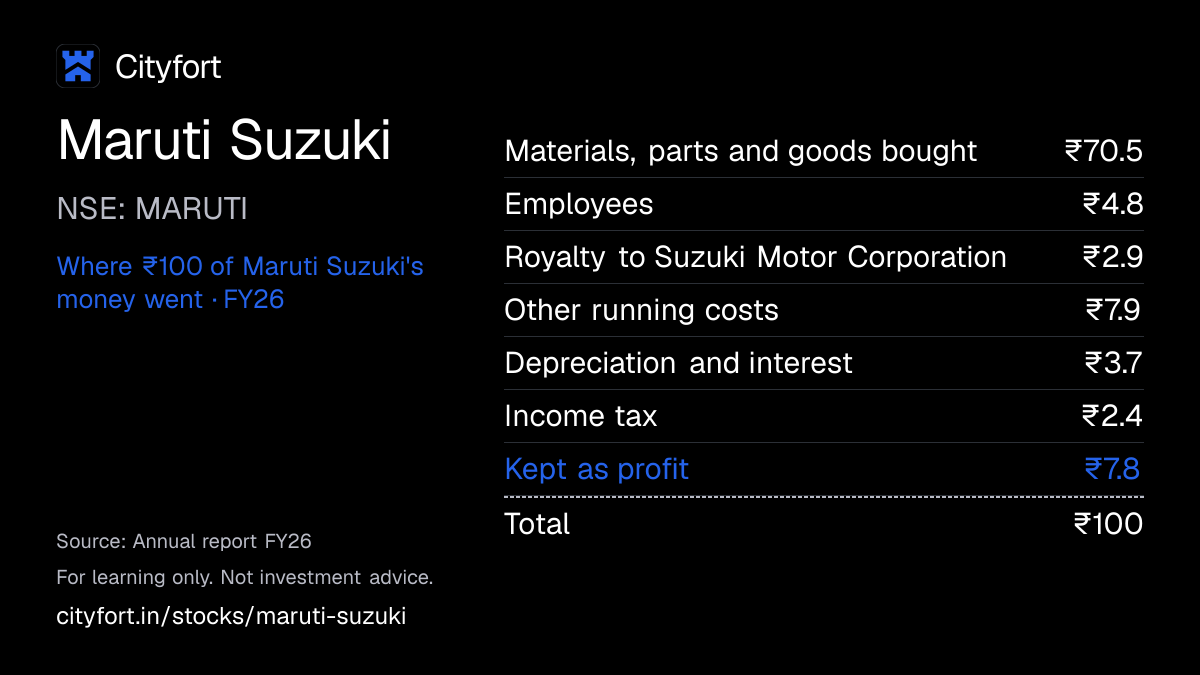
Of every ₹100 that came in during FY26, Maruti Suzuki kept ₹7.8 as profit after ₹70.5 for materials and parts, and ₹2.3 of the ₹100 was non-operating other income, such as returns on invested cash.
4 · Where the operating profit comes from
Maruti Suzuki reports a single business segment, so it gives no profit split, and its FY26 operating profit before depreciation (EBITDA) was ₹21,456 crore, or 11.7% of revenue.
5 · The one thing to watch
In Q2 FY27 Maruti Suzuki's revenue rose 26.0% from a year earlier to ₹53,356 crore, while net profit fell 26.4% to ₹2,466 crore.
Sources: From Maruti Suzuki's FY26 annual report and its Q2 FY26 and Q2 FY27 results · checked
01Where the money goes · FY26
Where does ₹100 of Maruti Suzuki's money go?
Maruti Suzuki · FY26
Receipt for every ₹100
| Materials, parts and goods bought | ₹70.5 |
|---|---|
| Employees | ₹4.8 |
| Royalty to Suzuki Motor Corporation | ₹2.9 |
| Other running costs | ₹7.9 |
| Depreciation and interest | ₹3.7 |
| Income tax | ₹2.4 |
| Kept as profit | ₹7.8 |
| Total | ₹100 |
Each line = amount ÷ total money in × 100. Lines may not add to exactly ₹100 because of rounding.
How this is worked out
Of every ₹100 that came in during FY26: revenue (₹183,316 crore), other income (₹4,357 crore, or ₹2.3 of the ₹100) and the share of part-owned companies' profit (₹286 crore).
Save this receipt as an image
Embed this receipt or the key numbers
Paste this code into a blog or website to show the card you choose, with a link back to this page.
Each week: the next company due to report results, explained in 5 points.
We'll email you once a week with what changed on Cityfort. Facts only, no tips. Unsubscribe any time.
We store your email address with Kit, our email provider, which also records when you sign up and whether you open or click our emails. We send a confirmation email first. See our privacy policy.
02The business in one line
What does Maruti Suzuki do?
Car buyers in India, through dealers, and buyers abroad pay Maruti Suzuki for vehicles and parts; most of the money goes on materials and parts, and about ₹8 of every ₹100 of revenue is left as profit.
- In FY26, buyers in India paid 80.6% of revenue and buyers abroad 19.4%, mostly a single customer based in Japan.
- Materials and parts took ₹132,576 crore of FY26 revenue of ₹183,316 crore. Net profit was ₹14,680 crore.
03Who pays it
Who pays Maruti Suzuki?
Buyers in India
80.6%
of revenue
Individuals, government and company employees, and fleet and taxi operators, buying through dealers. Includes parts, services and some sales to another carmaker.
Buyers abroad
19.4%
of revenue
Vehicles and parts sent overseas. The annual report says these sales are mostly to a single customer based in Japan.
- Buyers in India80.6%
- Buyers abroad19.4%
How spread out the customers are
A single customer based in Japan gave Maruti Suzuki more than 10% of revenue in FY26 and FY25, its segment note says. Separately, it sold ₹25,467 crore of products to its parent Suzuki Motor Corporation in FY26, 13.9% of revenue.
04How it makes money
How does Maruti Suzuki make money?
Volume, and the gap between car prices and material costs, decide the profit.
Materials took ₹72.3 of every ₹100 of FY26 revenue, so metal prices move profit quickly. In Q2 FY27 the company blamed commodity prices, currency and investment losses for lower margins. It named price rises, higher volumes and cost cuts as the offsets.
Material cost per ₹100 of net sales (company's standalone figures)
₹75.7₹79.9
Q2 FY26 to Q2 FY27
- Buyers in India and abroad order vehicles through dealers and Suzuki.
- Plants with 2.9 million units of yearly capacity build them (Jul 2026).
- Materials and parts take about ₹72 of every ₹100 of revenue (FY26).
- More vehicles spread plant, staff and design costs over more units.
- Price rises and cost cuts protect the margin when metals cost more.
- Profit pays for new plants and dividends, with no borrowings at 30 Sep 2026.
↺ Step 6 feeds back into step 1.
05Business segments · FY26
Which businesses make up Maruti Suzuki?
India
80.6%Vehicles, parts and services sold in India. Maruti Suzuki reports one business segment, so it gives no profit by region.
Revenue ₹147,799 cr
Overseas
19.4%Exports, mostly to a single customer based in Japan, according to the annual report.
Revenue ₹35,518 cr
How the mix changed
- India
- Overseas
Revenue by segment, FY25 to FY26.
₹ crore
See the numbers
06The numbers · Consolidated · ₹ crore
How has Maruti Suzuki done?
Revenue
₹183,316 crFY26
Revenue rose every year to ₹183,316 crore in FY26; FY23 is restated to include Suzuki Motor Gujarat and later years include it as reported; FY22 is as first reported.
₹ crore
See the numbers
Net profit
₹14,680 crFY26
Net profit rose from ₹8,264 crore in FY23 to ₹14,680 crore in FY26, but Q2 FY27 profit of ₹2,466 crore was 26.4% below a year earlier.
₹ crore
See the numbers
Net profit for every ₹100 of revenue
₹8.0FY26
Net profit per ₹100 of revenue was ₹9.5 in FY24 and FY25 and ₹8.0 in FY26; FY22's ₹4.4 comes before the Suzuki Motor Gujarat restatement.
Net margin: ₹ of net profit per ₹100 of revenue
See the numbers
Free cash flow
₹8,702 crFY26
Free cash flow was ₹8,702 crore in FY26 after ₹10,398 crore of capex; FY25 cash flow is as regrouped in the FY26 annual report.
₹ crore · cash from operations minus spending on plants and equipment
See the numbers
See all yearly numbers
EBITDA = profit before interest, tax and wear-and-tear of assets. Financial year runs April to March (March year end). Net profit is the share belonging to the company's owners.
Sources (11)
- Annual Report FY23 (2022-23), incl. consolidated financial statements (pre-SMG basis)
- Annual Integrated Report FY24 (2023-24), incl. consolidated financial statements (FY23 restated for SMG)
- Annual Integrated Report FY26 (2025-26), incl. consolidated financial statements
- Consolidated financial results XBRL, Q4 FY25 and FY25 (audited)
- Consolidated financial results XBRL, Q3 FY25
- Consolidated financial results XBRL, Q1 FY26
- Consolidated financial results XBRL, Q2 FY26 (incl. H1 balance sheet and cash flow)
- Consolidated financial results XBRL, Q3 FY26
- Consolidated financial results XBRL, Q4 FY26 and FY26 (audited)
- Consolidated financial results XBRL, Q1 FY27
- Consolidated financial results XBRL, Q2 FY27 (incl. H1 balance sheet and cash flow)
07Who runs it
Who runs Maruti Suzuki, and did they deliver?
R C Bhargava
Chairman (non-executive)
Non-executive, non-independent director.
Hisashi Takeuchi
Managing Director and CEO
Arnab Roy
Chief Financial Officer
What they said, and what happened
3 delivered · 2 too early to tell
Said on 28 Jan 2026
Export about 400,000 vehicles in FY26; management said in the Q3 FY26 call it was on track.
DeliveredWhat happened
The FY26 annual report says exports were about 4.47 lakh, the highest so far.
Said on 26 Mar 2025
Build a second 250,000-unit plant at Kharkhoda, under construction in Mar 2025.
DeliveredWhat happened
Commercial production started on 18 May 2026.
Said on 31 Jul 2026
Most of the benefit of the two-step price increase would reach the company in Q2 FY27 (Q1 FY27 call).
DeliveredWhat happened
Operating EBITDA rose to 9.4% of net sales in Q2 FY27 from 8.6% in Q1 FY27, but stayed below 12.7% a year earlier (company's standalone figures).
Said on 8 Aug 2026
Sell 9 lakh CNG cars in FY27 (FY26 annual report).
Too early to tellWhat happened
CNG sales were 2.2 lakh in Q1 FY27, up 58%.
Said on 8 Aug 2026
Raise capacity to 3.65 million vehicles a year by the end of FY31 (FY26 annual report).
Too early to tellWhat happened
Capacity reached 2.9 million on 30 Jul 2026. Kharkhoda plant 3 and Khoraj phase 1, 250,000 units each, are due by 2029.
Sources (8)
- Annual Integrated Report FY26 (2025-26), incl. consolidated financial statements
- Transcript of Q3 FY26 earnings call (28 Jan 2026)
- Capacity addition: Board approves 3rd plant at Kharkhoda (up to 250,000 units a year, Rs 7,410 crore, by 2029)
- Commencement of commercial production: second plant at Kharkhoda (250,000 units a year), 18 May 2026
- Transcript of Q1 FY27 earnings call (31 Jul 2026)
- Investor presentation: Q2 FY27 and H1 FY27 standalone financial results
- Commencement of commercial production: fourth plant at Hansalpur (250,000 units a year), 30 Jul 2026; total capacity 2.9 million
- Capacity addition: Board approves first phase at Khoraj (250,000 units a year, Rs 10,189 crore, by 2029)
08What could go wrong
What could go wrong for Maruti Suzuki?
- Raw-material prices
Metal and material costs
Materials took ₹72.3 of every ₹100 of FY26 revenue. Material cost rose to 79.9% of net sales in Q2 FY27 from 75.7% a year earlier, which the company linked to commodity prices and the West Asia conflict.
Watch Material cost as a share of net sales each quarter, and any further price increases.
- Concentration
Reliance on its parent, Suzuki
Suzuki Motor Corporation owns 58.72%, licenses the models and technology for a royalty of 2.9% of revenue, and bought 13.9% of FY26 revenue as a customer.
Watch Royalty as a share of revenue, and sales to Suzuki in the related-party note.
- Competition
Competition in utility vehicles
CRISIL lists intense competition and falling small-car sales as weaknesses. Utility vehicles were 40.7% of Maruti Suzuki's domestic sales in H1 FY25, against about 64% for the industry.
Watch Domestic market share (40.8% in Q2 FY27) and utility vehicles' share of its sales.
- Other
Swings in other income
Other income includes gains and losses on invested cash. Management said rising bond yields cost about ₹750 crore in Q4 FY26, and Q2 FY27 other income was ₹414 crore against ₹946 crore a year earlier.
Watch Other income each quarter compared with operating profit.
- Execution
Spending on new plants
Capex was ₹10,398 crore in FY26, and H1 FY27 free cash flow was −₹3,135 crore. Kharkhoda plant 3 (₹7,410 crore) and Khoraj phase 1 (₹10,189 crore) are due by 2029.
Watch Capex against operating cash flow, and whether the new plants start on time.
- Legal
Tax and competition cases
Disputed income-tax claims were ₹14,987 crore at 31 Mar 2026, before a 15 Oct 2026 tribunal order that the company said was majorly in its favour. CCI penalties of ₹200 crore and ₹471.2 crore are stayed while appeals continue.
Watch The updated contingent liability in the FY27 accounts and the NCLAT hearing on the ₹200 crore penalty.
- Regulation
End-of-life vehicle rules
Rules making carmakers responsible for scrapping old vehicles apply from 1 Apr 2025. The company says their financial impact cannot yet be estimated.
Watch Any provision for these obligations in future results.
Sources (13)
- Annual Integrated Report FY26 (2025-26), incl. consolidated financial statements
- Investor presentation: Q2 FY27 and H1 FY27 standalone financial results
- Shareholding pattern, quarter ended Sep 2026 (XBRL)
- CRISIL Ratings rationale: Maruti Suzuki India Ltd, ratings reaffirmed at CRISIL AAA/Stable/CRISIL A1+ (Rs 5,000 crore)
- Press release: Financial Results Q2 and H1 FY 2026-27
- Transcript of Q4 FY26 earnings call (28 Apr 2026)
- Consolidated financial results XBRL, Q2 FY27 (incl. H1 balance sheet and cash flow)
- Consolidated financial results XBRL, Q2 FY26 (incl. H1 balance sheet and cash flow)
- Capacity addition: Board approves 3rd plant at Kharkhoda (up to 250,000 units a year, Rs 7,410 crore, by 2029)
- Capacity addition: Board approves first phase at Khoraj (250,000 units a year, Rs 10,189 crore, by 2029)
- Income Tax Appellate Tribunal order for FY14-FY20 and FY22, mostly in favour of the company
- Update on CCI discount-control-policy appeal before NCLAT: 2 Nov 2026 hearing not taken up
- Unaudited financial results Q2 FY27 (quarter and half year ended 30 Sep 2026), standalone and consolidated, with notes
09Supporters and critics
What do supporters and critics point to?
What supporters point to
- No borrowings at 30 Sep 2026, and ₹70,810 crore of cash and investments.
- About 40% of India's passenger vehicle retail sales in FY26, by the company's count, and 40.8% of domestic sales in Q2 FY27.
- A record 696,654 vehicles sold in Q2 FY27, up 26.5%, with about 200,000 pending bookings at end-Sep, according to the company.
- Exports of about 4.47 lakh vehicles in FY26, above the 400,000 that management had guided.
- CRISIL reaffirmed its AAA/Stable rating on 21 Nov 2025.
What critics point to
- Q2 FY27 net profit fell 26.4% while revenue rose 26.0%.
- Suzuki is the controlling owner, a major buyer (13.9% of FY26 revenue) and is paid a royalty of 2.9% of revenue.
- CRISIL noted that utility vehicles were a smaller share of Maruti Suzuki's sales than of the industry's.
- H1 FY27 free cash flow was −₹3,135 crore as capex rose to ₹8,654 crore.
- Other income, which includes gains and losses on invested cash, swung from ₹946 crore in Q2 FY26 to ₹414 crore in Q2 FY27.
10What to watch next
What should you watch next at Maruti Suzuki?
Next event
Q3 FY27 results
Date not announced yet.
Margins after the price rises
Material cost was 79.9% of net sales in Q2 FY27. Management said on 27 Oct 2026 it could wait a quarter for commodity prices to settle before raising prices again.
Exports
Q2 FY27 exports fell 2.1% to 108,119 vehicles, after about 4.47 lakh in FY26.
Tax dispute total
After the 15 Oct 2026 tribunal order, the company said disputed income-tax claims of ₹14,987 crore would fall by about ₹6,300 crore.
11Key facts
Key facts about Maruti Suzuki
- What does Maruti Suzuki do?
- Maruti Suzuki India makes and sells cars, utility vehicles, vans and light commercial vehicles, plus spare parts and accessories. Maruti Suzuki sold 2,422,713 vehicles in FY26, in India and abroad.
- How does Maruti Suzuki make money?
- Maruti Suzuki earns most of its money selling vehicles: ₹146,568 crore of its ₹183,316 crore revenue in FY26. Spare parts, components and accessories brought in ₹27,815 crore and services ₹5,968 crore.
- Who are Maruti Suzuki's customers?
- In FY26, buyers in India gave Maruti Suzuki 80.6% of its revenue and buyers abroad 19.4%. Maruti Suzuki's FY26 annual report says overseas sales are mostly to a single customer based in Japan.
- How big is Maruti Suzuki?
- Maruti Suzuki's consolidated revenue was ₹183,316 crore in FY26 and net profit ₹14,680 crore, up from ₹152,913 crore and ₹14,500 crore in FY25.
- Who owns Maruti Suzuki?
- Suzuki Motor Corporation of Japan, the promoter, owned 58.72% of Maruti Suzuki in Sep 2026. Foreign investors held 12.42%, Indian institutions 25.41% and other shareholders 3.44%; no promoter shares were pledged.
- Does Maruti Suzuki have debt?
- Maruti Suzuki had no borrowings on 30 Sep 2026 and held ₹70,810 crore in cash and investments.
- How many vehicles can Maruti Suzuki make in a year?
- Maruti Suzuki's installed capacity reached 2.9 million vehicles a year on 30 Jul 2026, across its plants at Hansalpur, Manesar, Gurugram and Kharkhoda.
- How much royalty does Maruti Suzuki pay Suzuki Motor Corporation?
- Maruti Suzuki paid ₹5,392 crore of royalty to Suzuki Motor Corporation in FY26, 2.9% of revenue, up from ₹5,038 crore in FY25.
- What dividend did Maruti Suzuki pay for FY26?
- Maruti Suzuki declared a final dividend of ₹140 a share for FY26, up from ₹135 a share for FY25.
Sources (5)
- Annual Integrated Report FY26 (2025-26), incl. consolidated financial statements
- Shareholding pattern, quarter ended Sep 2026 (XBRL)
- Consolidated financial results XBRL, Q2 FY27 (incl. H1 balance sheet and cash flow)
- Commencement of commercial production: fourth plant at Hansalpur (250,000 units a year), 30 Jul 2026; total capacity 2.9 million
- Annual Integrated Report FY25 (2024-25)
Terms on this page
- Capital expenditure (capex)
- Credit rating
- Dividend payout ratio
- EBITDA
- FII and DII holding
- Free cash flow
- Market capitalisation
- Net debt
- Net profit
- Operating margin
Each explains the term in plain English, with the same number from other companies on Cityfort.
Go deeper
More detail from the same filings. Open any section.
12What it sells
12What it sells
What does Maruti Suzuki sell?
Vehicles
Small cars, sedans, utility vehicles, vans and light commercial vehicles. ₹146,568 crore of revenue in FY26.
Spare parts, components and accessories
Parts for servicing its cars, plus components, dies and moulds. ₹27,815 crore of revenue in FY26.
Services
Extended warranties and recovery of freight and service charges. ₹5,968 crore of revenue in FY26.
Other operating revenue
Scrap sales, government fiscal incentives, export benefits and similar items. ₹2,966 crore in FY26.
What it does
- Does: Builds most of its vehicles in its own plants in Haryana and Gujarat
- Does: Sells through 4,601 sales outlets and services cars at 5,926 service outlets (FY26)
- Does: Exports cars, with overseas buyers paying 19.4% of FY26 revenue
- Does: Sells pre-owned cars under True Value and helps buyers arrange loans
What it does not do
- Does not: Does not own Suzuki's brand and core technology: it licenses models and technology from Suzuki Motor Corporation and pays a royalty
- Does not: Does not lend to car buyers itself: it only helps arrange financing, which its annual report calls not material
- Does not: Does not run on borrowed money: it had no borrowings on 30 Sep 2026
13How the money flows
13How the money flows · FY26
How does money flow through Maruti Suzuki?
Money in
- Revenue from operations₹183,316 cr
- Share of profit from part-owned companies₹286 cr
- Other income₹4,357 cr
The company
Maruti Suzuki
₹187,959 cr came in
Money out
- Materials, parts and goods bought₹132,576 cr
- Employee costs₹9,050 cr
- Royalty to Suzuki Motor Corporation₹5,392 cr
- Other running costs (transport, advertising and more)₹14,843 cr
- Depreciation and interest₹6,980 cr
- Income tax₹4,439 cr
- Net profit₹14,680 cr
- In FY26 Maruti Suzuki's sales brought in ₹183,316 crore, plus ₹4,357 crore of other income, which includes returns on invested cash.
- Part-owned companies added ₹286 crore as Maruti Suzuki's share of their profit.
- Materials, parts and goods bought took ₹132,576 crore, the biggest cost.
- Employees took ₹9,050 crore, the royalty to Suzuki ₹5,392 crore and other running costs ₹14,843 crore.
- After ₹6,980 crore of depreciation and interest and ₹4,439 crore of tax, ₹14,680 crore was left as profit.
14What it needs to run
14What it needs to run
What does Maruti Suzuki need to run?
Plants
Capacity of 2.9 million vehicles a year from 30 Jul 2026: Hansalpur 1.0 million, Manesar 0.9 million, Gurugram 0.5 million and Kharkhoda 0.5 million.
Suzuki's models and technology
Licensed from its parent, Suzuki Motor Corporation. The royalty was ₹5,392 crore in FY26, 2.9% of revenue.
Steel, metals and parts
Materials and parts took ₹132,576 crore in FY26. The company named steel, copper and precious metals among the costs that moved its margins.
Sales and service network
4,601 sales outlets and 5,926 service outlets in FY26, with service in 2,959 cities.
People
21,200 employees and 49,328 workers in FY26, including non-permanent staff, according to its BRSR report.
Sources (5)
- Commencement of commercial production: fourth plant at Hansalpur (250,000 units a year), 30 Jul 2026; total capacity 2.9 million
- Annual Integrated Report FY26 (2025-26), incl. consolidated financial statements
- Transcript of Q2 FY27 earnings call (27 Oct 2026)
- Transcript of Q3 FY26 earnings call (28 Jan 2026)
- Business Responsibility and Sustainability Report FY26 (2025-26)
15Competitors and what protects it
15Competitors and what protects it
Who does Maruti Suzuki compete with?
Hyundai Motor India
Named by CRISIL Ratings (Jan 2025) among the carmakers Maruti Suzuki competes with in passenger vehicles.
Mahindra & Mahindra
Named by CRISIL Ratings (Jan 2025) as a passenger vehicle competitor.
Tata Motors Passenger Vehicles
Named by CRISIL Ratings (Jan 2025) as a passenger vehicle competitor.
Kia
Named by CRISIL Ratings (Jan 2025) as a passenger vehicle competitor.
What protects the business
Each strength is scored 1 (weak) to 5 (strong) for the business, with the reason. It is not a rating of the share.
- Sales and service network5 of 5
4,601 sales outlets and 5,926 service outlets in FY26, with service in 2,959 cities.
- Scale4 of 5
2,422,713 vehicles sold in FY26 and capacity of 2.9 million a year from 30 Jul 2026.
- CNG cars4 of 5
CNG versions of 14 of its 18 passenger models; the company says it has nearly 70% of India's CNG car segment.
- Parent's models and technology3 of 5
Products and technology come under licence from Suzuki Motor Corporation, for a royalty of 2.9% of FY26 revenue.
Weak spot
Utility vehicles
CRISIL noted in Jan 2025 that utility vehicles were 40.7% of Maruti Suzuki's domestic sales in H1 FY25, against about 64% for the industry. In Q2 FY27 they were 40.2%.
Sources (4)
- CRISIL Ratings rationale: Maruti Suzuki India Ltd, ratings reaffirmed at CRISIL AAA/Stable/CRISIL A1+ (Rs 5,000 crore)
- Annual Integrated Report FY26 (2025-26), incl. consolidated financial statements
- Commencement of commercial production: fourth plant at Hansalpur (250,000 units a year), 30 Jul 2026; total capacity 2.9 million
- Investor presentation: Q2 FY27 and H1 FY27 standalone financial results
16Where growth could come from
16Where growth could come from
Where could Maruti Suzuki's growth come from?
Management said in the FY26 annual report (8 Aug 2026) that capacity is planned to reach 3.65 million vehicles a year by the end of FY31.
Exports
WorkingAbout 4.47 lakh vehicles exported in FY26
Management had guided about 400,000 for FY26. The company says it made more than 51% of India's passenger vehicle exports in H1 FY27, though Q2 FY27 exports fell 2.1% to 108,119.
Status: Working, on track against what the company said.
New plants
WorkingCapacity 2.9 million a year from 30 Jul 2026
Kharkhoda plant 2 started on 18 May 2026 and Hansalpur plant 4 on 30 Jul 2026. Kharkhoda plant 3 (₹7,410 crore) and Khoraj phase 1 (₹10,189 crore) are due by 2029.
Status: Working, on track against what the company said.
Utility vehicles (SUVs)
Working236,807 sold in India in Q2 FY27, up 52.3%
Utility vehicles were 40.2% of domestic sales in Q2 FY27. The FY26 annual report says the company plans seven SUVs over the next five years.
Status: Working, on track against what the company said.
CNG cars
Working7.46 lakh CNG cars sold in FY26, up 22%
The FY26 annual report sets a target of 9 lakh CNG cars for FY27. CNG sales were 2.2 lakh in Q1 FY27, up 58%.
Status: Working, on track against what the company said.
Electric vehicles
New40,873 electric vehicles exported so far (FY26 annual report)
The chairman's letter in the FY26 annual report gives the export count of its first electric model.
Status: New, recently announced.
Status compares progress with what the company itself said it would do: Working = on track against what the company said; Mixed = partly on track; Behind = behind the company's own plan; New = recently announced; Early = too early to judge.
Sources (8)
- Annual Integrated Report FY26 (2025-26), incl. consolidated financial statements
- Transcript of Q3 FY26 earnings call (28 Jan 2026)
- Transcript of Q2 FY27 earnings call (27 Oct 2026)
- Investor presentation: Q2 FY27 and H1 FY27 standalone financial results
- Commencement of commercial production: second plant at Kharkhoda (250,000 units a year), 18 May 2026
- Commencement of commercial production: fourth plant at Hansalpur (250,000 units a year), 30 Jul 2026; total capacity 2.9 million
- Capacity addition: Board approves 3rd plant at Kharkhoda (up to 250,000 units a year, Rs 7,410 crore, by 2029)
- Capacity addition: Board approves first phase at Khoraj (250,000 units a year, Rs 10,189 crore, by 2029)
17Financial strength and debt
17Financial strength · 30 Sep 2026
How much debt does Maruti Suzuki have?
- Total debt₹0 cr
- Cash and investments₹70,810 cr
- Net cash (cash minus debt)₹70,810 cr
- Net worth (shareholders' money)₹109,002 cr
- Debt to equity
- 0×
- ₹ of debt for every ₹1 of shareholders' money
- Lease liabilities of ₹83 crore at 30 Sep 2026 are not counted as borrowings.
- Cash and investments were ₹75,869 crore at 31 Mar 2026. In H1 FY27 the company spent ₹8,654 crore on capex and paid ₹4,402 crore of dividends.
- Disputed income-tax claims, not booked as liabilities, were ₹14,987 crore at 31 Mar 2026. After a tribunal order on 15 Oct 2026, the company said it would cut this by about ₹6,300 crore.
- Cash and investments leave out stakes in part-owned companies (₹2,701 crore at 30 Sep 2026).
18Who owns it
18Who owns it · Q2 FY27
Who owns Maruti Suzuki?
- Promoters (founders or parent company)58.7%
- Foreign institutions (FII)12.4%
- Indian institutions (DII)25.4%
- Public and others3.4%
Promoter pledge
No promoter shares were pledged in Q2 FY27.
How ownership changed
* Pledged = share of the promoters' own holding reported as pledged. In older filings this can include shares “otherwise encumbered”; the governance flags say when.
Sources (12)
- Shareholding pattern, quarter ended Sep 2026 (XBRL)
- Shareholding pattern, quarter ended Jun 2026 (XBRL)
- Shareholding pattern, quarter ended Mar 2026 (XBRL)
- Shareholding pattern, quarter ended Dec 2025 (XBRL)
- Shareholding pattern, quarter ended Sep 2025 (XBRL)
- Shareholding pattern, quarter ended Jun 2025 (XBRL)
- Shareholding pattern, quarter ended Mar 2025 (XBRL)
- Shareholding pattern, quarter ended Dec 2024 (XBRL)
- Shareholding pattern, quarter ended Sep 2024 (XBRL)
- Shareholding pattern, quarter ended Jun 2024 (XBRL)
- Shareholding pattern, quarter ended Mar 2024 (XBRL)
- Shareholding pattern, quarter ended Dec 2023 (XBRL)
19What it does with profit
19What it does with profit
What does Maruti Suzuki do with its profit?
Dividend per share
₹140.00FY26
Dividend paid for each share, by financial year.
₹ per share
See the numbers
Money raised · 24 Nov 2023
Issued 12,322,514 new shares to Suzuki Motor Corporation at ₹10,420.85 each, in exchange for 100% of Suzuki Motor Gujarat. No cash was raised.
₹12,841 cr
Sources (5)
- Annual Report FY22 (2021-22)
- Annual Report FY23 (2022-23), incl. consolidated financial statements (pre-SMG basis)
- Annual Integrated Report FY24 (2023-24), incl. consolidated financial statements (FY23 restated for SMG)
- Annual Integrated Report FY25 (2024-25)
- Annual Integrated Report FY26 (2025-26), incl. consolidated financial statements
20Governance signals
20Governance signals
What do Maruti Suzuki's governance filings show?
- Auditor
- Price Waterhouse Chartered Accountants LLP, since 2025
- Auditor changes
- 12 May 2025: Deloitte Haskins & Sells LLP → Price Waterhouse Chartered Accountants LLP (Deloitte resigned after the company said it wanted an auditor in the same network as its parent Suzuki's new auditor. The company said Deloitte raised no concerns. Shareholders gave Price Waterhouse a five-year term at the 28 Aug 2025 AGM.)
- Audit qualifications
- None reported
- Related-party dealings
- In FY26 Maruti Suzuki sold ₹25,467 crore of products to its parent Suzuki Motor Corporation (13.9% of revenue) and bought ₹10,051 crore of goods from it. It also paid Suzuki ₹5,392 crore of royalty, 2.9% of revenue.
- Credit rating
- CRISIL AAA (long term), A1+ (short term), on ₹10,000 crore of bank facilities (outlook Stable), 21 Nov 2025
A credit rating describes the company's ability to repay debt. It is not a rating of the share.
Flags to know about
related party · 31 Mar 2026
Parent is also a major buyer and licensor
Suzuki Motor Corporation owns 58.72%, bought ₹25,467 crore of Maruti Suzuki's products in FY26 and received ₹5,392 crore of royalty.
auditor · 12 May 2025
Auditor change in May 2025
Deloitte Haskins & Sells LLP resigned on 12 May 2025, before its term ended. The company said it raised no concerns; Price Waterhouse, in the same network as Suzuki's auditor, replaced it.
regulatory · 12 Oct 2026
CCI penalties under appeal
The CCI fined Maruti Suzuki ₹200 crore in Aug 2021 over an alleged discount control policy for dealers; NCLAT stayed it subject to a ₹20 crore deposit, and the appeal is pending. A 2014 CCI penalty of ₹471.2 crore on spare parts has a Supreme Court interim stay.
other · 15 Oct 2026
Income-tax disputes
Disputed income-tax claims were ₹14,987 crore at 31 Mar 2026. A tribunal order on 15 Oct 2026 for FY14–FY20 and FY22, which the company said was majorly allowed in its favour, led it to say the figure would fall by about ₹6,300 crore.
disclosure · 26 Sep 2024
Suzuki Motor Gujarat restatement
Maruti Suzuki bought Suzuki Motor Gujarat from its parent in Nov 2023 and restated FY23 as if it had always owned it. FY22 was not restated, so its EBITDA margin does not compare.
Sources (7)
- Change in auditors: Deloitte Haskins & Sells LLP resigns; Price Waterhouse Chartered Accountants LLP appointed
- Annual Integrated Report FY26 (2025-26), incl. consolidated financial statements
- Intimation: CRISIL Ratings reaffirmed CRISIL AAA/Stable and CRISIL A1+ on bank facilities of Rs 10,000 crore (enhanced from Rs 5,000 crore)
- Shareholding pattern, quarter ended Sep 2026 (XBRL)
- Update on CCI discount-control-policy appeal before NCLAT: 2 Nov 2026 hearing not taken up
- Income Tax Appellate Tribunal order for FY14-FY20 and FY22, mostly in favour of the company
- Annual Integrated Report FY24 (2023-24), incl. consolidated financial statements (FY23 restated for SMG)
21What the market paid
21What the market paid · price as of 9 Nov 2026
What did the market pay for Maruti Suzuki on 9 Nov 2026?
Price as of 9 Nov 2026 (shown for education; prices change daily).
Price as of 9 Nov 2026: ₹12,928 (NSE closing price), for a market value of ₹406,460 crore on 314,402,574 shares. P/E is the price divided by profit per share of the four quarters to Sep 2026 (₹427.83): 30.2. On FY26 EPS of ₹466.90 it is 27.7. P/B divides the price by book value per share at 30 Sep 2026 (₹3,466.97): 3.73. The FY26 dividend of ₹140 was 1.08% of the price.
- Share price
- ₹12,928.00
- Market value (market cap)
- ₹406,460 cr
- P/E
- 30.2×
- P/B
- 3.7×
Source: NSE equity bhavcopy, 9 Nov 2026 (MARUTI close); Shareholding pattern, quarter ended Sep 2026 (XBRL); Consolidated financial results XBRL, Q2 FY27 (incl. H1 balance sheet and cash flow) and 4 more
Sources (7)
- NSE equity bhavcopy, 9 Nov 2026 (MARUTI close)
- Shareholding pattern, quarter ended Sep 2026 (XBRL)
- Consolidated financial results XBRL, Q2 FY27 (incl. H1 balance sheet and cash flow)
- Consolidated financial results XBRL, Q1 FY27
- Consolidated financial results XBRL, Q4 FY26 and FY26 (audited)
- Consolidated financial results XBRL, Q3 FY26
- Annual Integrated Report FY26 (2025-26), incl. consolidated financial statements
22How it got here
22How it got here
How did Maruti Suzuki get here?
1981
Milestone
Company set up
Maruti was established in 1981.
1982
Business-model change
Partnership with Suzuki
The Government of India and Suzuki Motor Corporation signed a joint-venture agreement.
2002
Business-model change
Suzuki takes control
Maruti became a subsidiary of Suzuki Motor Corporation.
2023
Business-model change
Gujarat plant bought from Suzuki
Maruti Suzuki issued 12,322,514 shares to Suzuki for 100% of Suzuki Motor Gujarat.
2025
Milestone
Kharkhoda plant opens
The first 250,000-unit plant at Kharkhoda, Haryana, started in Feb 2025.
2025
Milestone
Gujarat unit merged in
Suzuki Motor Gujarat merged into Maruti Suzuki from 1 Dec 2025.
2026
Milestone
Capacity reaches 2.9 million
Hansalpur plant 4 started on 30 Jul 2026, taking capacity to 2.9 million vehicles a year.
2026
Crisis
Commodity costs hit margins
Q2 FY27 profit fell 26.4%; the company cited commodity prices linked to the West Asia conflict, currency moves and mark-to-market losses on invested cash.
Sources (7)
- Annual Integrated Report FY26 (2025-26), incl. consolidated financial statements
- Annual Integrated Report FY24 (2023-24), incl. consolidated financial statements (FY23 restated for SMG)
- Capacity addition: Board approves 3rd plant at Kharkhoda (up to 250,000 units a year, Rs 7,410 crore, by 2029)
- Intimation: Scheme of Amalgamation of SMG effective 1 Dec 2025 (appointed date 1 Apr 2025)
- Commencement of commercial production: fourth plant at Hansalpur (250,000 units a year), 30 Jul 2026; total capacity 2.9 million
- Consolidated financial results XBRL, Q2 FY27 (incl. H1 balance sheet and cash flow)
- Investor presentation: Q2 FY27 and H1 FY27 standalone financial results
Used in a free classroom lesson: Same year, same measure: two carmakers on one scale, Four traps that make a comparison unfair, Reading a compare page: what it shows and what to check.
23Sources and changes
Where every number on this page comes from
Sources (44 documents)
- S1Annual Integrated Report FY26 (2025-26), incl. consolidated financial statements · NSE (company filing, nsearchives.nseindia.com) · Tier 1: company or exchange filing · 8 Aug 2026
- S2Annual Integrated Report FY25 (2024-25) · NSE (company filing, nsearchives.nseindia.com) · Tier 1: company or exchange filing · 5 Aug 2025
- S3Annual Integrated Report FY24 (2023-24), incl. consolidated financial statements (FY23 restated for SMG) · Maruti Suzuki India Ltd (company IR site); same report listed on NSE · Tier 1: company or exchange filing · 26 Sep 2024
- S4Annual Report FY23 (2022-23), incl. consolidated financial statements (pre-SMG basis) · NSE (company filing; PDF inside NSE zip) · Tier 1: company or exchange filing · 5 Aug 2023
- S5Annual Report FY22 (2021-22) · NSE (company filing; PDF inside NSE zip) · Tier 1: company or exchange filing · 6 Aug 2022
- S6Unaudited financial results Q2 FY27 (quarter and half year ended 30 Sep 2026), standalone and consolidated, with notes · NSE (company filing, nsearchives.nseindia.com) · Tier 1: company or exchange filing · 27 Oct 2026
- S7Consolidated financial results XBRL, Q2 FY27 (incl. H1 balance sheet and cash flow) · NSE integrated filing (XBRL) · Tier 1: company or exchange filing · 27 Oct 2026
- S8Consolidated financial results XBRL, Q1 FY27 · NSE integrated filing (XBRL) · Tier 1: company or exchange filing · 31 Jul 2026
- S9Consolidated financial results XBRL, Q4 FY26 and FY26 (audited) · NSE integrated filing (XBRL) · Tier 1: company or exchange filing · 28 Apr 2026
- S10Consolidated financial results XBRL, Q3 FY26 · NSE integrated filing (XBRL) · Tier 1: company or exchange filing · 28 Jan 2026
- S11Consolidated financial results XBRL, Q2 FY26 (incl. H1 balance sheet and cash flow) · NSE integrated filing (XBRL) · Tier 1: company or exchange filing · 31 Oct 2025
- S12Consolidated financial results XBRL, Q1 FY26 · NSE integrated filing (XBRL) · Tier 1: company or exchange filing · 31 Jul 2025
- S13Consolidated financial results XBRL, Q4 FY25 and FY25 (audited) · NSE integrated filing (XBRL) · Tier 1: company or exchange filing · 28 Apr 2025
- S14Consolidated financial results XBRL, Q3 FY25 · NSE (XBRL) · Tier 1: company or exchange filing · 29 Jan 2025
- S15Press release: Financial Results Q2 and H1 FY 2026-27 · NSE (company filing, nsearchives.nseindia.com) · Tier 1: company or exchange filing · 27 Oct 2026
- S16Investor presentation: Q2 FY27 and H1 FY27 standalone financial results · NSE (company filing, nsearchives.nseindia.com) · Tier 1: company or exchange filing · 27 Oct 2026
- S18Transcript of Q2 FY27 earnings call (27 Oct 2026) · Maruti Suzuki India Ltd (company IR site); filing notice on NSE 2 Nov 2026 · Tier 1: company or exchange filing · 2 Nov 2026
- S19Transcript of Q1 FY27 earnings call (31 Jul 2026) · Maruti Suzuki India Ltd (company IR site); filing notice on NSE 6 Aug 2026 · Tier 1: company or exchange filing · 6 Aug 2026
- S20Transcript of Q4 FY26 earnings call (28 Apr 2026) · Maruti Suzuki India Ltd (company IR site); filing notice on NSE 4 May 2026 · Tier 1: company or exchange filing · 4 May 2026
- S21Transcript of Q3 FY26 earnings call (28 Jan 2026) · Maruti Suzuki India Ltd (company IR site); filing notice on NSE 2 Feb 2026 · Tier 1: company or exchange filing · 2 Feb 2026
- S22Shareholding pattern, quarter ended Sep 2026 (XBRL) · NSE (XBRL) · Tier 1: company or exchange filing · 21 Oct 2026
- S23Shareholding pattern, quarter ended Jun 2026 (XBRL) · NSE (XBRL) · Tier 1: company or exchange filing · 17 Jul 2026
- S24Shareholding pattern, quarter ended Mar 2026 (XBRL) · NSE (XBRL) · Tier 1: company or exchange filing · 17 Apr 2026
- S25Shareholding pattern, quarter ended Dec 2025 (XBRL) · NSE (XBRL) · Tier 1: company or exchange filing · 21 Jan 2026
- S26Shareholding pattern, quarter ended Sep 2025 (XBRL) · NSE (XBRL) · Tier 1: company or exchange filing · 18 Oct 2025
- S27Shareholding pattern, quarter ended Jun 2025 (XBRL) · NSE (XBRL) · Tier 1: company or exchange filing · 21 Jul 2025
- S28Shareholding pattern, quarter ended Mar 2025 (XBRL) · NSE (XBRL) · Tier 1: company or exchange filing · 21 Apr 2025
- S29Shareholding pattern, quarter ended Dec 2024 (XBRL) · NSE (XBRL) · Tier 1: company or exchange filing · 20 Jan 2025
- S30Shareholding pattern, quarter ended Sep 2024 (XBRL) · NSE (XBRL) · Tier 1: company or exchange filing · 17 Oct 2024
- S31Shareholding pattern, quarter ended Jun 2024 (XBRL) · NSE (XBRL) · Tier 1: company or exchange filing · 16 Jul 2024
- S32Shareholding pattern, quarter ended Mar 2024 (XBRL) · NSE (XBRL) · Tier 1: company or exchange filing · 19 Apr 2024
- S33Shareholding pattern, quarter ended Dec 2023 (XBRL) · NSE (XBRL) · Tier 1: company or exchange filing · 15 Jan 2024
- S34Intimation: CRISIL Ratings reaffirmed CRISIL AAA/Stable and CRISIL A1+ on bank facilities of Rs 10,000 crore (enhanced from Rs 5,000 crore) · NSE (company filing, nsearchives.nseindia.com) · Tier 1: company or exchange filing · 21 Nov 2025
- S35CRISIL Ratings rationale: Maruti Suzuki India Ltd, ratings reaffirmed at CRISIL AAA/Stable/CRISIL A1+ (Rs 5,000 crore) · CRISIL Ratings Ltd · Tier 2: rating agency or regulator · 9 Jan 2025
- S36Business Responsibility and Sustainability Report FY26 (2025-26) · NSE (company filing, nsearchives.nseindia.com) · Tier 1: company or exchange filing · 8 Aug 2026
- S38Intimation: Scheme of Amalgamation of SMG effective 1 Dec 2025 (appointed date 1 Apr 2025) · NSE (company filing, nsearchives.nseindia.com) · Tier 1: company or exchange filing · 1 Dec 2025
- S39Capacity addition: Board approves 3rd plant at Kharkhoda (up to 250,000 units a year, Rs 7,410 crore, by 2029) · NSE (company filing, nsearchives.nseindia.com) · Tier 1: company or exchange filing · 26 Mar 2025
- S41Capacity addition: Board approves first phase at Khoraj (250,000 units a year, Rs 10,189 crore, by 2029) · NSE (company filing, nsearchives.nseindia.com) · Tier 1: company or exchange filing · 24 Mar 2026
- S42Commencement of commercial production: second plant at Kharkhoda (250,000 units a year), 18 May 2026 · NSE (company filing, nsearchives.nseindia.com) · Tier 1: company or exchange filing · 18 May 2026
- S43Commencement of commercial production: fourth plant at Hansalpur (250,000 units a year), 30 Jul 2026; total capacity 2.9 million · NSE (company filing, nsearchives.nseindia.com) · Tier 1: company or exchange filing · 30 Jul 2026
- S44Change in auditors: Deloitte Haskins & Sells LLP resigns; Price Waterhouse Chartered Accountants LLP appointed · NSE (company filing, nsearchives.nseindia.com) · Tier 1: company or exchange filing · 12 May 2025
- S47Income Tax Appellate Tribunal order for FY14-FY20 and FY22, mostly in favour of the company · NSE (company filing, nsearchives.nseindia.com) · Tier 1: company or exchange filing · 15 Oct 2026
- S48Update on CCI discount-control-policy appeal before NCLAT: 2 Nov 2026 hearing not taken up · NSE (company filing, nsearchives.nseindia.com) · Tier 1: company or exchange filing · 12 Oct 2026
- S49NSE equity bhavcopy, 9 Nov 2026 (MARUTI close) · NSE · Tier 1: company or exchange filing · 9 Nov 2026
Changes to this page (v1 · 11 Nov 2026)
- v1 · 11 Nov 2026First version. (first version)
Numbers come only from tier 1 and tier 2 sources. Read how we research.
Disclaimer
For learning only. Cityfort is not a SEBI-registered adviser and does not recommend buying or selling any security. Prices shown are dated and may be out of date.
Investing in securities involves risk, including loss of capital. Before making any investment decision, do your own research and consider consulting a SEBI-registered investment adviser.
Cityfort, its owners and contributors may or may not hold securities of companies covered. Content is not an offer or solicitation to buy or sell any security.
Read the full disclaimerHide the full disclaimer
Cityfort publishes educational content that explains how listed companies work. Cityfort is not registered with the Securities and Exchange Board of India (SEBI) as an Investment Adviser or Research Analyst and does not provide investment advice, recommendations, ratings, price targets or any opinion on whether to buy, sell or hold any security.
All information is taken from publicly available sources, mainly company filings on BSE and NSE, which are listed on each page with dates. We work to keep it accurate and correct errors publicly, but we do not guarantee that it is complete, accurate or up to date. Any market price or price-based ratio shown is dated, may be out of date by the time you read it, and is included only to explain concepts.
Statements by company management are reported as statements, with their date and source; they are not our forecasts.