Fast Moving Consumer Goods · NSE: MARICO · BSE: 531642
Marico: how the business works
Marico sells Parachute coconut oil, Saffola cooking oil and other household brands in India and abroad, earning ₹13,611 crore of revenue in FY26.
Follow Marico
Email me when Marico's page is updated after results.
We store your email address with Kit, our email provider, which also records when you sign up and whether you open or click our emails. We send a confirmation email first. See our privacy policy.
Marico Limited · Mumbai, Maharashtra · Founded 1990
Updated for Q2 FY27 · checked
- Revenue, FY26
- ₹13,611 cr
- Net profit, FY26
- ₹1,762 cr
- Shops its products reach, FY26
- About 5.8 million
- Operating since
- 1990
- Promoter holding, Sep 2026
- 58.83%
The short version
Marico in 5 points
1 · What it sells
Marico sells Parachute coconut oil, other hair oils, Saffola cooking oils and foods, and grooming brands, and its FY26 revenue was ₹13,611 crore.
2 · Who pays it
Shops in India, supplied through distributors, gave 76% of Marico's FY26 revenue and buyers in other countries 24%; no single customer gave a tenth or more.
3 · What it keeps from ₹100
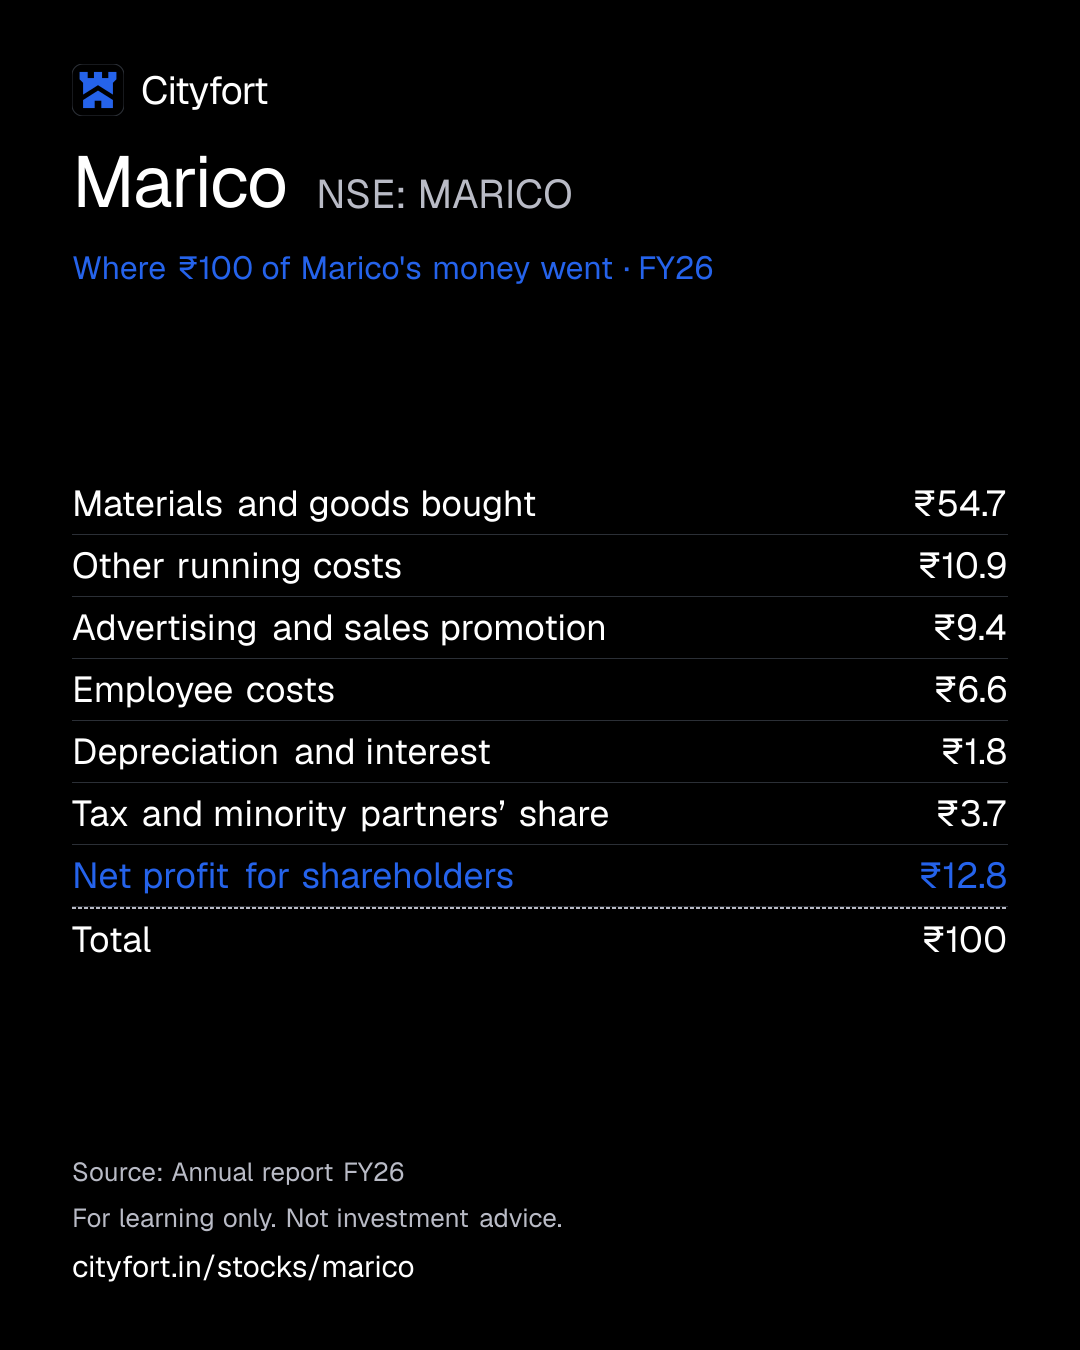
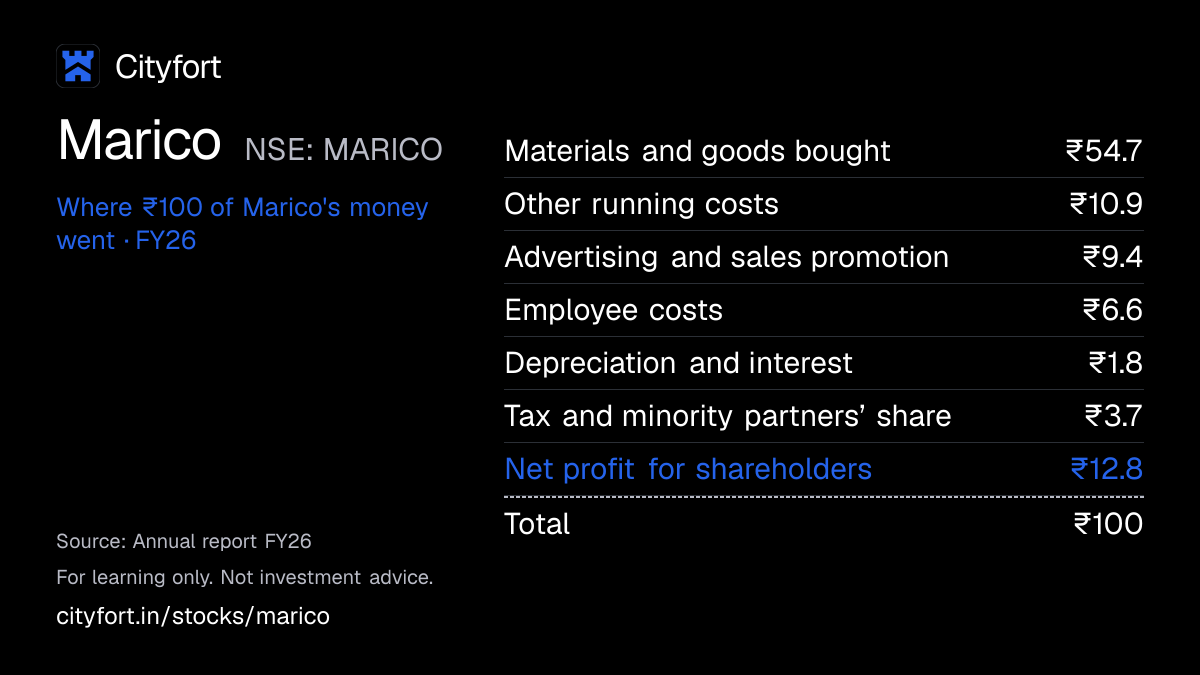
Of every ₹100 that came in during FY26, including other income, Marico kept ₹12.8 as profit for shareholders, after ₹54.7 for materials and ₹9.4 for advertising.
4 · Where the operating profit comes from
India earned a segment result of ₹1,661 crore in FY26 on ₹10,348 crore of revenue, and International ₹813 crore on ₹3,263 crore.
5 · The one thing to watch
Materials took ₹55.5 of every ₹100 of Marico's FY26 revenue, up from ₹49.7 in FY25; on 2 Nov 2026 the company said copra was about 35% below its peak.
Sources: From Marico's FY26 annual report, its quarterly results filings and its Q2 FY27 quarterly update · checked
01Where the money goes · FY26
Where does ₹100 of Marico's money go?
Marico · FY26
Receipt for every ₹100
| Materials and goods bought | ₹54.7 |
|---|---|
| Other running costs | ₹10.9 |
| Advertising and sales promotion | ₹9.4 |
| Employee costs | ₹6.6 |
| Depreciation and interest | ₹1.8 |
| Tax and minority partners’ share | ₹3.7 |
| Net profit for shareholders | ₹12.8 |
| Total | ₹100 |
Each line = amount ÷ total money in × 100. Lines may not add to exactly ₹100 because of rounding.
How this is worked out
Derived from the FY26 money flow: each line = line ÷ total money in (revenue ₹13,611 crore + other income ₹204 crore) × 100. Cityfort calculation from the FY26 annual report.
Save this receipt as an image
Embed this receipt or the key numbers
Paste this code into a blog or website to show the card you choose, with a link back to this page.
Each week: the next company due to report results, explained in 5 points.
We'll email you once a week with what changed on Cityfort. Facts only, no tips. Unsubscribe any time.
We store your email address with Kit, our email provider, which also records when you sign up and whether you open or click our emails. We send a confirmation email first. See our privacy policy.
02The business in one line
What does Marico do?
Households buy Marico’s hair oils, cooking oils and foods from shops; materials take ₹54.7 of every ₹100 that comes in, and ₹12.8 is left as profit.
- Shops in India, supplied by more than 10,200 distributors, gave 76% of FY26 revenue; buyers in Bangladesh, Vietnam, the Middle East and Africa gave 24%.
- Copra (dried coconut), edible oils and packaging are the biggest costs, followed by ₹1,300 crore of advertising and sales promotion in FY26.
03Who pays it
Who pays Marico?
Shops in India, through distributors
76%
of revenue
Distributors and stockists buy Marico products and supply shops, supermarkets and online sellers, where households buy them. India gave ₹10,348 crore of FY26 revenue.
Buyers in other countries
24%
of revenue
Trade buyers in Bangladesh, Vietnam, the Middle East, South Africa and other markets. International gave ₹3,263 crore of FY26 revenue.
- Shops in India, through distributors76%
- Buyers in other countries24%
How spread out the customers are
Marico says no single customer gave 10% or more of its FY26 revenue; it does not publish top-5 or top-10 shares. The shares above are a Cityfort calculation from the FY26 annual report.
04How it makes money
How does Marico make money?
Marico earns from brands that households buy again every month, but materials take more than half of revenue, so coconut and oil prices move its profit.
Materials took ₹55.5 of every ₹100 of revenue in FY26, against ₹49.7 in FY25 (Cityfort calculation from the FY26 annual report). Revenue rose 25.7% in FY26, while EBITDA (profit before interest, tax, depreciation and amortisation) rose 9%.
EBITDA per ₹100 of revenue
₹21.0₹17.1
FY24 to FY26
- Households buy Parachute, Saffola and other packs again and again.
- More than 10,200 distributors carry them to about 5.8 million shops.
- Materials and goods bought took ₹55.5 of every ₹100 of FY26 revenue.
- Advertising and promotion took ₹1,300 crore more to keep the brands known.
- EBITDA was ₹17.1 per ₹100 of revenue in FY26, down from ₹21.0 in FY24.
- Profit pays dividends and buys new brands such as Plix, True Elements and 4700BC.
↺ Step 6 feeds back into step 1.
05Business segments · FY26
Which businesses make up Marico?
India
76%Hair oils, Saffola oils and foods, and grooming brands sold in India. Segment result (profit before shared costs, interest and tax) was ₹1,661 crore in FY26.
Revenue ₹10,348 cr · Operating profit ₹1,661 cr
International
24%Sales in Bangladesh, Vietnam, the Middle East, South Africa and other markets. Segment result was ₹813 crore in FY26.
Revenue ₹3,263 cr · Operating profit ₹813 cr
How the mix changed
- India
- International
Revenue by segment, FY22 to FY26.
₹ crore
See the numbers
06The numbers · Consolidated · ₹ crore
How has Marico done?
Revenue
₹13,611 crFY26
Revenue rose every year except FY24 and reached ₹13,611 crore in FY26; from Q1 FY27 it is reported net of some customer promotion costs.
₹ crore
See the numbers
Net profit
₹1,762 crFY26
Net profit for shareholders rose every year, from ₹1,225 crore in FY22 to ₹1,762 crore in FY26.
₹ crore
See the numbers
Net profit for every ₹100 of revenue
₹12.9FY26
Net profit per ₹100 of revenue peaked at ₹15.3 in FY24 and was ₹12.9 in FY26, the same as in FY22.
Net margin: ₹ of net profit per ₹100 of revenue
See the numbers
Free cash flow
₹1,765 crFY26
Free cash flow (operating cash minus spending on assets such as factories and machines) was positive every year and reached ₹1,765 crore in FY26.
₹ crore · cash from operations minus spending on plants and equipment
See the numbers
See all yearly numbers
EBITDA = profit before interest, tax and wear-and-tear of assets. Financial year runs April to March (March year end). Net profit is the share belonging to the company's owners.
Sources (14)
- Q4 FY22 financial results (consolidated, incl. full year FY22; NSE XBRL filing)
- Q4 FY23 financial results (consolidated, incl. full year FY23; NSE XBRL filing)
- Q4 FY24 financial results (consolidated, incl. full year FY24; NSE XBRL filing)
- Q4 FY25 financial results (consolidated, incl. full year FY25; NSE XBRL filing)
- Q4 FY26 financial results (consolidated, incl. full year FY26; NSE XBRL filing)
- Q3 FY24 financial results (consolidated; NSE XBRL filing)
- Q1 FY25 financial results (consolidated; NSE XBRL filing)
- Q2 FY25 financial results (consolidated; NSE XBRL filing)
- Q3 FY25 financial results (consolidated; NSE XBRL filing)
- Q1 FY26 financial results (consolidated; NSE XBRL filing)
- Q2 FY26 financial results (consolidated; NSE XBRL filing)
- Q3 FY26 financial results (consolidated; NSE XBRL filing)
- Q1 FY27 financial results (consolidated; NSE XBRL filing)
- Q2 FY27 financial results (consolidated; NSE XBRL filing)
07Who runs it
Who runs Marico, and did they deliver?
Harsh Mariwala
Chairman (non-executive)
Chairs the 12-member board, of whom 7 are independent directors.
Saugata Gupta
Managing Director and CEO
Re-appointed for two years from 1 Apr 2026.
Pawan Agrawal
Group CFO and CEO, International Business
Gave the cost and tax-rate comments in the 4 Aug 2026 earnings call.
Milind Barve
Lead Independent Director
What they said, and what happened
3 too early to tell · 1 delivered
Said on 5 May 2026
Marico aims for double-digit revenue growth in FY27, crossing ₹15,000 crore.
Too early to tellWhat happened
H1 FY27 revenue was ₹7,854 crore on the new revenue basis (Cityfort calculation from the Q1 and Q2 FY27 filings).
Said on 5 May 2026
Marico aims for high-teens EBITDA growth in FY27, subject to stable macro conditions.
Too early to tellWhat happened
H1 FY27 EBITDA was ₹1,528 crore against ₹1,215 crore in H1 FY26, up 25.8% (Cityfort calculation from the quarterly filings).
Said on 4 Aug 2026
Saugata Gupta said Marico would try to deliver another quarter of double-digit India volume growth within the next three quarters.
DeliveredWhat happened
The Q2 FY27 update said India underlying volume growth touched double digits.
Said on 5 May 2026
Digital-first brands to reach a double-digit EBITDA margin by the end of FY27.
Too early to tellWhat happened
Not yet reported.
Sources (8)
- Integrated Annual Report FY26
- Earnings call transcript Q1 FY27 (4 Aug 2026)
- Earnings call transcript Q4 FY26 (5 May 2026)
- Q1 FY27 financial results (consolidated; NSE XBRL filing)
- Q2 FY27 financial results (consolidated; NSE XBRL filing)
- Q1 FY26 financial results (consolidated; NSE XBRL filing)
- Q2 FY26 financial results (consolidated; NSE XBRL filing)
- Quarterly Update Q2 FY27 (business update before results)
08What could go wrong
What could go wrong for Marico?
- Raw-material prices
Copra and oil prices
Materials took ₹55.5 of every ₹100 of revenue in FY26, up from ₹49.7 in FY25 (Cityfort calculation). The annual report describes "hyperinflation in copra" during FY26.
Watch Gross margin in each results update, and the company’s comments on copra prices.
- Raw-material prices
Crude-linked packaging costs
Group CFO Pawan Agrawal said on 4 Aug 2026 that liquid paraffin and polymer costs were up 60–70%. On 2 Nov 2026 the company said crude-linked costs rose further.
Watch EBITDA per ₹100 of revenue in the Q3 FY27 results.
- Concentration
Reliance on Bangladesh
Bangladesh gave about 45% of International revenue in FY26 and 10.8% of group revenue. Its growth in constant currency (leaving out exchange-rate moves) was 4% in Q1 FY27, and the company cited persistently elevated inflation there in Q2 FY27.
Watch Bangladesh growth in each quarterly update.
- Demand
Saffola oil volumes falling
Saffola oil volumes declined in Q1 and Q2 FY27 while sales grew on higher prices. The company said it cut supply of some variants to keep the oils profitable.
Watch Saffola edible oil volumes and revenue growth.
- Execution
Acquired brands and stake-buy obligations
Goodwill (the premium paid for bought companies) and other intangible assets rose from ₹1,803 crore to ₹2,534 crore in FY26, a year with four brand deals. The company also has an obligation to buy the rest of a past acquisition, now shown under current liabilities (amounts due within a year).
Watch Digital-first EBITDA margin against the end-FY27 target, and any write-down of goodwill.
- Governance
Promoter shares pledged
Since the Jun 2025 filing, 2.03% of promoter-group shares have been shown as pledged or encumbered, against 0.13% before. That is about 1.2% of all shares (Cityfort calculation).
Watch The pledged figure in each quarterly shareholding filing.
- Other
Revenue basis changed in FY27
From Q1 FY27, Marico deducts some customer promotion costs from revenue. FY26 revenue on the new basis is ₹13,478 crore against ₹13,611 crore as first reported; profit is unchanged.
Watch Whether each growth figure compares quarters on the same basis.
Sources (9)
- Integrated Annual Report FY26
- Earnings call transcript Q1 FY27 (4 Aug 2026)
- Quarterly Update Q2 FY27 (business update before results)
- Information Update Q1 FY27
- Earnings call transcript Q4 FY26 (5 May 2026)
- Shareholding pattern, Sep 2026 (NSE XBRL filing)
- Shareholding pattern, Jun 2025 (NSE XBRL filing)
- Shareholding pattern, Mar 2025 (NSE XBRL filing)
- Earnings presentation Q1 FY27
09Supporters and critics
What do supporters and critics point to?
What supporters point to
- India underlying volume growth was 8% in FY26 and 11% in Q1 FY27, and the company said it touched double digits again in Q2 FY27.
- Cash and liquid investments of ₹2,441 crore were almost seven times borrowings of ₹355 crore on 31 Mar 2026, and CRISIL rated the company AAA/Stable.
- Free cash flow was positive in each of FY22 to FY26 and reached ₹1,765 crore in FY26.
- Foods crossed ₹1,000 crore of revenue in FY26, and markets other than Bangladesh rose to 59% of International revenue in Q1 FY27, the company says.
- The company puts the volume market share of Parachute in rigid packs within coconut oil at about 59% in the year to Jun 2026.
What critics point to
- EBITDA per ₹100 of revenue fell from ₹21.0 in FY24 to ₹17.1 in FY26; materials rose from ₹49.7 to ₹55.5 of every ₹100 of revenue between FY25 and FY26.
- Goodwill and other intangible assets rose from ₹1,803 crore to ₹2,534 crore in FY26, a year with four brand deals. Management said on 5 May 2026 it aims for a double-digit EBITDA margin in the digital-first brands by the end of FY27.
- Since the Jun 2025 filing, 2.03% of promoter-group shares have been shown as pledged or encumbered, against 0.13% before; the filings Cityfort read do not name the lender.
- Saffola oil volumes declined in Q1 and Q2 FY27 while sales grew on higher prices.
- The FY26 dividend was ₹4.00 a share, about 29% of recurring profit, against ₹10.50 and 85% in FY25, by the company’s figures.
10What to watch next
What should you watch next at Marico?
Next event
Q3 FY27 results
27 Jan 2027
Expected, based on last year's date
Q3 FY27 results
Marico has not announced the date. The date shown is an estimate based on last year, when it filed its Q3 FY26 results on 27 Jan 2026.
Full-year targets
On 4 Aug 2026 MD and CEO Saugata Gupta said Marico expects double-digit revenue growth in FY27, crossing ₹15,000 crore, and high-teens EBITDA growth. H1 FY27 revenue was ₹7,854 crore on the new basis (Cityfort calculation from the Q1 and Q2 FY27 filings).
Copra and packaging costs
On 2 Nov 2026 the company said copra was about 35% below its peak, while crude-linked costs rose further. EBITDA was ₹17.1 per ₹100 of revenue in FY26.
Comparisons on the new revenue basis
From Q1 FY27 revenue is shown net of some customer promotion costs; FY26 revenue is ₹13,478 crore on the new basis against ₹13,611 crore as first reported.
Promoter pledge
The Sep 2026 shareholding filing shows 2.03% of promoter-group shares pledged or encumbered; each quarterly filing updates the figure.
11Key facts
Key facts about Marico
- What does Marico do?
- Marico Limited, based in Mumbai, sells hair oils such as Parachute and Nihar Naturals, Saffola cooking oils and foods, and grooming brands such as Set Wet and Livon. Its revenue in FY26 (April 2025 to March 2026) was ₹13,611 crore.
- How does Marico make money?
- Marico makes money by selling branded packs that households buy again and again. In FY26, materials and goods bought took ₹54.7 of every ₹100 that came in, and Marico kept ₹12.8 as net profit for its shareholders (Cityfort calculation from the FY26 annual report).
- Who are Marico's customers?
- Marico sells through more than 10,200 distributors and stockists that reach about 5.8 million shops. India gave 76% of Marico's FY26 revenue and other countries 24%; no single customer gave 10% or more.
- How big is Marico?
- Marico's FY26 revenue was ₹13,611 crore, up from ₹10,831 crore in FY25. Its net profit for shareholders was ₹1,762 crore in FY26, up from ₹1,629 crore.
- Who owns Marico?
- On 30 Sep 2026 Marico's promoter group, which includes chairman Harsh Mariwala, owned 58.83% of the company. Foreign investors held 22.26%, Indian institutions 14.10% and other public shareholders 4.52%. The filing shows 2.03% of promoter-group shares as pledged or encumbered (given as loan collateral or otherwise tied up).
- Where does Marico sell outside India?
- Marico's International business had ₹3,263 crore of revenue in FY26, 24% of the total. Bangladesh alone gave 10.8% of Marico's FY26 revenue; Vietnam, the Middle East, Africa and other markets gave 13.1%.
- Does Marico have debt?
- On 31 Mar 2026 Marico had borrowings of ₹355 crore and cash and liquid investments of ₹2,441 crore, a net cash position of ₹2,086 crore (Cityfort calculation from the FY26 annual report). CRISIL rated it AAA/Stable.
- How did Marico do in Q2 FY27?
- In Q2 FY27 (July to September 2026), Marico's revenue was ₹3,897 crore against a restated ₹3,450 crore a year earlier. Revenue is now shown net of some customer promotion costs. Net profit, which the change does not affect, was ₹550 crore, up from ₹420 crore.
Sources (7)
- Integrated Annual Report FY26
- Q4 FY26 financial results (consolidated, incl. full year FY26; NSE XBRL filing)
- Q4 FY25 financial results (consolidated, incl. full year FY25; NSE XBRL filing)
- Shareholding pattern, Sep 2026 (NSE XBRL filing)
- Q2 FY27 financial results (consolidated; NSE XBRL filing)
- Q2 FY26 financial results (consolidated; NSE XBRL filing)
- Earnings presentation Q1 FY27
Terms on this page
- Capital expenditure (capex)
- Credit rating
- Dividend payout ratio
- EBITDA
- FII and DII holding
- Free cash flow
- Net debt
- Net profit
- Operating margin
- Promoter holding
Each explains the term in plain English, with the same number from other companies on Cityfort.
Go deeper
More detail from the same filings. Open any section.
12What it sells
12What it sells
What does Marico sell?
Parachute coconut oil
Coconut oil in bottles and packs. The company puts Parachute’s volume share of rigid-pack coconut oil at 59% in the year to Jun 2026.
Value-added hair oils
Scented and herbal hair oils such as Nihar Naturals, Hair & Care and Parachute Advansed. The company puts its value share at 29%, ranked first, in the year to Jun 2026.
Saffola cooking oils
Branded edible oils. In Q2 FY27 Saffola oil sales grew in the mid-single digits on higher prices while volumes fell, the company said.
Foods
Saffola oats, muesli and soya chunks, plus True Elements and 4700BC snacks. Foods crossed ₹1,000 crore of revenue in FY26.
Grooming and digital-first brands
Set Wet, Livon, Beardo, Just Herbs, Plix and Cosmix, several of them sold mainly online. Management said the digital-first brands ended FY26 at a yearly sales rate above ₹1,100 crore.
International brands
Parachute, HairCode, Fiancée, X-Men, Thuan Phat and others sold outside India. International revenue was ₹3,263 crore in FY26.
What it does
- Does: Sells through more than 10,200 distributors and stockists that reach about 5.8 million shops.
- Does: Runs 6 factories in India and 8 abroad, according to the FY26 annual report.
- Does: Buys stakes in young online brands: Plix, True Elements, 4700BC and Cosmix deals closed in FY26.
What it does not do
- Does not: Does not run Kaya skin clinics: Kaya was demerged (split off into a separate company) from the group from 1 Apr 2013, though Marico sells some Kaya products outside the clinics.
- Does not: Does not rely on one buyer: no single customer gave 10% or more of revenue in FY26.
- Does not: Does not have bonds or fixed deposits outstanding, according to the FY26 annual report.
13How the money flows
13How the money flows · FY26
How does money flow through Marico?
Money in
- Revenue from operations₹13,611 cr
- Other income₹204 cr
The company
Marico
₹13,815 cr came in
Money out
- Materials and goods bought₹7,559 cr
- Employee costs₹916 cr
- Advertising and sales promotion₹1,300 cr
- Other running costs₹1,508 cr
- Depreciation and interest₹255 cr
- Tax and minority partners’ share₹515 cr
- Net profit for Marico shareholders₹1,762 cr
- In FY26 Marico’s products brought in ₹13,611 crore of revenue, plus ₹204 crore of other income.
- Materials and goods bought for resale took ₹7,559 crore, the biggest cost by far.
- Advertising and sales promotion took ₹1,300 crore, other running costs ₹1,508 crore and employees ₹916 crore.
- Depreciation (₹202 crore) and interest (₹53 crore) took ₹255 crore. Tax took ₹464 crore and partners in part-owned subsidiaries ₹51 crore.
- ₹1,762 crore was left as net profit for Marico’s shareholders.
Sources (1)
14What it needs to run
14What it needs to run
What does Marico need to run?
Copra (dried coconut)
The raw material for Parachute. The FY26 annual report mentions "hyperinflation in copra"; on 2 Nov 2026 the company said copra was about 35% below its peak.
Oils and crude-linked packaging
Edible oils, liquid paraffin and plastic bottles. Group CFO Pawan Agrawal said on 4 Aug 2026 that liquid paraffin and polymer costs were up 60–70%.
Factories
6 factories in India, including Perundurai, Sanand, Puducherry and Jalgaon, and 8 abroad, according to the FY26 annual report.
Distributors and shops
More than 10,200 distributors and stockists covering about 5.8 million retail outlets, per the FY26 annual report.
Advertising
₹1,300 crore went on advertising and sales promotion in FY26, about ₹9.6 of every ₹100 of revenue (Cityfort calculation from the FY26 annual report).
15Where it sells
15Where it sells · FY26
Where does Marico sell?
- India76%
- Bangladesh10.8%
- Other countries (Vietnam, Middle East, Africa and others)13.1%
Sources (1)
16Where growth could come from
16Where growth could come from
Where could Marico's growth come from?
On 4 Aug 2026 MD and CEO Saugata Gupta said Marico expects double-digit revenue growth in FY27, crossing ₹15,000 crore, and high-teens EBITDA growth. On 2 Nov 2026 the company said it was likely to surpass its near-term guidance.
Foods
WorkingAbove ₹1,300 crore a year, Q1 FY27
Foods sales grew 43% in Q1 FY27 to a yearly sales rate above ₹1,300 crore, after crossing ₹1,000 crore of revenue in FY26.
Status: Working, on track against what the company said.
Digital-first and premium personal care
EarlyAbove ₹1,100 crore a year, end of FY26
Management said these brands left FY26 at a yearly sales rate above ₹1,100 crore and aims for a double-digit EBITDA margin by the end of FY27.
Status: Early, too early to judge.
Value-added hair oils
WorkingGrowth in the twenties, Q2 FY27
The company said value-added hair oils grew in the twenties in Q2 FY27, its sixth straight quarter of strong growth.
Status: Working, on track against what the company said.
International beyond Bangladesh
Working59% of International, Q1 FY27
Markets other than Bangladesh rose from 50% of International revenue in FY20 to 55% in FY26 and 59% in Q1 FY27, the company says.
Status: Working, on track against what the company said.
India volumes
Working11% volume growth, Q1 FY27
India underlying volume growth was 8% in FY26 and 11% in Q1 FY27; the company said it touched double digits again in Q2 FY27.
Status: Working, on track against what the company said.
Status compares progress with what the company itself said it would do: Working = on track against what the company said; Mixed = partly on track; Behind = behind the company's own plan; New = recently announced; Early = too early to judge.
17Financial strength and debt
17Financial strength · 31 Mar 2026
How much debt does Marico have?
- Total debt₹355 cr
- Cash and investments₹2,441 cr
- Net cash (cash minus debt)₹2,086 cr
- Net worth (shareholders' money)₹4,494 cr
- Debt to equity
- 0.08×
- ₹ of debt for every ₹1 of shareholders' money
- Interest cover
- 41×
- how many times operating profit covers interest
- Cash and liquid investments = cash, other bank balances and current investments; net cash and debt to equity are Cityfort calculations from the FY26 annual report. Borrowings exclude ₹202 crore of lease liabilities.
- Interest coverage of 41.0 times is the company’s own FY26 figure.
- In FY26 the company revalued an obligation to buy the remaining stake in a past acquisition and moved it to current liabilities; other current financial liabilities were ₹1,585 crore.
- Income-tax demands under dispute were ₹324 crore on 31 Mar 2026.
Sources (1)
18Who owns it
18Who owns it · Q2 FY27
Who owns Marico?
- Promoters (founders or parent company)58.8%, of which pledged 1.2%
- Foreign institutions (FII)22.3%
- Indian institutions (DII)14.1%
- Public and others4.8%
- Pledged: 2.0% of promoter shares (1.2% of all shares)1.2%
Promoter shares pledged
2.0% of promoter shares
A pledge means promoters gave shares as security for a loan. If the loan isn't repaid, the lender can sell them.
How ownership changed
* Pledged = share of the promoters' own holding reported as pledged. In older filings this can include shares “otherwise encumbered”; the governance flags say when.
Sources (12)
- Shareholding pattern, Sep 2026 (NSE XBRL filing)
- Shareholding pattern, Jun 2026 (NSE XBRL filing)
- Shareholding pattern, Mar 2026 (NSE XBRL filing)
- Shareholding pattern, Dec 2025 (NSE XBRL filing)
- Shareholding pattern, Sep 2025 (NSE XBRL filing)
- Shareholding pattern, Jun 2025 (NSE XBRL filing)
- Shareholding pattern, Mar 2025 (NSE XBRL filing)
- Shareholding pattern, Dec 2024 (NSE XBRL filing)
- Shareholding pattern, Sep 2024 (NSE XBRL filing)
- Shareholding pattern, Jun 2024 (NSE XBRL filing)
- Shareholding pattern, Mar 2024 (NSE XBRL filing)
- Shareholding pattern, Dec 2023 (NSE XBRL filing)
19What it does with profit
19What it does with profit
What does Marico do with its profit?
Dividend per share
₹4.00FY26
Dividend paid for each share, by financial year.
₹ per share
See the numbers
No buybacks or fund raises in the period covered.
20Governance signals
20Governance signals
What do Marico's governance filings show?
- Auditor
- B S R & Co. LLP
- Auditor changes
- None in the period covered
- Audit qualifications
- None reported
- Related-party dealings
- The FY26 annual report says there were no material related-party transactions under the listing rules. The auditor’s report on the FY26 consolidated accounts is unmodified.
- Credit rating
- CRISIL AAA (outlook Stable), 31 Mar 2026
A credit rating describes the company's ability to repay debt. It is not a rating of the share.
Flags to know about
pledge · 19 Oct 2026
Promoter shares pledged or encumbered
The Sep 2026 shareholding filing shows 2.03% of promoter-group shares pledged or encumbered, a level first shown in the Jun 2025 filing; earlier filings showed 0.13%. The filings Cityfort read do not name the lender.
21How it got here
21How it got here
How did Marico get here?
1990
Milestone
Marico begins operating
The company says it has operated since 1990.
1996
Milestone
Shares listed
Marico’s shares were listed in 1996.
1999
Milestone
Bangladesh business set up
Marico Bangladesh Limited dates from 6 Sep 1999; Bangladesh gave 10.8% of group revenue in FY26.
2013
Business-model change
Kaya clinics demerged
The Kaya skin-clinic business was demerged from the group from 1 Apr 2013.
2021
Business-model change
Just Herbs becomes a subsidiary
Just Herbs, an online beauty brand, became a subsidiary on 21 Jul 2021.
2025
Milestone
Plix and True Elements stakes raised
Marico took Plix to 60% on 31 May 2025 and made True Elements wholly owned on 17 Oct 2025.
2026
Milestone
4700BC and Cosmix bought
It bought 93.27% of 4700BC’s owner for ₹227 crore on 29 Jan 2026 and 60% of Cosmix on 5 Feb 2026.
2026
Milestone
Revenue crosses ₹13,000 crore
FY26 revenue rose 26% to ₹13,611 crore, which the company called its highest growth in 14 years.
2026
Business-model change
New revenue accounting
From Q1 FY27, some customer promotion costs are deducted from revenue instead of being shown as expenses.
22Sources and changes
Where every number on this page comes from
Sources (38 documents)
- S1Q2 FY27 financial results (consolidated; NSE XBRL filing) · NSE · Tier 1: company or exchange filing · 2 Nov 2026
- S2Shareholding pattern, Sep 2026 (NSE XBRL filing) · NSE · Tier 1: company or exchange filing · 19 Oct 2026
- S3Q1 FY27 financial results (consolidated; NSE XBRL filing) · NSE · Tier 1: company or exchange filing · 4 Aug 2026
- S4Shareholding pattern, Jun 2026 (NSE XBRL filing) · NSE · Tier 1: company or exchange filing · 3 Aug 2026
- S5Shareholding pattern, Dec 2025 (NSE XBRL filing) · NSE · Tier 1: company or exchange filing · 3 Aug 2026
- S6Shareholding pattern, Sep 2025 (NSE XBRL filing) · NSE · Tier 1: company or exchange filing · 3 Aug 2026
- S7Q4 FY26 financial results (consolidated, incl. full year FY26; NSE XBRL filing) · NSE · Tier 1: company or exchange filing · 5 May 2026
- S8Shareholding pattern, Mar 2026 (NSE XBRL filing) · NSE · Tier 1: company or exchange filing · 16 Apr 2026
- S9Q4 FY25 financial results (consolidated, incl. full year FY25; NSE XBRL filing) · NSE · Tier 1: company or exchange filing · 6 Feb 2026
- S10Q3 FY26 financial results (consolidated; NSE XBRL filing) · NSE · Tier 1: company or exchange filing · 27 Jan 2026
- S11Q2 FY26 financial results (consolidated; NSE XBRL filing) · NSE · Tier 1: company or exchange filing · 14 Nov 2025
- S12Shareholding pattern, Jun 2025 (NSE XBRL filing) · NSE · Tier 1: company or exchange filing · 2 Sep 2025
- S13Q1 FY26 financial results (consolidated; NSE XBRL filing) · NSE · Tier 1: company or exchange filing · 4 Aug 2025
- S14Shareholding pattern, Mar 2025 (NSE XBRL filing) · NSE · Tier 1: company or exchange filing · 15 Apr 2025
- S15Q3 FY25 financial results (consolidated; NSE XBRL filing) · NSE · Tier 1: company or exchange filing · 31 Jan 2025
- S16Shareholding pattern, Dec 2024 (NSE XBRL filing) · NSE · Tier 1: company or exchange filing · 17 Jan 2025
- S17Shareholding pattern, Sep 2024 (NSE XBRL filing) · NSE · Tier 1: company or exchange filing · 2 Dec 2024
- S18Q2 FY25 financial results (consolidated; NSE XBRL filing) · NSE · Tier 1: company or exchange filing · 29 Oct 2024
- S19Q1 FY25 financial results (consolidated; NSE XBRL filing) · NSE · Tier 1: company or exchange filing · 5 Aug 2024
- S20Shareholding pattern, Jun 2024 (NSE XBRL filing) · NSE · Tier 1: company or exchange filing · 18 Jul 2024
- S21Q4 FY24 financial results (consolidated, incl. full year FY24; NSE XBRL filing) · NSE · Tier 1: company or exchange filing · 6 May 2024
- S22Shareholding pattern, Mar 2024 (NSE XBRL filing) · NSE · Tier 1: company or exchange filing · 19 Apr 2024
- S23Q3 FY24 financial results (consolidated; NSE XBRL filing) · NSE · Tier 1: company or exchange filing · 29 Jan 2024
- S24Shareholding pattern, Dec 2023 (NSE XBRL filing) · NSE · Tier 1: company or exchange filing · 18 Jan 2024
- S25Q4 FY23 financial results (consolidated, incl. full year FY23; NSE XBRL filing) · NSE · Tier 1: company or exchange filing · 5 May 2023
- S26Q4 FY22 financial results (consolidated, incl. full year FY22; NSE XBRL filing) · NSE · Tier 1: company or exchange filing · 5 May 2022
- S27Integrated Annual Report FY26 · Marico Limited · Tier 1: company or exchange filing
- S28Integrated Annual Report FY25 · Marico Limited · Tier 1: company or exchange filing · 11 Jul 2025
- S29Integrated Annual Report FY24 · Marico Limited · Tier 1: company or exchange filing
- S30Integrated Annual Report FY23 · Marico Limited · Tier 1: company or exchange filing
- S31Annual Report FY22 · Marico Limited · Tier 1: company or exchange filing
- S32Information Update Q1 FY27 · Marico Limited · Tier 1: company or exchange filing · 4 Aug 2026
- S33Earnings presentation Q1 FY27 · Marico Limited · Tier 1: company or exchange filing · 4 Aug 2026
- S34Earnings call transcript Q1 FY27 (4 Aug 2026) · Marico Limited · Tier 1: company or exchange filing · 4 Aug 2026
- S35Quarterly Update Q2 FY27 (business update before results) · Marico Limited · Tier 1: company or exchange filing · 2 Nov 2026
- S36Earnings call transcript Q4 FY26 (5 May 2026) · Marico Limited · Tier 1: company or exchange filing · 5 May 2026
- S37Information Update Q4 FY26 · Marico Limited · Tier 1: company or exchange filing · 5 May 2026
- S38Corporate presentation, March 2026 · Marico Limited · Tier 1: company or exchange filing · 1 Mar 2026
Changes to this page (v1 · 19 Nov 2026)
- v1 · 19 Nov 2026First version. (first version)
Numbers come only from tier 1 and tier 2 sources. Read how we research.
Disclaimer
For learning only. Cityfort is not a SEBI-registered adviser and does not recommend buying or selling any security. Prices shown are dated and may be out of date.
Investing in securities involves risk, including loss of capital. Before making any investment decision, do your own research and consider consulting a SEBI-registered investment adviser.
Cityfort, its owners and contributors may or may not hold securities of companies covered. Content is not an offer or solicitation to buy or sell any security.
Read the full disclaimerHide the full disclaimer
Cityfort publishes educational content that explains how listed companies work. Cityfort is not registered with the Securities and Exchange Board of India (SEBI) as an Investment Adviser or Research Analyst and does not provide investment advice, recommendations, ratings, price targets or any opinion on whether to buy, sell or hold any security.
All information is taken from publicly available sources, mainly company filings on BSE and NSE, which are listed on each page with dates. We work to keep it accurate and correct errors publicly, but we do not guarantee that it is complete, accurate or up to date. Any market price or price-based ratio shown is dated, may be out of date by the time you read it, and is included only to explain concepts.
Statements by company management are reported as statements, with their date and source; they are not our forecasts.