Fast Moving Consumer Goods · NSE: TATACONSUM · BSE: 500800
Tata Consumer: how the business works
Tata Consumer sells tea, coffee, salt, pulses and ready-to-cook foods in India and abroad; FY26 revenue was ₹20,290 crore, 66% of it from India.
Follow Tata Consumer
Email me when Tata Consumer's page is updated after results.
We store your email address with Kit, our email provider, which also records when you sign up and whether you open or click our emails. We send a confirmation email first. See our privacy policy.
Tata Consumer Products Limited · Mumbai, Maharashtra (head office); registered office in Kolkata · Founded 1962
Updated for Q2 FY27 · checked
- Revenue, FY26
- ₹20,290 cr
- Profit to shareholders, FY26
- ₹1,542 cr
- Households reached in India (company figure)
- 290 million
- Incorporated
- 1962
- Promoter holding (Tata group), Sep 2026
- 33.83%
The short version
Tata Consumer in 5 points
1 · What it sells
Tata Consumer sells packaged tea, coffee, salt, pulses, spices, ready-to-cook foods and drinks, and its FY26 revenue from operations was ₹20,290 crore.
2 · Who pays it
In FY26, shoppers buying its brands in India paid 62.5% of Tata Consumer's segment revenue, shoppers abroad 25.7%, buyers of instant coffee and plantation produce 11.7%, and others 0.2%.
3 · What it keeps from ₹100
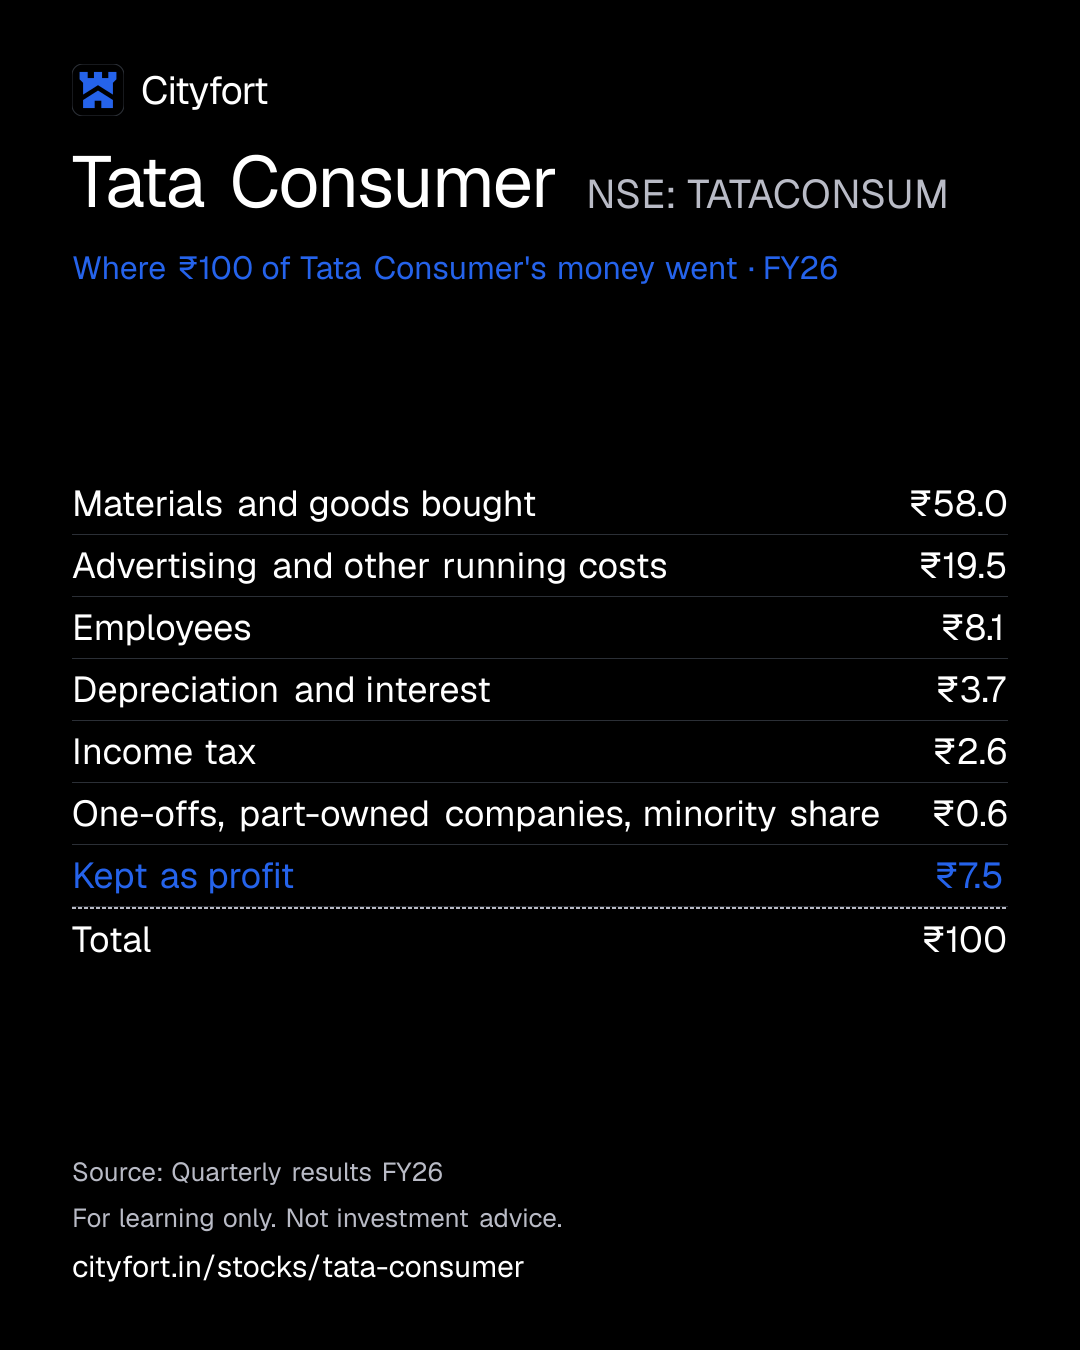
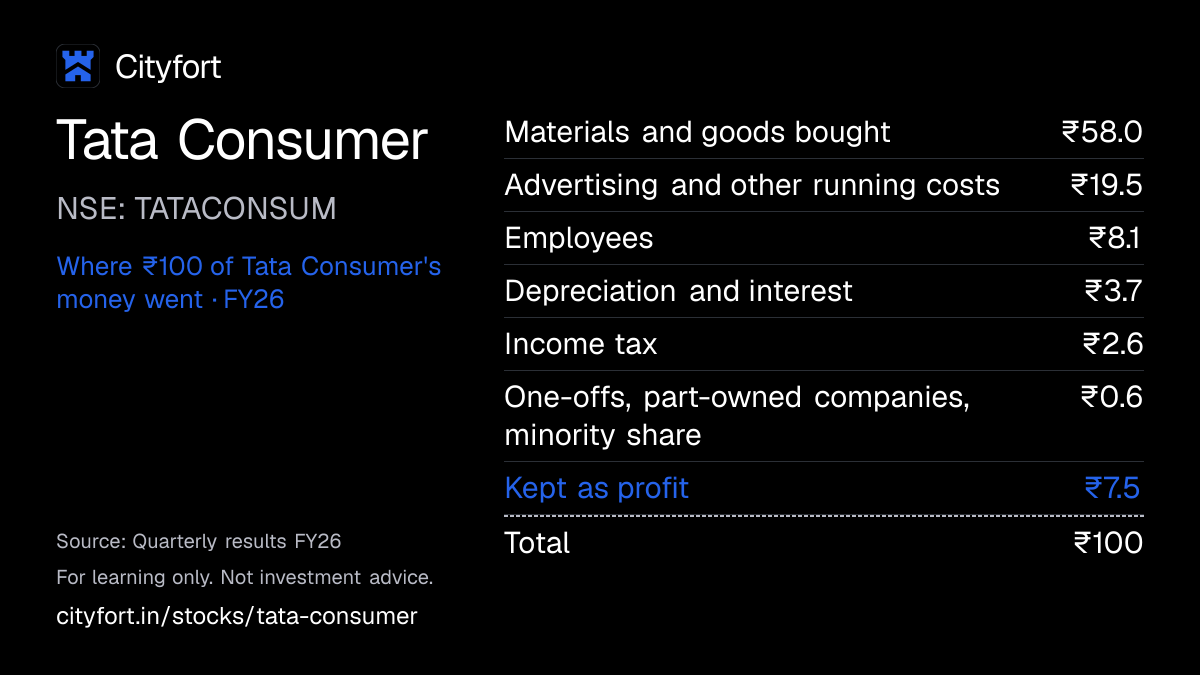
Of every ₹100 that came in during FY26, including ₹165 crore of other income, Tata Consumer kept ₹7.5 as profit for shareholders, after ₹58.0 for materials and goods bought.
4 · Where the operating profit comes from
India Business earned ₹1,504 crore of Tata Consumer's FY26 segment result, International ₹626 crore and Non-Branded ₹280 crore, before finance costs and tax.
5 · The one thing to watch
In Q2 FY27, revenue from what Tata Consumer's presentation groups as India tea and coffee fell 1% from a year earlier, to ₹1,244 crore, while its grouping of growth businesses rose 40%, to ₹1,438 crore.
Sources: From Tata Consumer's FY26 annual report, its FY26 and Q2 FY27 results filings and its Q2 FY27 investor presentation · checked
01Where the money goes · FY26
Where does ₹100 of Tata Consumer's money go?
Tata Consumer · FY26
Receipt for every ₹100
| Materials and goods bought | ₹58.0 |
|---|---|
| Advertising and other running costs | ₹19.5 |
| Employees | ₹8.1 |
| Depreciation and interest | ₹3.7 |
| Income tax | ₹2.6 |
| One-offs, part-owned companies, minority share | ₹0.6 |
| Kept as profit | ₹7.5 |
| Total | ₹100 |
Each line = amount ÷ total money in × 100. Lines may not add to exactly ₹100 because of rounding.
How this is worked out
Of every ₹100 that came in during FY26: revenue (₹20,290 crore) plus ₹165 crore of other income. The last cost line is ₹20 crore of net one-off costs, a ₹91 crore loss at joint ventures and associates, and ₹4.5 crore of profit that belongs to minority shareholders of subsidiaries. Lines add to 100.
Save this receipt as an image
Embed this receipt or the key numbers
Paste this code into a blog or website to show the card you choose, with a link back to this page.
Each week: the next company due to report results, explained in 5 points.
We'll email you once a week with what changed on Cityfort. Facts only, no tips. Unsubscribe any time.
We store your email address with Kit, our email provider, which also records when you sign up and whether you open or click our emails. We send a confirmation email first. See our privacy policy.
02The business in one line
What does Tata Consumer do?
Shoppers in India and over 40 countries pay Tata Consumer for packaged tea, coffee, salt and foods; most of the money goes on buying materials and goods, and what's left is profit.
- In FY26, India brought in ₹13,442 crore (66%) of revenue and other countries ₹6,848 crore (34%), including exports from India.
- Materials and goods bought took ₹58.0 of every ₹100 that came in during FY26; ₹7.5 was left as profit for shareholders.
03Who pays it
Who pays Tata Consumer?
Shoppers buying its brands in India
62.5%
of revenue
India Business segment: bought through traditional trade (59% of India business in FY26) and alternate channels (41%), such as modern trade, e-commerce and quick commerce. Share is of FY26 segment revenue.
Shoppers abroad
25.7%
of revenue
International Business segment: tea and coffee bought in the UK, Canada, the US and other countries. Share is of FY26 segment revenue.
Buyers of instant coffee and plantation produce
11.7%
of revenue
Non-Branded Business segment: instant coffee (solubles) and plantation produce sold without the company's consumer brands. Share is of FY26 segment revenue.
Others
0.2%
of revenue
A small Others segment. Share is of FY26 segment revenue.
- Shoppers buying its brands in India62.5%
- Shoppers abroad25.7%
- Buyers of instant coffee and plantation produce11.7%
- Others0.2%
How spread out the customers are
Tata Consumer does not disclose revenue by customer. Segment shares are of ₹20,457 crore of FY26 segment revenue, before ₹167 crore of sales between segments.
04How it makes money
How does Tata Consumer make money?
Growth businesses such as Tata Sampann and Capital Foods went from 8% of India business in FY21 to 31% in FY26.
Materials take ₹58.0 of every ₹100, so selling prices against tea, coffee and salt costs set the margin. EBITDA (profit before interest, tax and wear-and-tear, excluding other income) stayed between ₹12.9 and ₹14.6 per ₹100 of revenue in FY22–FY26. Growth businesses rose from 8% of India business in FY21 to 31% in FY26.
Growth businesses' share of India business
8%31%
FY21 to FY26
- Shoppers buy Tata Tea, its salt and Tata Sampann from the 4.5 million outlets it distributes to.
- Materials take ₹58.0 of every ₹100, so prices must keep up with tea, coffee and salt costs.
- Advertising took 6.7% of India business sales in FY26 to support the brands.
- FY26 operating cash flow was ₹2,422 crore and free cash flow ₹1,973 crore.
- Borrowing and a ₹2,981 crore rights issue paid for Capital Foods and Organic India in FY24–FY25.
- Growth businesses reached 31% of India business in FY26, up from 8% in FY21.
↺ Step 6 feeds back into step 1.
05Business segments · FY26
Which businesses make up Tata Consumer?
India Business
62.5%Branded tea, coffee, salt, foods and drinks sold in India, including Capital Foods from Feb 2024 and Organic India from Apr 2024. Segment result ₹1,504 crore in FY26.
Revenue ₹12,779 cr · Operating profit ₹1,504 cr
International Business
25.7%Branded tea and coffee sold abroad. Segment result ₹626 crore in FY26.
Revenue ₹5,251 cr · Operating profit ₹626 cr
Non-Branded Business
11.7%Instant coffee and plantation produce. Segment result ₹280 crore in FY26, down from ₹407 crore in FY25.
Revenue ₹2,387 cr · Operating profit ₹280 cr
Others
0.2%Its ₹122 crore FY26 result is larger than its ₹41 crore revenue; the filings checked do not break it down.
Revenue ₹40.6 cr · Operating profit ₹122 cr
How the mix changed
- India Business
- International Business
- Non-Branded Business
- Others
Revenue by segment, FY22 to FY26.
₹ crore
See the numbers
Sources (6)
- Consolidated audited financial results Q4 and FY22 (XBRL)
- Consolidated audited financial results Q4 and FY23 (XBRL)
- Consolidated audited financial results Q4 and FY24 (XBRL)
- Consolidated audited financial results Q4 and FY25 (integrated filing XBRL)
- Consolidated audited financial results Q4 and FY26 (integrated filing XBRL)
- Investor presentation, quarter ended March 2026 (Q4 FY26)
06The numbers · Consolidated · ₹ crore
How has Tata Consumer done?
Revenue
₹20,290 crFY26
Revenue rose every year, from ₹12,425 crore in FY22 to ₹20,290 crore in FY26, and FY24–FY25 growth includes Capital Foods (bought Feb 2024) and Organic India (bought Apr 2024).
₹ crore
See the numbers
Net profit
₹1,542 crFY26
Profit for shareholders rose from ₹936 crore in FY22 to ₹1,542 crore in FY26, with a dip in FY24, when ₹327 crore of net one-off costs included restructuring and acquisition expenses.
₹ crore
See the numbers
Net profit for every ₹100 of revenue
₹7.6FY26
Profit for shareholders per ₹100 of revenue stayed between ₹7.3 (FY25) and ₹8.7 (FY23), and was ₹7.6 in FY26.
Net margin: ₹ of net profit per ₹100 of revenue
See the numbers
Free cash flow
₹1,973 crFY26
Free cash flow (Cityfort calculation: operating cash flow minus capital spending) rose from ₹1,242 crore in FY22 to ₹1,973 crore in FY26, against ₹820 crore of dividends paid in FY26.
₹ crore · cash from operations minus spending on plants and equipment
See the numbers
See all yearly numbers
EBITDA = profit before interest, tax and wear-and-tear of assets. Financial year runs April to March (March year end). Net profit is the share belonging to the company's owners. Total net income differs from net profit to the company's owners: Net profit is the shareholders' share. The higher total also includes profit belonging to minority shareholders of subsidiaries; that share fell after Tata Coffee merged into the company in Jan 2024.
Sources (16)
- Consolidated audited financial results Q4 and FY22 (XBRL)
- Integrated Annual Report FY22 (2021-22)
- Integrated Annual Report FY23 (2022-23)
- Consolidated audited financial results Q4 and FY23 (XBRL)
- Consolidated audited financial results Q4 and FY24 (XBRL)
- Integrated Annual Report FY24 (2023-24)
- Consolidated audited financial results Q4 and FY25 (integrated filing XBRL)
- Integrated Annual Report FY25 (2024-25)
- Consolidated audited financial results Q4 and FY26 (integrated filing XBRL)
- Integrated Annual Report FY26 (2025-26)
- Consolidated financial results Q3 FY25 (XBRL)
- Consolidated financial results Q1 FY26 (integrated filing XBRL)
- Consolidated financial results Q2 FY26 (integrated filing XBRL)
- Consolidated financial results Q3 FY26 (integrated filing XBRL)
- Consolidated financial results Q1 FY27 (integrated filing XBRL)
- Consolidated financial results Q2 FY27 (integrated filing XBRL)
07Who runs it
Who runs Tata Consumer, and did they deliver?
N. Chandrasekaran
Chairman (non-executive)
Sunil D'Souza
Managing Director and CEO
Re-appointed with effect from 4 Apr 2025.
Ajit Krishnakumar
Executive Director and COO
Ashish Goenka
Group Chief Financial Officer
Speaks for the company on results calls.
Sivakumar Sivasankaran
Chief Financial Officer
Signed the FY26 financial statements as CFO.
Delnaz Dara Harda
Company Secretary
What they said, and what happened
3 too early to tell · 1 partly delivered
Said on 8 May 2026
Expand margins by 50 to 75–80 basis points in FY27: on the Q4 FY26 call management called it "a given", with quarter-to-quarter swings from seasonality.
Too early to tellWhat happened
In H1 FY27 the company's own EBITDA margin was 13.8%, 60 basis points higher than a year earlier. On 24 Jul 2026 management said it had guided for 50 to 70 basis points; on 26 Oct 2026 it said it had seen margin pressure and raised prices.
Said on 24 Jul 2026
Grow Capital Foods and Organic India by 25% to 30%: management said on 24 Jul 2026 this "should be the new normal going forward".
Too early to tellWhat happened
Combined growth was 15% in Q2 FY27 (Capital Foods +18%, Organic India +9%), after +40% and +27% in Q1 FY27. On 26 Oct 2026 management said it still expects 25% to 30% growth.
Said on 8 May 2026
In tea, target mid-single-digit growth plus a couple of basis points from price and mix, for mid- to high-single-digit total revenue growth.
Too early to tellWhat happened
India tea and coffee revenue fell 4% in Q1 FY27 (tea volume +2%) and 1% in Q2 FY27 (tea volume flat).
Said on 12 Jan 2024
The Capital Foods acquisition presentation put its FY24 net revenue at about ₹750 crore and said it had potential for strong double-digit revenue growth.
Partly deliveredWhat happened
Capital Foods' revenue in the group was ₹839 crore in FY26, up 5%. It rose 18% to ₹264 crore in Q2 FY27.
Sources (8)
- Integrated Annual Report FY26 (2025-26)
- Integrated Annual Report FY25 (2024-25)
- Q2 FY27 earnings call transcript (call 26 Oct 2026)
- Q4 FY26 earnings call transcript (call 8 May 2026)
- Investor presentation, quarter ended September 2026 (Q2 FY27)
- Q1 FY27 earnings call transcript (call 24 Jul 2026)
- Investor presentation, quarter ended June 2026 (Q1 FY27)
- Investor presentation: acquisition of Capital Foods and Organic India
08What could go wrong
What could go wrong for Tata Consumer?
- Demand
India tea sales are not growing
India tea and coffee revenue fell 4% in Q1 FY27 and 1% in Q2 FY27, with tea volume flat in Q2. The company's Nielsen data show its tea value share down 0.5 percentage points in the year to Mar 2026.
Watch India tea and coffee revenue growth and tea volume each quarter.
- Raw-material prices
Input costs
Materials and goods bought took ₹58.0 of every ₹100 that came in during FY26. Management said on 26 Oct 2026 that it had seen margin pressure during the year and had raised prices, including on salt.
Watch EBITDA per ₹100 of revenue each quarter (₹13.7 in Q2 FY27, Cityfort calculation).
- Execution
Acquisitions must deliver
Goodwill (₹11,884 crore) and other intangible assets, mostly brands (₹7,112 crore), were ₹18,996 crore on 31 Mar 2026, 87% of shareholders' equity (Cityfort calculation). Capital Foods and Organic India grew 15% combined in Q2 FY27, against the 25% to 30% growth management said on 24 Jul 2026 it expects.
Watch Capital Foods and Organic India growth, and any write-down (impairment) of goodwill or brands.
- Cash and liquidity
Paying for the rest of Capital Foods
Tata Consumer committed to buy the remaining 25% of Capital Foods. ICRA says this is likely after Mar 2027, at a performance-linked mark-up; the filings checked give no price.
Watch An announcement of the purchase and its price.
- Currency
Sales abroad and currency
International was 25.7% of FY26 segment revenue. In Q2 FY27 international revenue rose 7% in rupees but fell 2% in constant currency; UK sales fell 8% in constant currency, which the company linked to a heatwave.
Watch International growth in constant currency each quarter.
- Raw-material prices
Swings in the non-branded coffee business
Non-Branded revenue rose from ₹1,910 crore in FY25 to ₹2,387 crore in FY26, but its segment result fell from ₹407 crore to ₹280 crore.
Watch Non-Branded segment result each quarter (₹98 crore in Q2 FY27).
Sources (11)
- Investor presentation, quarter ended June 2026 (Q1 FY27)
- Investor presentation, quarter ended September 2026 (Q2 FY27)
- Investor presentation, quarter ended March 2026 (Q4 FY26)
- Consolidated audited financial results Q4 and FY26 (integrated filing XBRL)
- Q2 FY27 earnings call transcript (call 26 Oct 2026)
- Consolidated financial results Q2 FY27 (integrated filing XBRL)
- Integrated Annual Report FY26 (2025-26)
- Q1 FY27 earnings call transcript (call 24 Jul 2026)
- Integrated Annual Report FY24 (2023-24)
- ICRA rationale: Tata Consumer Products Limited, ratings reaffirmed
- Consolidated audited financial results Q4 and FY25 (integrated filing XBRL)
09Supporters and critics
What do supporters and critics point to?
What supporters point to
- Revenue rose every year from FY22 to FY26, from ₹12,425 crore to ₹20,290 crore, including acquisitions.
- Growth businesses rose from 8% of India business in FY21 to 31% in FY26, and were 38% in Q2 FY27.
- On 31 Mar 2026 cash, bank deposits and current investments were ₹2,168 crore more than borrowings; ICRA rates its long-term bank facilities AAA (Stable).
- Free cash flow was ₹1,973 crore in FY26, against ₹820 crore of dividends paid.
- In H1 FY27 the company's own EBITDA margin was 13.8%, up 60 basis points from a year earlier.
What critics point to
- India tea and coffee revenue fell 4% in Q1 FY27 and 1% in Q2 FY27.
- Profit for shareholders was 6.2% to 7.4% of year-end shareholders' equity each year in FY22–FY26 (Cityfort calculation); ICRA says return on capital "continues to remain subdued".
- Goodwill and other intangible assets (mostly brands) were ₹18,996 crore on 31 Mar 2026, 87% of shareholders' equity (Cityfort calculation).
- Capital Foods' revenue rose 5% in FY26, to ₹839 crore.
- Capital Foods and Organic India grew 15% combined in Q2 FY27, against the 25% to 30% growth management said on 24 Jul 2026 it expects.
10What to watch next
What should you watch next at Tata Consumer?
Next event
Q3 FY27 results (date not announced by 11 Nov 2026; Q3 FY26 results came on 27 Jan 2026)
Date not announced yet.
FY27 margin
Management said on 8 May 2026 that 50 to 75–80 basis points of margin gain in FY27 was "a given". In H1 FY27 the company's EBITDA margin was 13.8%, up 60 basis points.
India tea
India tea and coffee revenue fell 1% in Q2 FY27, to ₹1,244 crore, with tea volume flat.
The rest of Capital Foods
Tata Consumer owns 75% of Capital Foods. ICRA says the purchase of the other 25% is likely after Mar 2027.
11Key facts
Key facts about Tata Consumer
- What does Tata Consumer Products do?
- Tata Consumer Products sells packaged tea, coffee, salt, pulses, spices, ready-to-cook foods, drinks and herbal supplements. Its brands include Tata Tea, Tetley, Tata Sampann, Himalayan, Ching's Secret and Organic India. Tata Consumer Products' FY26 revenue from operations was ₹20,290 crore.
- How does Tata Consumer Products make money?
- Tata Consumer Products makes money by selling branded food and drinks. In FY26 its India Business segment brought in 62.5% of segment revenue, International 25.7% and Non-Branded (instant coffee and plantation produce) 11.7%.
- Who are Tata Consumer Products' customers?
- Tata Consumer Products sells to shoppers through distributors, shops, modern trade, e-commerce and quick commerce. The company says it reaches 290 million households in India and distributes to 4.5 million retail outlets. Tata Consumer Products does not disclose revenue by customer.
- How big is Tata Consumer Products?
- Tata Consumer Products' FY26 revenue was ₹20,290 crore, up 15.2% from ₹17,618 crore in FY25. FY26 profit for shareholders was ₹1,542 crore, up from ₹1,278 crore in FY25.
- Who owns Tata Consumer Products?
- On 30 Sep 2026 the Tata group promoters owned 33.83% of Tata Consumer Products, including Tata Sons with 28.68% and Tata Investment Corporation with 4.65%. Domestic institutions held 25.34%, foreign investors 19.76% and other shareholders 21.05%. No promoter shares were pledged.
- Which companies has Tata Consumer Products bought recently?
- Tata Consumer Products bought 75% of Capital Foods (Ching's Secret, Smith & Jones) on 1 Feb 2024 for ₹3,881.25 crore, and 99.99% of Organic India on 16 Apr 2024, with the last 0.01% on 13 Dec 2024; the consideration for the whole Organic India acquisition, measured at fair value, was ₹1,952.09 crore. Organic India added ₹381 crore of revenue in FY25.
- Does Tata Consumer Products have debt?
- On 31 Mar 2026 Tata Consumer Products had borrowings of ₹2,120 crore and ₹4,289 crore of cash, bank deposits and current investments, so cash exceeded borrowings by ₹2,168 crore (Cityfort calculation). Lease liabilities were a further ₹699 crore.
- What dividend does Tata Consumer Products pay?
- Tata Consumer Products' board recommended a dividend of ₹10 per share for FY26, up from ₹8.25 for FY25. That was 64.1% of FY26 basic earnings per share of ₹15.59 (Cityfort calculation).
- Is Tata Starbucks part of Tata Consumer Products' revenue?
- No. Tata Starbucks is a 50:50 joint venture of Tata Consumer Products, so only Tata Consumer's share of its profit or loss is counted, below revenue. Tata Starbucks had FY26 revenue of ₹1,367 crore and 505 stores in 81 cities on 30 Sep 2026.
Sources (10)
- Investor presentation, quarter ended September 2026 (Q2 FY27)
- Reg 30 disclosure: acquisition of Capital Foods Private Limited
- Consolidated audited financial results Q4 and FY26 (integrated filing XBRL)
- Integrated Annual Report FY26 (2025-26)
- Consolidated audited financial results Q4 and FY25 (integrated filing XBRL)
- Shareholding pattern, quarter ended 30 Sep 2026 (XBRL)
- Integrated Annual Report FY24 (2023-24)
- Integrated Annual Report FY25 (2024-25)
- Press release: results for the quarter and year ended 31 March 2026
- Press release: results for the quarter ended 30 September 2026
Terms on this page
- Capital expenditure (capex)
- Credit rating
- Dividend payout ratio
- EBITDA
- FII and DII holding
- Free cash flow
- Market capitalisation
- Net debt
- Net profit
- Operating margin
Each explains the term in plain English, with the same number from other companies on Cityfort.
Go deeper
More detail from the same filings. Open any section.
12What it sells
12What it sells
What does Tata Consumer sell?
India Beverages: ₹6,467 crore in FY26
Packaged tea and coffee such as Tata Tea, ready-to-drink drinks, and Organic India. Revenue rose 8% in FY26.
India Foods: ₹6,588 crore in FY26
Salt, Tata Sampann pulses and spices, Tata Soulfull and Capital Foods (Ching's Secret, Smith & Jones). Revenue rose 18% in FY26.
International: ₹4,885 crore in FY26
Tea and coffee sold abroad, including Tetley in the UK and Canada and Eight O'Clock coffee in the US. Revenue rose 16% in FY26, or 9% in constant currency (without exchange-rate changes).
Non-Branded: ₹2,387 crore in FY26
Instant coffee (solubles) and produce from plantations, sold without the company's consumer brands. Revenue rose 25% in FY26.
Tata Starbucks (joint venture)
Starbucks cafes in India, run by a 50:50 joint venture: 505 stores in 81 cities on 30 Sep 2026. Its revenue is not part of Tata Consumer's revenue.
What it does
- Does: Sells packaged tea, coffee, salt, pulses, spices, ready-to-cook foods and drinks
- Does: Sells herbal supplements and organic foods through Organic India
- Does: Sells its products in over 40 countries
What it does not do
- Does not: Does not own all of Capital Foods: it bought 75% in Feb 2024
- Does not: Does not count Tata Starbucks' sales as its own revenue: the cafes are a 50:50 joint venture
- Does not: Is not Tata Sons, the group holding company; Tata Sons owned 28.68% of it on 30 Sep 2026
Sources (7)
- Investor presentation, quarter ended March 2026 (Q4 FY26)
- Investor presentation, quarter ended September 2026 (Q2 FY27)
- Reg 30 disclosure: acquisition of Capital Foods Private Limited
- Business Responsibility and Sustainability Report FY26
- Q4 FY26 earnings call transcript (call 8 May 2026)
- Integrated Annual Report FY26 (2025-26)
- Press release: results for the quarter ended 30 September 2026
13How the money flows
13How the money flows · FY26
How does money flow through Tata Consumer?
Money in
- Revenue from operations₹20,290 cr
- Other income₹165 cr
The company
Tata Consumer
₹20,455 cr came in
Money out
- Materials and goods bought₹11,856 cr
- Advertising and other running costs₹3,982 cr
- Employee costs₹1,661 cr
- Depreciation and interest₹764 cr
- Income tax₹535 cr
- One-offs, losses of part-owned companies and minority share₹115 cr
- Profit for shareholders₹1,542 cr
- In FY26 Tata Consumer's sales brought in ₹20,290 crore of revenue, plus ₹165 crore of other income.
- Materials such as tea, coffee and salt, plus goods bought to resell, took ₹11,856 crore.
- Advertising and other running costs took ₹3,982 crore, and employees ₹1,661 crore.
- Depreciation and interest took ₹764 crore and income tax ₹535 crore. One-off costs, losses at joint ventures and associates, and the minority share took ₹115 crore.
- What was left was ₹1,542 crore of profit for shareholders.
14What it needs to run
14What it needs to run
What does Tata Consumer need to run?
Reach into shops
The company says it distributes to 4.5 million retail outlets in India.
Plants and offices
Its FY26 BRSR lists 126 plants and 16 offices in India, and 6 plants and 10 offices abroad.
People
Its FY26 annual report shows a workforce of 10,139 in India, 433 in the UK, 178 in the US and 483 elsewhere.
Advertising
Advertising and promotion took 6.7% of India business sales in FY26 and 5.5% in Q2 FY27, the company says.
Plantation associates
It owns 41.03% of Amalgamated Plantations and 28.52% of Kanan Devan Hills Plantations, counted as associates.
15Where it sells
15Where it sells · FY26
Where does Tata Consumer sell?
- India66.2%
- Outside India (incl. exports from India)33.8%
16Where growth could come from
16Where growth could come from
Where could Tata Consumer's growth come from?
Asked about FY27 margins on the Q4 FY26 call (8 May 2026), management said: "So 50 to 75, 80 bps is a given." It added that seasonality makes the gain uneven from quarter to quarter. A basis point (bps) is 0.01 percentage point. On 26 Oct 2026 management said it had seen margin pressure during the year and had raised prices.
Growth businesses
Working₹1,438 cr, +40%, Q2 FY27
Tata Sampann, ready-to-drink, Tata Soulfull, vending, Capital Foods and Organic India had ₹1,438 crore of revenue in Q2 FY27, up 40%, and were 38% of India business, up from 32% a year earlier.
Status: Working, on track against what the company said.
Tata Sampann
Working+57%, Q2 FY27
Tata Sampann revenue rose 57% in Q2 FY27 and 69% in Q4 FY26, each from a year earlier.
Status: Working, on track against what the company said.
Ready-to-drink
Working+47%, Q2 FY27
Ready-to-drink revenue rose 47% in Q2 FY27, with volume up 34%.
Status: Working, on track against what the company said.
Capital Foods and Organic India
Mixed+15% combined, Q2 FY27
Capital Foods revenue was ₹264 crore (+18%) and Organic India ₹145 crore (+9%) in Q2 FY27; the company said exports were hit by shipping disruption. Management said on 24 Jul 2026 that 25% to 30% growth "should be the new normal going forward".
Status: Mixed, partly on track.
India tea
BehindIndia tea/coffee revenue −1%, Q2 FY27
Management said on 8 May 2026 that for tea it targets mid-single-digit growth plus a couple of basis points from price and mix, for mid- to high-single-digit revenue growth. India tea and coffee revenue fell 4% in Q1 FY27 and 1% in Q2 FY27.
Status: Behind, behind the company's own plan.
Status compares progress with what the company itself said it would do: Working = on track against what the company said; Mixed = partly on track; Behind = behind the company's own plan; New = recently announced; Early = too early to judge.
Sources (7)
- Q4 FY26 earnings call transcript (call 8 May 2026)
- Q2 FY27 earnings call transcript (call 26 Oct 2026)
- Investor presentation, quarter ended September 2026 (Q2 FY27)
- Investor presentation, quarter ended March 2026 (Q4 FY26)
- Press release: results for the quarter ended 30 September 2026
- Q1 FY27 earnings call transcript (call 24 Jul 2026)
- Investor presentation, quarter ended June 2026 (Q1 FY27)
17Financial strength and debt
17Financial strength · 31 Mar 2026
How much debt does Tata Consumer have?
- Total debt₹2,120 cr
- Cash and investments₹4,289 cr
- Net cash (cash minus debt)₹2,168 cr
- Net worth (shareholders' money)₹21,788 cr
- Debt to equity
- 0.1×
- ₹ of debt for every ₹1 of shareholders' money
- Interest cover
- 20.2×
- how many times operating profit covers interest
- Cityfort calculation: cash ₹3,047 crore + other bank balances ₹374 crore + current investments ₹868 crore = ₹4,289 crore.
- Lease liabilities (rent owed under leases) were a further ₹699 crore and are not counted as borrowings here.
- Most short-term borrowings were bank overdrafts in a group cash-pooling arrangement, offset by cash balances: ₹1,595 crore on 31 Mar 2026.
- The company reports net cash of ₹2,978 crore on 31 Mar 2026, using its own definition.
- Borrowings were ₹2,954 crore on 31 Mar 2024 after the Capital Foods purchase, and ₹1,849 crore a year later, after the rights issue money repaid acquisition borrowing.
- On 30 Sep 2026 borrowings were ₹1,818 crore and cash, bank deposits and current investments ₹3,080 crore (Cityfort sum).
- Cityfort calculations: debt to equity = borrowings ÷ shareholders' equity of ₹21,788 crore; interest cover = FY26 EBITDA of ₹2,772 crore ÷ finance costs of ₹137 crore.
Sources (8)
- Consolidated audited financial results Q4 and FY26 (integrated filing XBRL)
- Integrated Annual Report FY26 (2025-26)
- Investor presentation, quarter ended March 2026 (Q4 FY26)
- Consolidated financial results Q2 FY27 (integrated filing XBRL)
- Consolidated audited financial results Q4 and FY24 (XBRL)
- Consolidated audited financial results Q4 and FY25 (integrated filing XBRL)
- Integrated Annual Report FY25 (2024-25)
- ICRA rationale: Tata Consumer Products Limited, ratings reaffirmed
18Who owns it
18Who owns it · Q2 FY27
Who owns Tata Consumer?
- Promoters (founders or parent company)33.8%
- Foreign institutions (FII)19.8%
- Indian institutions (DII)25.3%
- Public and others21.1%
Promoter pledge
No promoter shares were pledged in Q2 FY27.
How ownership changed
* Pledged = share of the promoters' own holding reported as pledged. In older filings this can include shares “otherwise encumbered”; the governance flags say when.
Sources (12)
- Shareholding pattern, quarter ended 30 Sep 2026 (XBRL)
- Shareholding pattern, quarter ended 30 Jun 2026 (XBRL)
- Shareholding pattern, quarter ended 31 Mar 2026 (XBRL)
- Shareholding pattern, quarter ended 31 Dec 2025 (XBRL)
- Shareholding pattern, quarter ended 30 Sep 2025 (XBRL)
- Shareholding pattern, quarter ended 30 Jun 2025 (XBRL)
- Shareholding pattern, quarter ended 31 Mar 2025 (XBRL)
- Shareholding pattern, quarter ended 31 Dec 2024 (XBRL)
- Shareholding pattern, quarter ended 30 Sep 2024 (XBRL)
- Shareholding pattern, quarter ended 30 Jun 2024 (XBRL)
- Shareholding pattern, quarter ended 31 Mar 2024 (XBRL)
- Shareholding pattern, quarter ended 31 Dec 2023 (XBRL)
19What it does with profit
19What it does with profit
What does Tata Consumer do with its profit?
Dividend per share
₹10.00FY26
Dividend paid for each share, by financial year.
₹ per share
See the numbers
Money raised · 23 Aug 2024
Rights issue: 36,568,731 shares allotted at ₹818 each, 1 for every 26 held. Net proceeds of ₹2,980.57 crore were used to repay borrowing taken for the Capital Foods and Organic India purchases.
₹2,981 cr
Sources (13)
- Integrated Annual Report FY22 (2021-22)
- Consolidated audited financial results Q4 and FY22 (XBRL)
- Integrated Annual Report FY23 (2022-23)
- Consolidated audited financial results Q4 and FY23 (XBRL)
- Integrated Annual Report FY24 (2023-24)
- Consolidated audited financial results Q4 and FY24 (XBRL)
- Integrated Annual Report FY25 (2024-25)
- Consolidated audited financial results Q4 and FY25 (integrated filing XBRL)
- Integrated Annual Report FY26 (2025-26)
- Press release: results for the quarter and year ended 31 March 2026
- Consolidated audited financial results Q4 and FY26 (integrated filing XBRL)
- Rights issue terms (Capital Raising Committee, 23 Jul 2024)
- ICRA rationale: Tata Consumer Products Limited, ratings reaffirmed
20Governance signals
20Governance signals
What do Tata Consumer's governance filings show?
- Auditor
- Deloitte Haskins & Sells LLP
- Auditor changes
- 6 Mar 2026: Deloitte Haskins & Sells LLP → Price Waterhouse Chartered Accountants LLP (The board appointed Price Waterhouse for five years, from the 64th AGM (2027) to the 69th, subject to shareholder approval. Deloitte's term runs until the 64th AGM.)
- Audit qualifications
- None reported
- Related-party dealings
- Related-party totals were not extracted for this page. Related companies include the 50:50 joint venture Tata Starbucks and the associates Amalgamated Plantations (41.03% owned) and Kanan Devan Hills Plantations (28.52%). Tata Sons, the promoter, owned 28.68% on 30 Sep 2026.
- Credit rating
- ICRA [ICRA]AAA (long-term bank facilities), [ICRA]A1+ (short-term facilities and commercial paper) (outlook Stable), 30 Apr 2026
A credit rating describes the company's ability to repay debt. It is not a rating of the share.
Flags to know about
other · 14 Mar 2026
Income-tax demand for FY2022-23
An assessment order dated 13 Mar 2026 raised an income-tax demand of ₹98.03 crore, including interest, for FY2022-23. Tata Consumer said the demand is not maintainable and that it will appeal.
other · 24 Mar 2026
FY2018-19 tax demand deleted
An income-tax intimation dated 29 Dec 2025 on the FY2018-19 modified return raised a demand of ₹269.29 crore. A rectification order disclosed on 24 Mar 2026 deleted the demand in full.
auditor · 6 Mar 2026
Auditor change from 2027
On 6 Mar 2026 the board chose Price Waterhouse Chartered Accountants LLP to follow Deloitte Haskins & Sells LLP from the 2027 AGM, subject to shareholder approval.
disclosure
Acquisitions break comparisons
FY24 includes two months of Capital Foods and no Organic India. FY25 is Capital Foods' first full year and includes Organic India from 16 Apr 2024, which added ₹381 crore of revenue.
disclosure
No profit by brand or acquisition
The company reports profit by segment, not by brand. Management said on 8 May 2026 that it does not allocate shared costs to calculate EBITDA by category, and its decks give no separate profit for Capital Foods or Organic India.
other
Remaining 25% of Capital Foods
Tata Consumer owns 75% of Capital Foods and committed to buy the other 25% within three years of the Feb 2024 deal. ICRA says that is likely after Mar 2027, at a performance-linked mark-up. The commitment is recorded as a financial liability, not as borrowing.
Sources (11)
- Integrated Annual Report FY26 (2025-26)
- Intimation of appointment of statutory auditor (Price Waterhouse Chartered Accountants LLP)
- Shareholding pattern, quarter ended 30 Sep 2026 (XBRL)
- ICRA rationale: Tata Consumer Products Limited, ratings reaffirmed
- Reg 30 disclosure: income-tax assessment order for FY2022-23
- Reg 30 disclosure: income-tax intimation for FY2018-19
- Reg 30 disclosure: rectification order deleting FY2018-19 tax demand
- Integrated Annual Report FY24 (2023-24)
- Integrated Annual Report FY25 (2024-25)
- Q4 FY26 earnings call transcript (call 8 May 2026)
- Investor presentation, quarter ended September 2026 (Q2 FY27)
21What the market paid
21What the market paid · price as of 11 Nov 2026
What did the market pay for Tata Consumer on 11 Nov 2026?
Price as of 11 Nov 2026 (shown for education; prices change daily).
Price as of 11 Nov 2026: ₹1,093.00, the NSE closing price. Cityfort calculation: market value = that price × 98.97 crore shares = ₹108,174 crore. P/E (how many rupees the market paid for each rupee of yearly profit) of 63.6 = market value ÷ ₹1,700 crore of profit for shareholders in the four quarters to Sep 2026. P/B of 4.89 = market value ÷ shareholders' equity of ₹22,102 crore on 30 Sep 2026. The FY26 dividend of ₹10 a share was 0.91% of that price.
- Share price
- ₹1,093.00
- Market value (market cap)
- ₹108,174 cr
- P/E
- 63.6×
- P/B
- 4.9×
Source: NSE capital market bhavcopy, 11 Nov 2026 (TATACONSUM, EQ); Shareholding pattern, quarter ended 30 Sep 2026 (XBRL); Consolidated financial results Q3 FY26 (integrated filing XBRL) and 4 more
Sources (7)
- NSE capital market bhavcopy, 11 Nov 2026 (TATACONSUM, EQ)
- Shareholding pattern, quarter ended 30 Sep 2026 (XBRL)
- Consolidated financial results Q3 FY26 (integrated filing XBRL)
- Consolidated audited financial results Q4 and FY26 (integrated filing XBRL)
- Consolidated financial results Q1 FY27 (integrated filing XBRL)
- Consolidated financial results Q2 FY27 (integrated filing XBRL)
- Integrated Annual Report FY26 (2025-26)
22How it got here
22How it got here
How did Tata Consumer get here?
1962
Milestone
Company incorporated
The company was incorporated in 1962, according to its FY26 BRSR. Its registered office is in Kolkata.
2020
Business-model change
Tata Chemicals' food business joins
In Feb 2020 the company bought Tata Chemicals' consumer products business, according to ICRA.
2024
Milestone
Tata Coffee merged in
Tata Coffee was reorganised and merged into the company, effective 1 Jan 2024. On 19 Jan 2024 it allotted 23,823,166 shares to Tata Coffee's other shareholders.
2024
Business-model change
Capital Foods bought
On 1 Feb 2024 it bought 75% of Capital Foods, maker of Ching's Secret and Smith & Jones, for ₹3,881.25 crore.
2024
Business-model change
Organic India bought
On 16 Apr 2024 it bought 99.99% of Organic India, which sells herbal supplements, teas and organic packaged foods, and the last 0.01% on 13 Dec 2024. The consideration for the whole acquisition, measured at fair value, was ₹1,952.09 crore.
2024
Milestone
Rights issue
In Aug 2024 it raised ₹2,980.57 crore, net, by selling new shares to existing shareholders, and used it to repay acquisition borrowing.
2024
Milestone
Three subsidiaries merged in
NourishCo Beverages, Tata SmartFoodz and Tata Consumer Soulfull merged into the company from 1 Sep 2024. No shares were issued.
2026
Milestone
Growth businesses reach 31%
In FY26 growth businesses were 31% of India business, over ₹4,000 crore, up from 8% in FY21.
Sources (11)
- Business Responsibility and Sustainability Report FY26
- Integrated Annual Report FY26 (2025-26)
- ICRA rationale: Tata Consumer Products Limited, ratings reaffirmed
- Integrated Annual Report FY24 (2023-24)
- Reg 30 disclosure: acquisition of Capital Foods Private Limited
- Integrated Annual Report FY25 (2024-25)
- Reg 30 disclosure: acquisition of Organic India Private Limited
- Press release: Tata Consumer Products to acquire Organic India
- Rights issue terms (Capital Raising Committee, 23 Jul 2024)
- Consolidated audited financial results Q4 and FY25 (integrated filing XBRL)
- Investor presentation, quarter ended March 2026 (Q4 FY26)
23Sources and changes
Where every number on this page comes from
Sources (48 documents)
- S1Integrated Annual Report FY26 (2025-26) · Tata Consumer Products Ltd (company IR site; also filed with NSE 17 May 2026) · Tier 1: company or exchange filing · 17 May 2026
- S2Integrated Annual Report FY25 (2024-25) · Tata Consumer Products Ltd (company IR site; also filed with NSE 22 May 2025) · Tier 1: company or exchange filing · 22 May 2025
- S3Integrated Annual Report FY24 (2023-24) · Tata Consumer Products Ltd (filed with NSE) · Tier 1: company or exchange filing · 21 May 2024
- S4Integrated Annual Report FY23 (2022-23) · Tata Consumer Products Ltd (company IR site; also filed with NSE 12 May 2023) · Tier 1: company or exchange filing · 12 May 2023
- S5Integrated Annual Report FY22 (2021-22) · Tata Consumer Products Ltd (company IR site; also filed with NSE 3 Jun 2022) · Tier 1: company or exchange filing · 3 Jun 2022
- S6Consolidated financial results Q3 FY25 (XBRL) · Tata Consumer Products Ltd (filed with NSE) · Tier 1: company or exchange filing · 30 Jan 2025
- S7Consolidated financial results Q1 FY26 (integrated filing XBRL) · Tata Consumer Products Ltd (filed with NSE) · Tier 1: company or exchange filing · 23 Jul 2025
- S8Consolidated financial results Q2 FY26 (integrated filing XBRL) · Tata Consumer Products Ltd (filed with NSE) · Tier 1: company or exchange filing · 3 Nov 2025
- S9Consolidated audited financial results Q4 and FY25 (integrated filing XBRL) · Tata Consumer Products Ltd (filed with NSE) · Tier 1: company or exchange filing · 24 Apr 2025
- S10Consolidated audited financial results Q4 and FY26 (integrated filing XBRL) · Tata Consumer Products Ltd (filed with NSE) · Tier 1: company or exchange filing · 8 May 2026
- S11Consolidated financial results Q3 FY26 (integrated filing XBRL) · Tata Consumer Products Ltd (filed with NSE) · Tier 1: company or exchange filing · 27 Jan 2026
- S12Consolidated financial results Q1 FY27 (integrated filing XBRL) · Tata Consumer Products Ltd (filed with NSE) · Tier 1: company or exchange filing · 24 Jul 2026
- S13Consolidated financial results Q2 FY27 (integrated filing XBRL) · Tata Consumer Products Ltd (filed with NSE) · Tier 1: company or exchange filing · 26 Oct 2026
- S14Consolidated audited financial results Q4 and FY22 (XBRL) · Tata Consumer Products Ltd (filed with NSE) · Tier 1: company or exchange filing · 5 May 2022
- S15Consolidated audited financial results Q4 and FY23 (XBRL) · Tata Consumer Products Ltd (filed with NSE) · Tier 1: company or exchange filing · 25 Apr 2023
- S16Consolidated audited financial results Q4 and FY24 (XBRL) · Tata Consumer Products Ltd (filed with NSE) · Tier 1: company or exchange filing · 24 Apr 2024
- S17Investor presentation, quarter ended September 2026 (Q2 FY27) · Tata Consumer Products Ltd · Tier 1: company or exchange filing · 26 Oct 2026
- S18Investor presentation, quarter ended June 2026 (Q1 FY27) · Tata Consumer Products Ltd · Tier 1: company or exchange filing · 24 Jul 2026
- S19Investor presentation, quarter ended March 2026 (Q4 FY26) · Tata Consumer Products Ltd · Tier 1: company or exchange filing · 8 May 2026
- S20Press release: results for the quarter ended 30 September 2026 · Tata Consumer Products Ltd · Tier 1: company or exchange filing · 26 Oct 2026
- S21Press release: results for the quarter and year ended 31 March 2026 · Tata Consumer Products Ltd · Tier 1: company or exchange filing · 8 May 2026
- S22Q2 FY27 earnings call transcript (call 26 Oct 2026) · Tata Consumer Products Ltd · Tier 1: company or exchange filing · 26 Oct 2026
- S23Q1 FY27 earnings call transcript (call 24 Jul 2026) · Tata Consumer Products Ltd · Tier 1: company or exchange filing · 24 Jul 2026
- S24Q4 FY26 earnings call transcript (call 8 May 2026) · Tata Consumer Products Ltd · Tier 1: company or exchange filing · 8 May 2026
- S26Shareholding pattern, quarter ended 30 Sep 2026 (XBRL) · Tata Consumer Products Ltd (filed with NSE) · Tier 1: company or exchange filing · 19 Oct 2026
- S27Shareholding pattern, quarter ended 30 Jun 2026 (XBRL) · Tata Consumer Products Ltd (filed with NSE) · Tier 1: company or exchange filing · 17 Jul 2026
- S28Shareholding pattern, quarter ended 31 Mar 2026 (XBRL) · Tata Consumer Products Ltd (filed with NSE) · Tier 1: company or exchange filing · 20 Apr 2026
- S29Shareholding pattern, quarter ended 31 Dec 2025 (XBRL) · Tata Consumer Products Ltd (filed with NSE) · Tier 1: company or exchange filing · 21 Jan 2026
- S30Shareholding pattern, quarter ended 30 Sep 2025 (XBRL) · Tata Consumer Products Ltd (filed with NSE) · Tier 1: company or exchange filing · 20 Oct 2025
- S31Shareholding pattern, quarter ended 30 Jun 2025 (XBRL) · Tata Consumer Products Ltd (filed with NSE) · Tier 1: company or exchange filing · 21 Jul 2025
- S32Shareholding pattern, quarter ended 31 Mar 2025 (XBRL) · Tata Consumer Products Ltd (filed with NSE) · Tier 1: company or exchange filing · 16 Apr 2025
- S33Shareholding pattern, quarter ended 31 Dec 2024 (XBRL) · Tata Consumer Products Ltd (filed with NSE) · Tier 1: company or exchange filing · 20 Jan 2025
- S34Shareholding pattern, quarter ended 30 Sep 2024 (XBRL) · Tata Consumer Products Ltd (filed with NSE) · Tier 1: company or exchange filing · 11 Oct 2024
- S35Shareholding pattern, quarter ended 30 Jun 2024 (XBRL) · Tata Consumer Products Ltd (filed with NSE) · Tier 1: company or exchange filing · 19 Jul 2024
- S36Shareholding pattern, quarter ended 31 Mar 2024 (XBRL) · Tata Consumer Products Ltd (filed with NSE) · Tier 1: company or exchange filing · 11 Apr 2024
- S37Shareholding pattern, quarter ended 31 Dec 2023 (XBRL) · Tata Consumer Products Ltd (filed with NSE) · Tier 1: company or exchange filing · 19 Jan 2024
- S38ICRA rationale: Tata Consumer Products Limited, ratings reaffirmed · ICRA Limited · Tier 2: rating agency or regulator · 30 Apr 2026
- S40Business Responsibility and Sustainability Report FY26 · Tata Consumer Products Ltd · Tier 1: company or exchange filing · 17 May 2026
- S41Reg 30 disclosure: acquisition of Capital Foods Private Limited · Tata Consumer Products Ltd (filed with NSE) · Tier 1: company or exchange filing · 12 Jan 2024
- S42Reg 30 disclosure: acquisition of Organic India Private Limited · Tata Consumer Products Ltd (filed with NSE) · Tier 1: company or exchange filing · 12 Jan 2024
- S43Investor presentation: acquisition of Capital Foods and Organic India · Tata Consumer Products Ltd · Tier 1: company or exchange filing · 12 Jan 2024
- S44Press release: Tata Consumer Products to acquire Organic India · Tata Consumer Products Ltd · Tier 1: company or exchange filing · 12 Jan 2024
- S46Rights issue terms (Capital Raising Committee, 23 Jul 2024) · Tata Consumer Products Ltd (filed with NSE) · Tier 1: company or exchange filing · 23 Jul 2024
- S47Intimation of appointment of statutory auditor (Price Waterhouse Chartered Accountants LLP) · Tata Consumer Products Ltd (filed with NSE) · Tier 1: company or exchange filing · 6 Mar 2026
- S48Reg 30 disclosure: income-tax assessment order for FY2022-23 · Tata Consumer Products Ltd (filed with NSE) · Tier 1: company or exchange filing · 14 Mar 2026
- S49Reg 30 disclosure: rectification order deleting FY2018-19 tax demand · Tata Consumer Products Ltd (filed with NSE) · Tier 1: company or exchange filing · 24 Mar 2026
- S50Reg 30 disclosure: income-tax intimation for FY2018-19 · Tata Consumer Products Ltd (filed with NSE) · Tier 1: company or exchange filing · 6 Jan 2026
- S52NSE capital market bhavcopy, 11 Nov 2026 (TATACONSUM, EQ) · National Stock Exchange of India · Tier 1: company or exchange filing · 11 Nov 2026
Changes to this page (v1 · 11 Nov 2026)
- v1 · 11 Nov 2026First version. (first version)
Numbers come only from tier 1 and tier 2 sources. Read how we research.
Disclaimer
For learning only. Cityfort is not a SEBI-registered adviser and does not recommend buying or selling any security. Prices shown are dated and may be out of date.
Investing in securities involves risk, including loss of capital. Before making any investment decision, do your own research and consider consulting a SEBI-registered investment adviser.
Cityfort, its owners and contributors may or may not hold securities of companies covered. Content is not an offer or solicitation to buy or sell any security.
Read the full disclaimerHide the full disclaimer
Cityfort publishes educational content that explains how listed companies work. Cityfort is not registered with the Securities and Exchange Board of India (SEBI) as an Investment Adviser or Research Analyst and does not provide investment advice, recommendations, ratings, price targets or any opinion on whether to buy, sell or hold any security.
All information is taken from publicly available sources, mainly company filings on BSE and NSE, which are listed on each page with dates. We work to keep it accurate and correct errors publicly, but we do not guarantee that it is complete, accurate or up to date. Any market price or price-based ratio shown is dated, may be out of date by the time you read it, and is included only to explain concepts.
Statements by company management are reported as statements, with their date and source; they are not our forecasts.