Fast Moving Consumer Goods · NSE: DABUR · BSE: 500096
Dabur: how the business works
Dabur sells Ayurveda-based health products, hair oils, toothpaste, juices and spices to households in India and abroad, earning ₹13,193 crore of revenue in FY26.
Follow Dabur
Email me when Dabur's page is updated after results.
We store your email address with Kit, our email provider, which also records when you sign up and whether you open or click our emails. We send a confirmation email first. See our privacy policy.
Dabur India Limited · New Delhi, Delhi · Founded 1884
Updated for Q2 FY27 · checked
- Revenue, FY26
- ₹13,193 cr
- Net profit, FY26
- ₹1,895 cr
- Shops it supplies directly, FY26
- 1.52 million
- Founded
- 1884
- Promoter holding, Sep 2026
- 66.25%
The short version
Dabur in 5 points
1 · What it sells
Dabur sells Ayurveda-based health products such as Dabur Chyawanprash and Hajmola, hair oils, toothpaste, Real juices and Badshah spices, and its FY26 revenue was ₹13,193 crore.
2 · Who pays it
Households pay through shops and online stores; the company says 27% of FY26 revenue came from outside India, which leaves 73% from India.
3 · What it keeps from ₹100
Of every ₹100 that came in during FY26, Dabur kept ₹13.7 as net profit, and ₹4.3 of that ₹100 was other income; its EBITDA margin on sales was 18.5%.
4 · Where the operating profit comes from
Consumer care (health, hair, oral, skin and home care) earned ₹2,476 crore, or 90.6%, of Dabur's ₹2,731 crore FY26 segment result, on 82.3% of revenue.
5 · The one thing to watch
Dabur's Q2 FY27 revenue rose 11.6%, but its EBITDA margin was 17.7% against 18.4% a year earlier, and its Global CEO resigned with effect from 13 Nov 2026.
Sources: From Dabur's FY26 annual report, its Q2 FY27 results and its NSE filings · checked
01Where the money goes · FY26
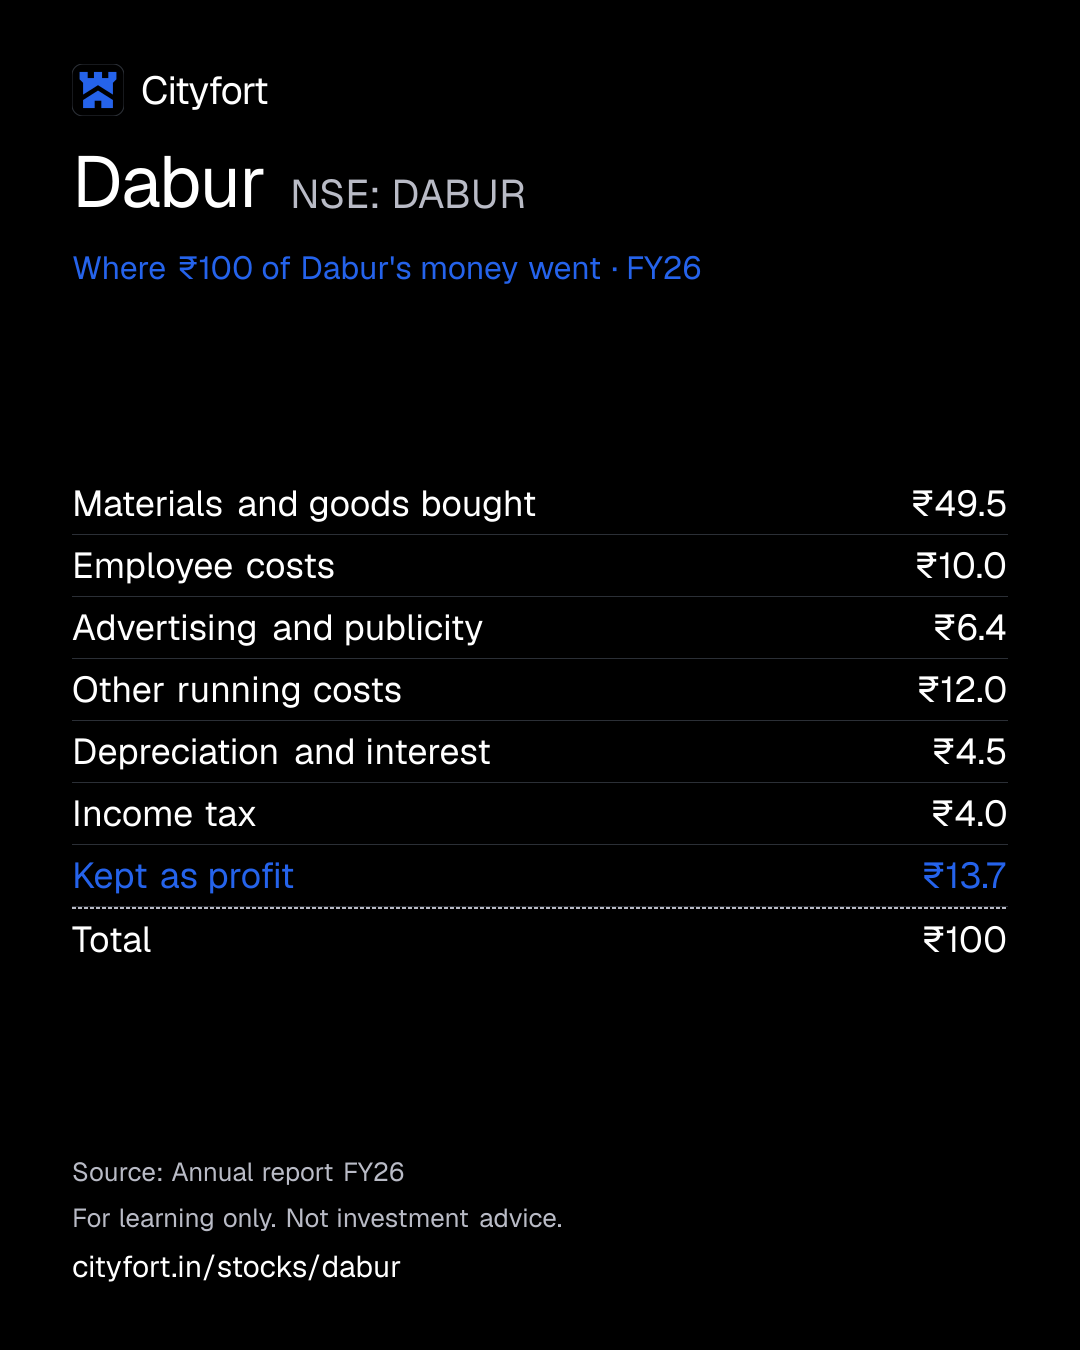
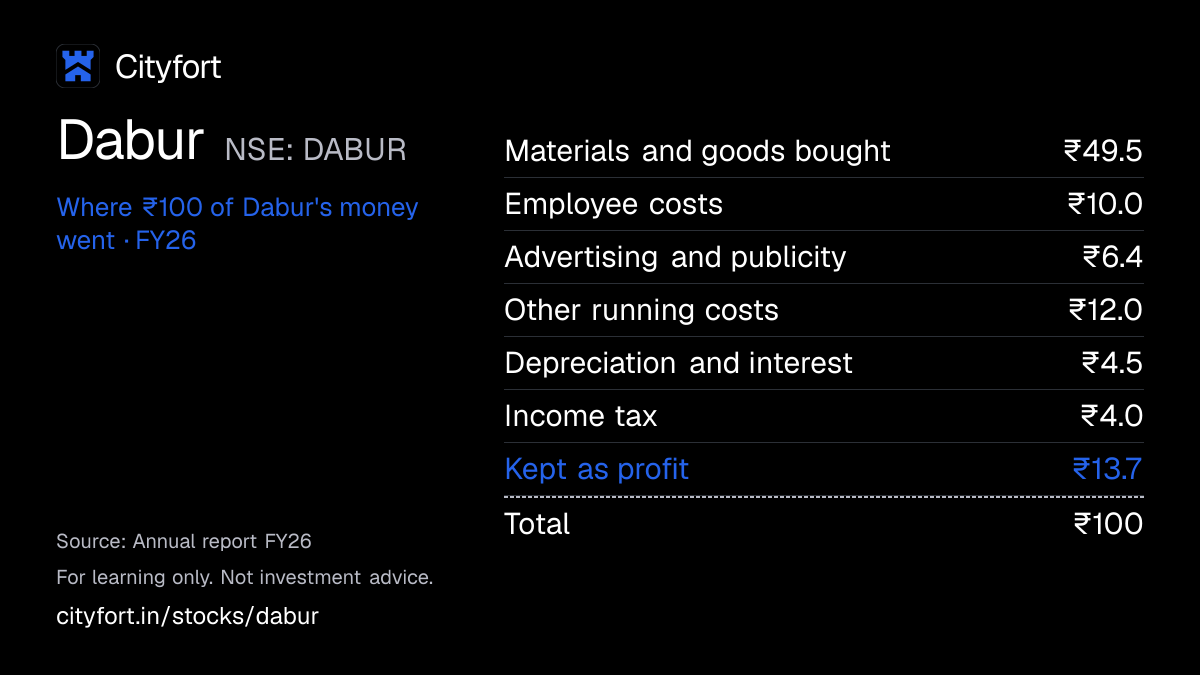
Where does ₹100 of Dabur's money go?
Dabur · FY26
Receipt for every ₹100
| Materials and goods bought | ₹49.5 |
|---|---|
| Employee costs | ₹10.0 |
| Advertising and publicity | ₹6.4 |
| Other running costs | ₹12.0 |
| Depreciation and interest | ₹4.5 |
| Income tax | ₹4.0 |
| Kept as profit | ₹13.7 |
| Total | ₹100 |
Each line = amount ÷ total money in × 100. Lines may not add to exactly ₹100 because of rounding.
How this is worked out
Cityfort calculation from the FY26 annual report: each line ÷ total money in (revenue ₹13,193 crore + other income ₹600 crore = ₹13,792 crore). Other income was ₹4.3 of every ₹100. Lines add to ₹100.1: minority partners' ₹26 crore share of subsidiary losses is more than a ₹15 crore one-off labour-code charge and a ₹2 crore joint-venture loss.
Save this receipt as an image
Embed this receipt or the key numbers
Paste this code into a blog or website to show the card you choose, with a link back to this page.
Each week: the next company due to report results, explained in 5 points.
We'll email you once a week with what changed on Cityfort. Facts only, no tips. Unsubscribe any time.
We store your email address with Kit, our email provider, which also records when you sign up and whether you open or click our emails. We send a confirmation email first. See our privacy policy.
02The business in one line
What does Dabur do?
Households pay Dabur for Chyawanprash, Hajmola, hair oils, toothpaste and Real juices; about half of the money goes on materials, and ₹13.7 of every ₹100 that came in during FY26 was left as profit.
- Shoppers buy through distributors, small shops, supermarkets and online stores. Dabur supplied 1.52 million shops directly in FY26.
- Dabur says 27% of FY26 revenue came from outside India, from brands such as Hobi in Turkey and Namaste in the US.
03Who pays it
Who pays Dabur?
Households in India
73%
of revenue
They buy through distributors, small shops, supermarkets and online stores; Dabur supplied 1.52 million shops directly and reached 8.5 million in all in FY26. Their 73% share is 100% minus the international share (Cityfort calculation).
Households abroad
27%
of revenue
Middle East 27% of the international business, Africa 23%, Asia 19%, Europe 16% and the Americas 15%, the company says.
- Households in India73%
- Households abroad27%
How spread out the customers are
Dabur does not disclose revenue by customer; its FY26 accounts say no single customer gave 10% or more of revenue.
04How it makes money
How does Dabur make money?
Dabur earns most of its profit from low-priced health and personal care products that households buy again and again; consumer care gave 90.6% of its FY26 segment result.
Consumer care earned ₹22.8 of segment result (profit before interest, tax and shared costs) per ₹100 of its revenue in FY26, against ₹11.9 in the food business (Cityfort calculation). Its small packs reach 8.5 million shops. Material prices and advertising move the margin.
Consumer care segment result per ₹100 of its revenue (Cityfort calculation)
₹24.1₹22.8
FY22 to FY26
- Households buy small packs of Chyawanprash, hair oil and toothpaste again and again.
- Dabur supplies 1.52 million shops directly and reaches 8.5 million through distributors.
- Materials take ₹49.5 of every ₹100 that comes in, so herb, oil and packaging prices matter.
- Advertising takes ₹6.4 more, to keep brands such as Hajmola and Dabur Amla known.
- Consumer care earns ₹22.8 per ₹100 of its revenue; food earns ₹11.9.
- Profit pays dividends (₹1,419 crore in FY26) and buys brands such as Badshah and Sesa Care.
↺ Step 6 feeds back into step 1.
05Business segments · FY26
Which businesses make up Dabur?
Consumer care
82.3%Health care, hair, oral, skin and home care in India and abroad: 82.3% of FY26 revenue. It earned ₹2,476 crore, 90.6% of the ₹2,731 crore FY26 segment result.
Revenue ₹10,864 cr · Operating profit ₹2,476 cr
Food
15.3%Real juices, other drinks, cooking pastes and Badshah spices. Revenue was ₹2,179 crore in FY24.
Revenue ₹2,016 cr · Operating profit ₹240 cr
Retail
0.8%NewU beauty stores; a ₹6 crore loss in FY26.
Revenue ₹107 cr · Operating profit −₹6 cr
Other
1.3%Guar gum, pharmaceuticals and other small lines.
Revenue ₹167 cr · Operating profit ₹22 cr
Unallocated
0.3%Other operating revenue not assigned to a segment.
Revenue ₹39 cr
How the mix changed
- Consumer care
- Food
- Retail
- Other
- Unallocated
Revenue by segment, FY22 to FY26.
₹ crore
See the numbers
06The numbers · Consolidated · ₹ crore
How has Dabur done?
Revenue
₹13,193 crFY26
Revenue rose every year from ₹10,889 crore in FY22 to ₹13,193 crore in FY26, though growth slowed to 1.3% in FY25 and 5.0% in FY26; Q2 FY27 revenue was up 11.6% on Q2 FY26.
₹ crore
See the numbers
Net profit
₹1,895 crFY26
Net profit was ₹1,739 crore in FY22 and ₹1,895 crore in FY26, with dips in FY23 (₹1,707 crore) and FY25 (₹1,768 crore); the January–March quarter earned the least in FY25 and FY26.
₹ crore
See the numbers
Net profit for every ₹100 of revenue
₹14.4FY26
The EBITDA margin (profit before interest, tax and wear-and-tear, per ₹100 of sales; Cityfort calculation, after one-off items) was 19.9% in FY22 and 18.5% in FY26; in Q2 FY27 it was 17.7%, against 18.4% in Q2 FY26, which the company put down to inflation.
Net margin: ₹ of net profit per ₹100 of revenue
See the numbers
Free cash flow
₹2,158 crFY26
Free cash flow (cash left after running and investing in the business) was positive every year from FY22 to FY26 and reached ₹2,158 crore in FY26, when Dabur paid ₹1,419 crore of dividends.
₹ crore · cash from operations minus spending on plants and equipment
See the numbers
See all yearly numbers
EBITDA = profit before interest, tax and wear-and-tear of assets. Financial year runs April to March (March year end). Net profit is the share belonging to the company's owners.
Sources (9)
- NSE results and shareholding XBRL facts (12 quarters, 5 years)
- Annual Report FY22 (2021-22)
- Integrated Annual Report FY23 (2022-23)
- Integrated Annual Report FY24 (2023-24)
- Integrated Annual Report FY25 (2024-25)
- Integrated Annual Report FY26 (2025-26)
- Q4 FY26 financial results
- Q1 FY27 financial results
- Q2 FY27 financial results
07Who runs it
Who runs Dabur, and did they deliver?
Mohit Burman
Chairman (non-executive, promoter family)
One of four non-executive promoter directors on the 12-member board.
Herjit Singh Bhalla
CEO, India business; whole-time director · since 2026
Joined the board on 14 Nov 2026 for five years, subject to regulatory approvals. The company said there will be no new global CEO.
P. D. Narang
Whole-time director
With Dabur since 1983; oversees the international business from Nov 2026.
Ankush Jain
Chief Financial Officer
Also compliance officer from 1 Dec 2026.
Mohit Malhotra
Global CEO (until 13 Nov 2026)
Resigned with effect from 13 Nov 2026. The board filing cites personal interests; his letter says he accepted a leadership role overseas.
What they said, and what happened
2 delivered · 3 too early to tell
Said on 30 Oct 2025
Then Global CEO Mohit Malhotra said revenue growth for the second half of FY26 would be "mid to high single digit".
DeliveredWhat happened
H2 FY26 revenue was ₹6,597 crore, 6.6% above H2 FY25 (Cityfort calculation from the quarterly results).
Said on 29 Jan 2026
Malhotra said Q4 FY26 revenue growth should be in "high single digits", with a higher EBITDA margin than a year earlier.
DeliveredWhat happened
Q4 FY26 revenue rose 7.3%, and the EBITDA margin (Cityfort calculation) was 15.2%, against 15.1% in Q4 FY25.
Said on 7 May 2026
Malhotra raised FY27 revenue guidance from high single digit to "high single to a low double-digit growth".
Too early to tellWhat happened
H1 FY27 revenue was up 11.1%; the full year ends 31 Mar 2027.
Said on 5 Nov 2026
Bhalla said the company aims to take premium brands to 23% of the India business "over the next 18 months".
Too early to tellWhat happened
Premium brands were 20% of the India business in Q2 FY27, the company said.
Said on 5 Nov 2026
Bhalla said cost savings of ₹115 crore must be raised 1.5 times, which he put at ₹170–200 crore.
Too early to tellWhat happened
No period was given for the target.
Sources (8)
- Integrated Annual Report FY26 (2025-26)
- Resignation of Global CEO, board and KMP changes
- Q2 FY27 analyst/investor meet transcript (5 Nov 2026)
- Q2 FY26 earnings call transcript
- NSE results and shareholding XBRL facts (12 quarters, 5 years)
- Q3 FY26 earnings call transcript
- Q4 FY26 earnings call transcript
- Q2 FY27 press release
08What could go wrong
What could go wrong for Dabur?
- Raw-material prices
Rising material costs
Materials took ₹49.5 of every ₹100 that came in during FY26. In May 2026 Malhotra put input inflation at about 10%, and the EBITDA margin fell to 17.7% in Q2 FY27 from 18.4% a year earlier.
Watch The EBITDA margin each quarter and price increases the company announces.
- Currency
Middle East and currency swings abroad
The international business was 27% of FY26 revenue, and the Middle East was its largest region at 27%. The company described "severe headwinds in the Middle East" in Q2 FY27.
Watch International growth in rupees and in constant currency each quarter.
- Regulation
Regulators in India and the US
In 2026 the US FDA put drugs from the Silvassa plant on an import alert. India's food regulator FSSAI barred "100%" claims on some food products (stayed by the Delhi High Court), and SEBI sent a warning letter alleging a late disclosure.
Watch The Delhi High Court hearing on 16 Dec 2026 and any US FDA update on Silvassa.
- Execution
New leadership and strategy
The Global CEO resigned with effect from 13 Nov 2026, and the company said there will be no new global CEO. Bhalla said a full strategy review will come back "in the next 6 to 8 months".
Watch The revised strategy and whether FY27 revenue growth stays in double digits.
- Execution
Food business margins
Food earned ₹11.9 per ₹100 of revenue in FY26, down from ₹12.7 in FY25, and its revenue fell 4.0% in FY26 (Cityfort calculation).
Watch Food segment revenue and result in the quarterly filings.
- Legal
Tax claims
Claims not provided for in the accounts were ₹820 crore on 31 Mar 2026, including ₹684 crore of sales tax claims, up from ₹62 crore a year earlier.
Watch Contingent liabilities in the FY27 annual report.
Sources (10)
- Integrated Annual Report FY26 (2025-26)
- Q4 FY26 earnings call transcript
- NSE results and shareholding XBRL facts (12 quarters, 5 years)
- Update on performance and demand trends
- US FDA import alert (Reg 30)
- Delhi High Court stay order
- Update on letters dated 4 and 7 Aug 2026 (Reg 30)
- SEBI administrative warning letter (Reg 30)
- Resignation of Global CEO, board and KMP changes
- Q2 FY27 analyst/investor meet transcript (5 Nov 2026)
09Supporters and critics
What do supporters and critics point to?
What supporters point to
- Cash and investments exceeded borrowings by ₹8,426 crore on 31 Mar 2026, and CRISIL reaffirmed its AAA rating on 17 Nov 2026.
- Free cash flow was ₹2,158 crore in FY26, up from ₹1,417 crore in FY25.
- H1 FY27 revenue rose 11.1% and profit after tax 13.4%, the company reported.
- Dabur supplied 1.52 million shops directly in FY26, and no promoter shares were pledged in any of the 12 quarters to Sep 2026.
What critics point to
- Revenue grew 1.3% in FY25 and 5.0% in FY26, and net profit was ₹1,895 crore in FY26 against ₹1,739 crore in FY22.
- The Q2 FY27 EBITDA margin was 17.7%, down from 18.4% a year earlier.
- The Global CEO resigned with effect from 13 Nov 2026. In 2026 Dabur also received a US FDA import alert (Jun), an FSSAI order (Aug, stayed by the Delhi High Court) and a SEBI administrative warning letter (Nov).
- Foreign investors' holding fell from 16.49% in Dec 2023 to 9.61% in Sep 2026.
10What to watch next
What should you watch next at Dabur?
Next event
Q3 FY27 results (date not announced; Q3 FY26 results came on 29 Jan 2026)
Date not announced yet.
FY27 revenue guidance
Bhalla repeated the double-digit revenue growth guidance for FY27 on 5 Nov 2026. H1 FY27 revenue was up 11.1%.
Delhi High Court, 16 Dec 2026
The court's stay on FSSAI's order about "100%" claims on some food products continues until the next hearing on 16 Dec 2026.
The new strategy
Bhalla said on 5 Nov 2026 the company will return with a revised strategy "in the next 6 to 8 months", and plans 150–200 basis points (1.5–2 percentage points) more advertising spend.
11Key facts
Key facts about Dabur
- What does Dabur India do?
- Dabur India sells Ayurveda-based health products such as Dabur Chyawanprash and Hajmola, hair oils, toothpaste, Real juices, Badshah spices and home care products. Its FY26 consolidated revenue was ₹13,193 crore.
- How does Dabur India make money?
- Dabur India earns most of its profit from its consumer care business (health, hair, oral, skin and home care), which gave ₹2,476 crore, or 90.6%, of its ₹2,731 crore FY26 segment result.
- Who are Dabur India's customers?
- Dabur India sells to households through distributors, shops, supermarkets and online stores. No single customer gave 10% or more of its FY26 revenue, and it supplied 1.52 million shops directly that year.
- How big is Dabur India?
- Dabur India's FY26 consolidated revenue was ₹13,193 crore and its net profit ₹1,895 crore. It had 7,745 employees worldwide, 4,768 of them in India.
- Who owns Dabur India?
- Dabur India's promoter group held 66.25% of the shares on 30 Sep 2026, with none pledged. Domestic institutions held 18.35% and foreign investors 9.61%.
- How much of Dabur India's revenue comes from outside India?
- Dabur India says its international business was 27% of FY26 consolidated revenue. It sells in more than 120 countries and has 8 manufacturing locations outside India.
- How much dividend did Dabur India pay for FY26?
- Dabur India's dividend for FY26 was ₹8.25 per share: ₹2.75 interim plus a ₹5.50 final dividend recommended by the board. It paid ₹1,419 crore of dividends in cash during FY26.
- Does Dabur India have much debt?
- On 31 Mar 2026 Dabur India had ₹1,063 crore of borrowings and ₹9,489 crore of cash and investments, so its cash and investments exceeded its borrowings by ₹8,426 crore.
Terms on this page
- Capital expenditure (capex)
- Credit rating
- Dividend payout ratio
- EBITDA
- FII and DII holding
- Free cash flow
- Net debt
- Net profit
- Operating margin
- Promoter holding
Each explains the term in plain English, with the same number from other companies on Cityfort.
Go deeper
More detail from the same filings. Open any section.
12What it sells
12What it sells
What does Dabur sell?
Hair care (20% of India FMCG sales)
Dabur Amla and Vatika hair oils and shampoos.
Oral care (19%)
Dabur Red toothpaste, Meswak and Lal Dant Manjan tooth powder.
Health supplements (14%)
Dabur Chyawanprash, a herbal jam eaten for immunity, and Dabur Honey.
Digestives and medicines (6% and 8%)
Hajmola and Pudin Hara for digestion, Sat Isabgol, and Honitus cough remedies sold over the counter.
Juices, foods and spices (15% and 6%)
Real fruit juices, Hommade cooking pastes and Badshah spice blends.
Home and skin care (8% and 4%)
Odonil air fresheners, Sanifresh toilet cleaner, Gulabari rose water and OxyLife skin care.
What it does
- Does: Sells in more than 120 countries; the international business was 27% of FY26 revenue, the company says.
- Does: Makes its products in 12 factories in India and at 8 locations abroad.
- Does: Runs a small chain of NewU beauty stores (₹107 crore of revenue in FY26).
What it does not do
- Does not: It is not only an Ayurveda medicine maker: juices, foods and spices were 15.3% of FY26 revenue.
- Does not: It does not depend on one big buyer: no customer gave 10% or more of FY26 revenue.
13How the money flows
13How the money flows · FY26
How does money flow through Dabur?
Money in
- Revenue from operations₹13,193 cr
- Other income₹600 cr
The company
Dabur
₹13,793 cr came in
Money out
- Materials and goods bought₹6,824 cr
- Employee costs₹1,376 cr
- Advertising and publicity₹888 cr
- Other running costs₹1,653 cr
- Depreciation and interest₹614 cr
- Income tax₹552 cr
- Net profit₹1,895 cr
- In FY26 Dabur's products brought in ₹13,193 crore of revenue, plus ₹600 crore of other income.
- Herbs, oils, packaging and goods bought for resale took ₹6,824 crore. Employees took ₹1,376 crore.
- Advertising took ₹888 crore, and other running costs such as freight and selling took ₹1,653 crore.
- Depreciation (₹469 crore) and interest (₹145 crore) took ₹614 crore. Income tax took ₹552 crore.
- ₹1,895 crore was left as net profit for Dabur's shareholders.
Sources (1)
14What it needs to run
14What it needs to run
What does Dabur need to run?
Factories
12 manufacturing units in India and 8 abroad; a new plant at Tindivanam, Tamil Nadu, was under construction in FY26.
Warehouses and agents
3 mother warehouses and 26 carrying-and-forwarding agents move stock to distributors.
Herbs and materials
Materials and goods bought took ₹49.5 of every ₹100 that came in during FY26; Dabur also runs 8 Bio Research Division (BRD) farms.
People
7,745 employees worldwide in FY26, 4,768 of them in India.
Product development
₹44.24 crore spent on research and development in FY26, with 15+ new products launched.
Sources (1)
15Where it sells
15Where it sells · FY26
Where does Dabur sell?
- India73%
- Outside India27%
Sources (1)
16Where growth could come from
16Where growth could come from
Where could Dabur's growth come from?
Herjit Singh Bhalla, CEO of the India business, said at the 5 Nov 2026 investor meet that the company is "reiterating our guidance for the full year to remain at double-digit" revenue growth for FY27. H1 FY27 revenue was up 11.1%.
Premium brands
Working20% of the India business in Q2 FY27
The company said premium brands grew 4 times as fast as regular ones in Q2 FY27. Bhalla said on 5 Nov 2026 the aim is 23% "over the next 18 months".
Status: Working, on track against what the company said.
International business
WorkingRevenue up 20.0% in rupees in Q2 FY27
Egypt, Turkey, Bangladesh and Sub-Saharan Africa led, the company said, despite disruption in the Middle East, its largest overseas region.
Status: Working, on track against what the company said.
Food and beverages
MixedUp 17.4% in Q2 FY27, after a fall in FY26
Food segment revenue fell to ₹2,016 crore in FY26 from ₹2,101 crore in FY25, then grew in Q1 and Q2 FY27.
Status: Mixed, partly on track.
Health care
MixedUp 6.9% in Q2 FY27
Digestives grew, but the company said health supplements were held back by a change to new packs and labels.
Status: Mixed, partly on track.
Sesa Care hair care merger
NewSanctioned by the NCLT on 24 Sep 2026
Sesa Care is an Ayurvedic hair care brand. The NCLT is the tribunal that approves company mergers; the merger counts from 1 Apr 2026 and takes effect once statutory filings are done.
Status: New, recently announced.
Rural reach
EarlyTarget: over 100,000 villages served directly
Bhalla set the target on 5 Nov 2026. The FY26 annual report gives total village coverage of 1.33 lakh villages and does not say how many of these are served directly.
Status: Early, too early to judge.
Status compares progress with what the company itself said it would do: Working = on track against what the company said; Mixed = partly on track; Behind = behind the company's own plan; New = recently announced; Early = too early to judge.
17Financial strength and debt
17Financial strength · 31 Mar 2026
How much debt does Dabur have?
- Total debt₹1,063 cr
- Cash and investments₹9,489 cr
- Net cash (cash minus debt)₹8,426 cr
- Net worth (shareholders' money)₹11,803 cr
- Debt to equity
- 0.09×
- ₹ of debt for every ₹1 of shareholders' money
- Interest cover
- 21×
- how many times operating profit covers interest
- Contingent liabilities
- ₹820 cr
- possible future payments, e.g. disputed claims
- Borrowings were ₹868 crore on 31 Mar 2022, ₹1,158 crore on 31 Mar 2024, ₹730 crore on 31 Mar 2025 and ₹1,063 crore on 31 Mar 2026. On 30 Sep 2026 they were ₹1,242 crore.
- Cash and investments include long-term investments of ₹4,331 crore; the company counts them in its own figure of ₹9,489 crore.
- Lease liabilities (₹225 crore on 31 Mar 2026) are not counted as borrowings here.
- Contingent liabilities (claims not provided for) were ₹820 crore on 31 Mar 2026, up from ₹659 crore; sales tax claims rose to ₹684 crore from ₹62 crore.
- Debt to equity = borrowings ÷ total equity of ₹11,803 crore (Cityfort calculation from the FY26 annual report). The annual report's own ratio table gives 0.14 for FY26 (0.09 for FY25), on the company's own basis. Interest cover of 21.0 times is the company's figure.
18Who owns it
18Who owns it · Q2 FY27
Who owns Dabur?
- Promoters (founders or parent company)66.3%
- Foreign institutions (FII)9.6%
- Indian institutions (DII)18.4%
- Public and others5.8%
Promoter pledge
No promoter shares were pledged in Q2 FY27.
How ownership changed
* Pledged = share of the promoters' own holding reported as pledged. In older filings this can include shares “otherwise encumbered”; the governance flags say when.
19What it does with profit
19What it does with profit
What does Dabur do with its profit?
Dividend per share
₹8.25FY26
Dividend paid for each share, by financial year.
₹ per share
See the numbers
No buybacks or fund raises in the period covered.
20Governance signals
20Governance signals
What do Dabur's governance filings show?
- Auditor
- G. Basu & Co., since 2022
- Auditor changes
- 12 Aug 2022: Walker Chandiok & Co LLP → G. Basu & Co. (Shareholders appointed G. Basu & Co. at the 12 Aug 2022 AGM for five years, to the AGM in 2027. Walker Chandiok signed the FY22 accounts.)
- Audit qualifications
- None reported
- Related-party dealings
- The promoter group, the Burman family, held 66.25% on 30 Sep 2026 with no shares pledged. Four of the 12 directors are non-executive promoter directors, including chairman Mohit Burman; six are independent.
- Credit rating
- CRISIL CRISIL AAA (long term), CRISIL A1+ (short term) (outlook Stable), 17 Nov 2026
A credit rating describes the company's ability to repay debt. It is not a rating of the share.
Flags to know about
regulatory · 6 Nov 2026
SEBI administrative warning, Nov 2026
On 6 Nov 2026 SEBI sent an administrative warning letter alleging a delay in disclosing a US FDA warning letter received on 24 Jul 2026. The company said there is no financial or operational impact and that it will address the concern.
regulatory · 10 Jun 2026
US FDA import alert on one plant
On 10 Jun 2026 the US FDA put drugs made at the Silvassa plant on Import Alert 66-40 after an inspection found data-integrity and maintenance lapses. The company says this covers a small part of the plant making private-label products, with insignificant revenue.
regulatory · 7 Aug 2026
FSSAI order on "100%" claims, stayed by court
On 3 Aug 2026 food regulator FSSAI barred the use of "100%" on a few food products and their sale. The Delhi High Court stayed the order on 7 Aug 2026; the next hearing is on 16 Dec 2026.
regulatory · 4 Aug 2026
Small penalties in 2026
An Almora magistrate imposed a ₹4 lakh penalty for alleged labelling breaches under the food safety law; the company said it will appeal. Dabur paid a ₹25.39 lakh GST penalty on 4 Aug 2026 to close an audit about input tax credit.
other · 13 Nov 2026
Global CEO resigned in Nov 2026
Mohit Malhotra resigned as Global CEO and whole-time director with effect from 13 Nov 2026. Herjit Singh Bhalla, CEO of the India business, joined the board; P. D. Narang oversees the international business.
Sources (13)
- Integrated Annual Report FY26 (2025-26)
- Integrated Annual Report FY24 (2023-24)
- Annual Report FY22 (2021-22)
- NSE results and shareholding XBRL facts (12 quarters, 5 years)
- Resignation of Global CEO, board and KMP changes
- Credit rating filing (Reg 30)
- SEBI administrative warning letter (Reg 30)
- US FDA import alert (Reg 30)
- Rumour verification: US drug regulator news item
- Delhi High Court stay order
- Update on letters dated 4 and 7 Aug 2026 (Reg 30)
- Penalty imposed (Reg 30)
- GST audit observations (Reg 30)
21How it got here
21How it got here
How did Dabur get here?
1884
Milestone
Founded in Calcutta
Dabur began in 1884 in a small pharmacy in Calcutta (now Kolkata), the company says.
2023
Business-model change
Bought into Badshah spices
The FY26 annual report lists Badshah Masala as a 51% subsidiary from 2 Jan 2023, taking Dabur into spice blends.
2024
Milestone
Sesa Care deal announced
In Oct 2024 Dabur agreed to merge Sesa Care, an Ayurvedic hair care brand, first buying 51% of its preference shares from True North.
2026
Crisis
US FDA import alert
On 10 Jun 2026 the US FDA put drugs made at the Silvassa plant on an import alert; the company says the revenue involved is insignificant.
2026
Crisis
FSSAI order stayed
FSSAI barred "100%" claims on a few food products on 3 Aug 2026; the Delhi High Court stayed the order on 7 Aug 2026.
2026
Milestone
Sesa Care merger sanctioned
The NCLT New Delhi bench sanctioned the merger on 24 Sep 2026, counting from 1 Apr 2026.
2026
Business-model change
No more global CEO
Global CEO Mohit Malhotra resigned with effect from 13 Nov 2026; India and international businesses now report to separate leaders.
22Sources and changes
Where every number on this page comes from
Sources (28 documents)
- S1Integrated Annual Report FY26 (2025-26) · Dabur India Ltd · Tier 1: company or exchange filing · 6 Jul 2026
- S2Integrated Annual Report FY25 (2024-25) · Dabur India Ltd · Tier 1: company or exchange filing · 9 Jul 2025
- S3Integrated Annual Report FY24 (2023-24) · Dabur India Ltd · Tier 1: company or exchange filing · 10 Jul 2024
- S4Integrated Annual Report FY23 (2022-23) · Dabur India Ltd · Tier 1: company or exchange filing
- S5Annual Report FY22 (2021-22) · Dabur India Ltd · Tier 1: company or exchange filing
- S7Q2 FY27 financial results · Dabur India Ltd · Tier 1: company or exchange filing · 4 Nov 2026
- S9Q2 FY27 press release · Dabur India Ltd · Tier 1: company or exchange filing · 4 Nov 2026
- S10Q2 FY27 analyst/investor meet transcript (5 Nov 2026) · Dabur India Ltd · Tier 1: company or exchange filing · 5 Nov 2026
- S11Q1 FY27 financial results · Dabur India Ltd · Tier 1: company or exchange filing · 29 Jul 2026
- S14Q1 FY27 earnings call transcript · Dabur India Ltd · Tier 1: company or exchange filing · 3 Aug 2026
- S15Q4 FY26 financial results · Dabur India Ltd · Tier 1: company or exchange filing · 7 May 2026
- S16Q4 FY26 investor communication · Dabur India Ltd · Tier 1: company or exchange filing · 7 May 2026
- S17Q4 FY26 earnings call transcript · Dabur India Ltd · Tier 1: company or exchange filing · 12 May 2026
- S19Q3 FY26 earnings call transcript · Dabur India Ltd · Tier 1: company or exchange filing · 3 Feb 2026
- S20Q2 FY26 earnings call transcript · Dabur India Ltd · Tier 1: company or exchange filing · 6 Nov 2025
- S23Credit rating filing (Reg 30) · Dabur India Ltd (NSE/BSE filing) · Tier 1: company or exchange filing · 17 Nov 2026
- S24Resignation of Global CEO, board and KMP changes · Dabur India Ltd (NSE/BSE filing) · Tier 1: company or exchange filing · 4 Nov 2026
- S25SEBI administrative warning letter (Reg 30) · Dabur India Ltd (NSE/BSE filing) · Tier 1: company or exchange filing · 6 Nov 2026
- S26Update on performance and demand trends · Dabur India Ltd (NSE/BSE filing) · Tier 1: company or exchange filing · 6 Oct 2026
- S28NCLT order pronouncement, scheme of arrangement · Dabur India Ltd (NSE/BSE filing) · Tier 1: company or exchange filing · 25 Sep 2026
- S30Update on letters dated 4 and 7 Aug 2026 (Reg 30) · Dabur India Ltd (NSE/BSE filing) · Tier 1: company or exchange filing · 25 Aug 2026
- S32Delhi High Court stay order · Dabur India Ltd (NSE/BSE filing) · Tier 1: company or exchange filing · 7 Aug 2026
- S33GST audit observations (Reg 30) · Dabur India Ltd (NSE/BSE filing) · Tier 1: company or exchange filing · 4 Aug 2026
- S35Quarterly update Q1 FY27 · Dabur India Ltd (NSE/BSE filing) · Tier 1: company or exchange filing · 3 Jul 2026
- S36US FDA import alert (Reg 30) · Dabur India Ltd (NSE/BSE filing) · Tier 1: company or exchange filing · 11 Jun 2026
- S37Rumour verification: US drug regulator news item · Dabur India Ltd (NSE/BSE filing) · Tier 1: company or exchange filing · 1 Jun 2026
- S39Penalty imposed (Reg 30) · Dabur India Ltd (NSE/BSE filing) · Tier 1: company or exchange filing · 10 Apr 2026
- S41NSE results and shareholding XBRL facts (12 quarters, 5 years) · NSE / Dabur India Ltd · Tier 1: company or exchange filing · 19 Nov 2026
Changes to this page (v1 · 19 Nov 2026)
- v1 · 19 Nov 2026First version. (first version)
Numbers come only from tier 1 and tier 2 sources. Read how we research.
Disclaimer
For learning only. Cityfort is not a SEBI-registered adviser and does not recommend buying or selling any security. Prices shown are dated and may be out of date.
Investing in securities involves risk, including loss of capital. Before making any investment decision, do your own research and consider consulting a SEBI-registered investment adviser.
Cityfort, its owners and contributors may or may not hold securities of companies covered. Content is not an offer or solicitation to buy or sell any security.
Read the full disclaimerHide the full disclaimer
Cityfort publishes educational content that explains how listed companies work. Cityfort is not registered with the Securities and Exchange Board of India (SEBI) as an Investment Adviser or Research Analyst and does not provide investment advice, recommendations, ratings, price targets or any opinion on whether to buy, sell or hold any security.
All information is taken from publicly available sources, mainly company filings on BSE and NSE, which are listed on each page with dates. We work to keep it accurate and correct errors publicly, but we do not guarantee that it is complete, accurate or up to date. Any market price or price-based ratio shown is dated, may be out of date by the time you read it, and is included only to explain concepts.
Statements by company management are reported as statements, with their date and source; they are not our forecasts.