Healthcare · NSE: MARKSANS · BSE: 524404
Marksans Pharma: how the business works
Marksans Pharma makes generic medicines, mostly over-the-counter products such as painkillers, for the US, UK, Europe and Australia, earning ₹2,951 crore of revenue in FY26.
Follow Marksans Pharma
Email me when Marksans Pharma's page is updated after results.
We store your email address with Kit, our email provider, which also records when you sign up and whether you open or click our emails. We send a confirmation email first. See our privacy policy.
Marksans Pharma Limited · Mumbai, Maharashtra · Founded 1992
Updated for Q2 FY27 · checked
- Revenue, FY26
- ₹2,951 cr
- Net profit, FY26
- ₹418 cr
- Manufacturing plants (Goa, US, UK)
- 4
- Incorporated
- 1992
- Promoter holding, 30 Sep 2026
- 43.87%
The short version
Marksans Pharma in 5 points
1 · What it sells
Marksans Pharma makes generic medicines, mostly over-the-counter products such as painkillers, often sold under shop chains' own brands, and its FY26 revenue was ₹2,951 crore.
2 · Who pays it
In FY26, customers in the US and North America gave 52.0% of Marksans' revenue, Europe and the UK 34.4%, Australia and New Zealand 10.3% and other countries 3.4%.
3 · What it keeps from ₹100
Of every ₹100 that came in during FY26, Marksans kept ₹13.8 as profit, and that ₹100 included ₹2.7 of other income, mostly currency gains, while operating profit before that income (EBITDA) was 20.4% of revenue (Cityfort calculation).
4 · Where the operating profit comes from
Marksans reports one segment and gives no profit by region or product, though its presentation put over-the-counter medicines at 80.0% of FY26 revenue and pain-management products at ₹1,311 crore.
5 · The one thing to watch
Two unnamed customers gave ₹679.1 crore, or 23.0%, of Marksans' FY26 revenue, while in FY24 and FY25 no single customer reached 10%.
Sources: From Marksans' FY24, FY25 and FY26 annual reports, its Q2 FY27 results notes and its Q2 FY27 investor presentation · checked
01Where the money goes · FY26
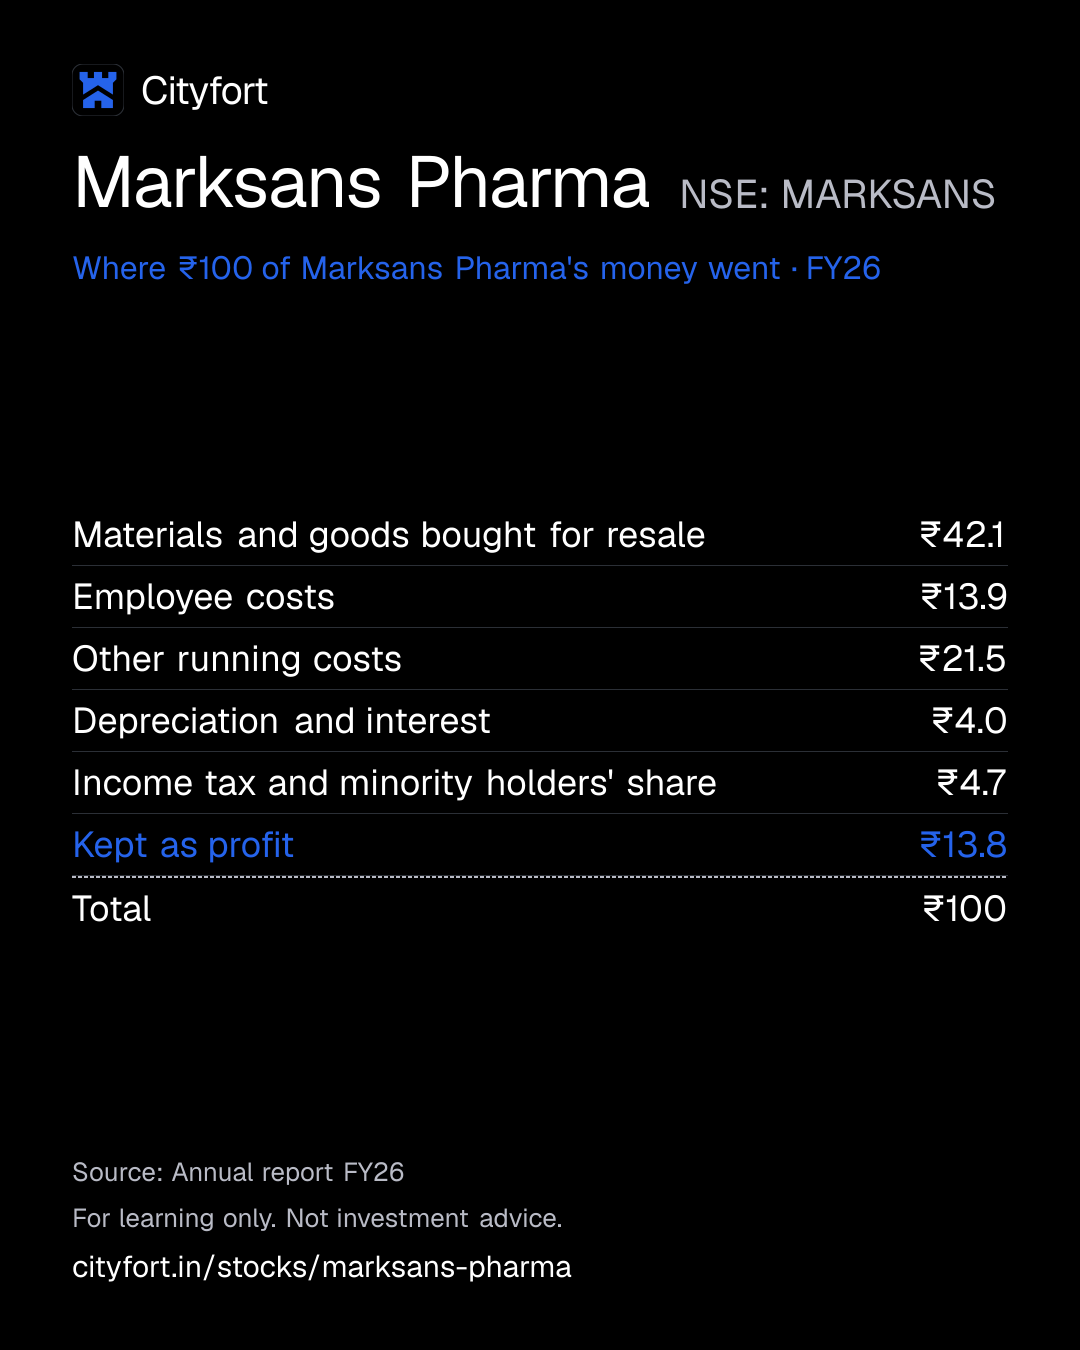
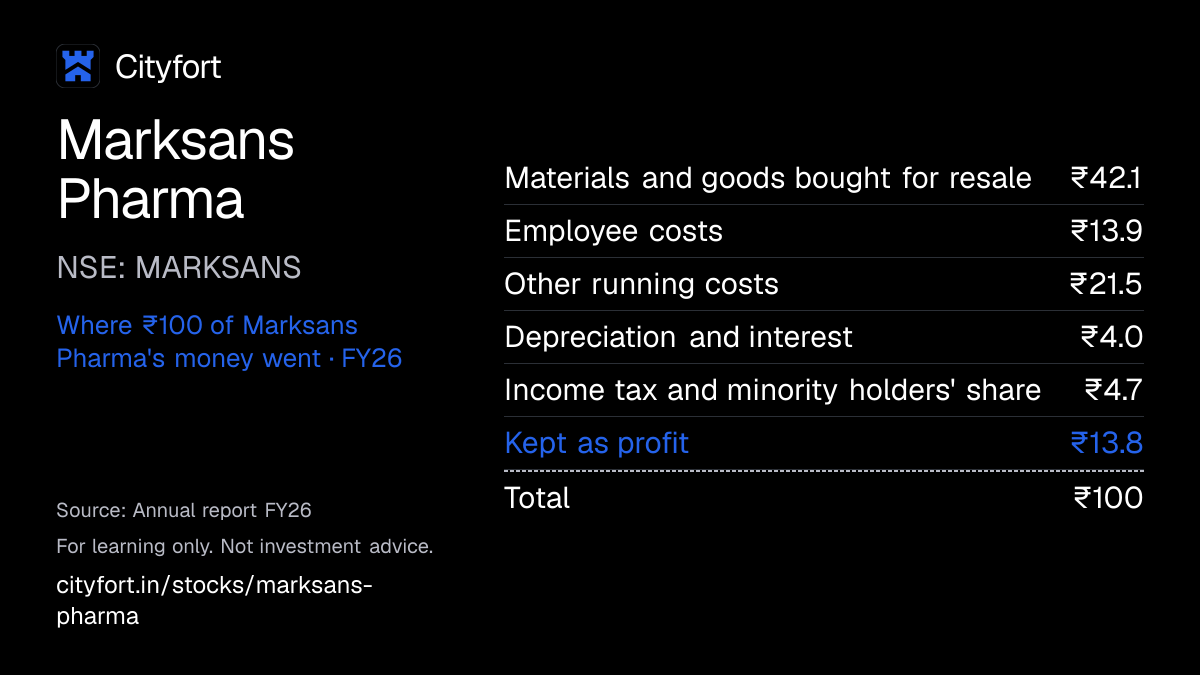
Where does ₹100 of Marksans Pharma's money go?
Marksans Pharma · FY26
Receipt for every ₹100
| Materials and goods bought for resale | ₹42.1 |
|---|---|
| Employee costs | ₹13.9 |
| Other running costs | ₹21.5 |
| Depreciation and interest | ₹4.0 |
| Income tax and minority holders' share | ₹4.7 |
| Kept as profit | ₹13.8 |
| Total | ₹100 |
Each line = amount ÷ total money in × 100. Lines may not add to exactly ₹100 because of rounding.
How this is worked out
Cityfort calculation from the FY26 annual report: each line ÷ total money in (revenue of ₹2,951 crore plus other income of ₹82.5 crore = ₹3,033 crore) × 100. Other income was ₹2.7 of each ₹100. The tax line includes ₹2.2 crore of profit belonging to Nova's minority holders.
Save this receipt as an image
Embed this receipt or the key numbers
Paste this code into a blog or website to show the card you choose, with a link back to this page.
Each week: the next company due to report results, explained in 5 points.
We'll email you once a week with what changed on Cityfort. Facts only, no tips. Unsubscribe any time.
We store your email address with Kit, our email provider, which also records when you sign up and whether you open or click our emails. We send a confirmation email first. See our privacy policy.
02The business in one line
What does Marksans Pharma do?
Shop chains and other buyers in the US, UK, Europe and Australia pay Marksans for the generic medicines it makes; materials take the biggest share, and ₹13.8 of every ₹100 that came in was left as profit in FY26.
- In FY26 customers in the US and North America gave 52.0% of Marksans' revenue, Europe and the UK 34.4%, Australia and New Zealand 10.3% and other countries 3.4%.
- Of every ₹100 that came in during FY26, ₹42.1 went on materials and goods bought for resale, ₹21.5 on other running costs and ₹13.9 on staff (Cityfort calculation).
03Who pays it
Who pays Marksans Pharma?
Buyers in the US and North America
52%
of revenue
Mostly retail chains buying store-brand OTC medicines. CARE said in Oct 2025 that about 90% of FY25 US revenue was OTC and that retail chains gave nearly 80% of OTC revenue. The US and North America gave 52.0% of FY26 revenue.
Buyers in Europe and the UK
34.4%
of revenue
Bell, Sons & Co. sells OTC medicines (450+ products) and Relonchem sells prescription generics in the UK; QliniQ (Netherlands) and ABCnow (Germany) joined in 2026. Europe and the UK gave 34.4% of FY26 revenue.
Buyers in Australia and New Zealand
10.3%
of revenue
Nova Pharmaceuticals, 60% owned, sells OTC and branded prescription medicines. Australia and New Zealand gave 10.3% of FY26 revenue.
Other countries, including India
3.4%
of revenue
About 10 countries in the CIS and the Middle East and North Africa. Other countries gave 3.4% of FY26 revenue.
- Buyers in the US and North America52%
- Buyers in Europe and the UK34.4%
- Buyers in Australia and New Zealand10.3%
- Other countries, including India3.4%
How spread out the customers are
Two unnamed customers each gave at least 10% of FY26 revenue, ₹679.1 crore (23.0%) together; in FY24 and FY25 no single customer reached 10%. One customer was more than 10% of trade receivables on 31 Mar 2026.
04How it makes money
How does Marksans Pharma make money?
Materials took a smaller share of each rupee of sales from FY22 to FY26, and operating profit a larger one.
Between FY22 and FY26, materials and goods bought for resale fell from 48.1% to 43.3% of revenue, while other running costs rose from 19.8% to 22.1% and staff costs moved from 14.8% to 14.3% (Cityfort calculations). EBITDA (profit before interest, tax and wear-and-tear of assets) rose from 17.4% to 20.4% of revenue. The company said its H1 FY27 gross margin of 58.8% was supported by lower-cost inventory, currency gains and product mix.
EBITDA margin (EBITDA ÷ revenue)
17.4%20.4%
FY22 to FY26
- Retail chains in the US and UK order medicines to sell under their own brand names.
- Marksans makes them in Goa, the US and the UK; management said in Feb 2026 that the newer Goa plant was running at around 50% of capacity.
- It files for new product licences (350+ approved by FY26) to add products to each shelf.
- Materials and goods bought for resale took 43.3% of FY26 revenue, against 48.1% in FY22 (Cityfort calculation).
- EBITDA was 20.4% of revenue in FY26 and 22.8% in Q2 FY27.
- Prices can fall: management described UK price erosion in Nov 2025, and Europe and UK revenue fell 1.4% in FY26.
↺ Step 6 feeds back into step 1.
05Business segments · FY26
Which businesses make up Marksans Pharma?
US and North America
52%Revenue by customer location from the annual report's geographic note; Marksans reports one business segment, so no profit is given by region. Mostly store-brand OTC medicines; up 24.0% in FY26.
Revenue ₹1,534 cr
Europe and UK
34.4%OTC and prescription medicines through Bell, Sons & Co. and Relonchem; down 1.4% in FY26.
Revenue ₹1,015 cr
Australia and New Zealand
10.3%OTC and branded prescription medicines through Nova Pharmaceuticals (60% owned).
Revenue ₹303 cr
Rest of world (incl. India)
3.4%Other countries, mainly in the CIS and the Middle East; FY22 and FY23 also include a separate India line.
Revenue ₹99.4 cr
How the mix changed
- US and North America
- Europe and UK
- Australia and New Zealand
- Rest of world (incl. India)
Revenue by segment, FY22 to FY26.
₹ crore
See the numbers
06The numbers · Consolidated · ₹ crore
How has Marksans Pharma done?
Revenue
₹2,951 crFY26
Revenue rose every year, from ₹1,491 crore in FY22 to ₹2,951 crore in FY26, and Q2 FY27 revenue of ₹940 crore was 30.5% above Q2 FY26, including QliniQ from Q1 FY27.
₹ crore
See the numbers
Net profit
₹418 crFY26
Net profit for Marksans' shareholders rose from ₹185 crore in FY22 to ₹418 crore in FY26, and Q2 FY27 profit of ₹141 crore was 43.8% above Q2 FY26; these figures leave out the profit of Nova's minority holders.
₹ crore
See the numbers
Net profit for every ₹100 of revenue
₹14.2FY26
EBITDA was 20.4% of revenue in FY26 against 17.4% in FY22, and 22.8% in Q2 FY27; no year or quarter shown had exceptional items, and EBITDA leaves out other income, which included ₹50.1 crore of currency gains in FY26.
Net margin: ₹ of net profit per ₹100 of revenue
See the numbers
Free cash flow
₹328 crFY26
Free cash flow (operating cash flow minus capital spending) was positive in every year from FY22 to FY26, ₹620 crore in total (Cityfort calculation), and ₹328 crore in FY26.
₹ crore · cash from operations minus spending on plants and equipment
See the numbers
See all yearly numbers
EBITDA = profit before interest, tax and wear-and-tear of assets. Financial year runs April to March (March year end). Net profit is the share belonging to the company's owners.
Sources (15)
- Annual Report 2022-23 (FY23)
- Annual Report 2021-22 (FY22)
- Annual Report 2023-24 (FY24)
- Consolidated results XBRL Q4 FY23 and FY23, incl. balance sheet and cash flow
- Consolidated results XBRL Q4 FY24 and FY24, incl. balance sheet and cash flow
- Annual Report 2025-26 (FY26), incl. BRSR
- Consolidated results XBRL Q4 FY26 and FY26, incl. balance sheet and cash flow (integrated filing)
- Consolidated results XBRL Q3 FY25 and 9M FY25
- Outcome of board meeting 19 May 2025: audited results Q4 FY25 and FY25 (standalone and consolidated; scanned)
- Consolidated results XBRL Q1 FY26 (integrated filing)
- Consolidated results XBRL Q2 FY26, incl. half-year balance sheet and cash flow (integrated filing)
- Consolidated results XBRL Q3 FY26 (integrated filing)
- Consolidated results XBRL Q1 FY27 (integrated filing)
- Consolidated results XBRL Q2 FY27, incl. half-year balance sheet and cash flow (integrated filing)
- Outcome of board meeting: unaudited results Q2 FY27 (standalone and consolidated)
07Who runs it
Who runs Marksans Pharma, and did they deliver?
Mark Saldanha
Chairman and Managing Director
Founder, the company's presentation says; CARE says he was earlier a whole-time director of Glenmark Pharmaceuticals. He held 43.80% of the shares on 30 Sep 2026. FY26 pay was ₹7.69 crore, and the group paid him ₹1.07 crore of rent.
Sandra Saldanha
Whole-time Director
A member of the promoter group, holding 0.02% of the shares on 30 Sep 2026.
Varddhman V. Jain
Whole-time Director
One of three executive directors on an eight-member board, which has four independent directors.
Jitendra Sharma
Group Chief Financial Officer
Also a director of the group's subsidiaries, CARE says.
Harshavardhan Panigrahi
Company Secretary
A key managerial person on 31 Mar 2026.
What they said, and what happened
1 delivered · 3 too early to tell
Said on 6 Feb 2026
Management said on the 6 Feb 2026 call that employee costs should come back to about 13–13.5% of revenue "maybe by the second quarter of next financial year".
DeliveredWhat happened
Employee costs were ₹122 crore in Q2 FY27, 13.0% of revenue, against 14.3% in FY26 (Cityfort calculation); Q2 FY27 includes QliniQ.
Said on 27 May 2026
Management said on the 27 May 2026 call that FY27 revenue would grow by 15% to 20%, with the EBITDA margin about the same as the 20–21% range it was asked about.
Too early to tellWhat happened
H1 FY27 revenue rose 32.9% and EBITDA was 24.0% of revenue, including about ₹84 crore of QliniQ revenue; the company put organic growth at about 27%. FY27 ends on 31 Mar 2027.
Said on 27 May 2026
Management said on the 27 May 2026 call: "our target is still there for INR4,000 crores in the next 2 years", and repeated the target on 13 Aug 2026.
Too early to tellWhat happened
FY26 revenue was ₹2,951 crore and H1 FY27 revenue ₹1,781 crore.
Said on 13 Aug 2026
Management said on the 13 Aug 2026 call that it expected QliniQ to bring in about ₹150–175 crore of revenue in FY27, and Germany to start bringing in revenue, perhaps early in the third quarter.
Too early to tellWhat happened
The company put QliniQ's H1 FY27 revenue at about ₹84 crore. ABCnow, in Germany, has been a subsidiary since 1 Jul 2026.
Sources (9)
- Earnings presentation Q2 & H1 FY27
- CARE Ratings: upgrade to CARE AA-; Stable / CARE A1+ (press release attached to company intimation)
- Shareholding pattern Sep-26 (XBRL)
- Annual Report 2025-26 (FY26), incl. BRSR
- Earnings call transcript Q3 FY26 (call 6 Feb 2026)
- Consolidated results XBRL Q2 FY27, incl. half-year balance sheet and cash flow (integrated filing)
- Earnings call transcript Q4 FY26 (call 27 May 2026)
- Earnings call transcript Q1 FY27 (call 13 Aug 2026)
- Outcome of board meeting: unaudited results Q2 FY27 (standalone and consolidated)
08What could go wrong
What could go wrong for Marksans Pharma?
- Concentration
Two customers give almost a quarter of revenue
Two unnamed customers gave ₹679.1 crore, 23.0% of FY26 revenue; in FY24 and FY25 no single customer reached 10%. CARE said retail chains gave nearly 80% of US OTC revenue in FY25.
Watch The customer note in the FY27 annual report.
- Pricing
Falling prices for generic medicines
Management said on the 14 Nov 2025 call that the UK had seen tremendous price erosion, and Europe and UK revenue fell 1.4% in FY26. The company said US prescription price erosion stayed in single digits in Q2 FY27.
Watch Europe and UK revenue each quarter, with and without QliniQ.
- Concentration
One therapy gives the biggest share
Pain-management products sold ₹1,311 crore, 44.4% of FY26 revenue (Cityfort calculation from the company's presentation). CARE called this a segment concentration risk in Oct 2025.
Watch The therapy split in the company's presentations.
- Regulation
Plant inspections by foreign regulators
Sales in the US, UK and Australia depend on plants their regulators approve. A subsidiary received a US FDA observation in Apr 2025, closed in Jun 2025, CARE said; the second Goa plant's Nov 2025 inspection ended with zero observations.
Watch US FDA, UK MHRA and Australian TGA inspection results filed with the exchanges.
- Regulation
US trade rules
The US and North America gave 52.0% of FY26 revenue. CARE said in Oct 2025 that a 100% US tariff on imported branded or patented medicines did not apply to generics, Marksans' main business, and that tariff developments would remain a key monitorable.
Watch US tariff rules for generic medicines and US revenue each quarter.
- Currency
Currency moves
The Indian company exported 100% of its FY26 turnover, and other income included ₹50.1 crore of currency gains in FY26. CARE said the company's exposure is mainly in US dollars and euros.
Watch Currency gains or losses in the notes to each quarter's results.
- Execution
Fitting in new acquisitions
Goodwill rose from ₹45.3 crore on 31 Mar 2026 to ₹103 crore on 30 Sep 2026 after the QliniQ and ABCnow purchases, whose purchase price allocations are still provisional.
Watch Final purchase price allocation and QliniQ's revenue against management's ₹150–175 crore expectation for FY27.
Sources (11)
- Annual Report 2025-26 (FY26), incl. BRSR
- Annual Report 2024-25 (FY25)
- Annual Report 2023-24 (FY24)
- CARE Ratings: upgrade to CARE AA-; Stable / CARE A1+ (press release attached to company intimation)
- Earnings call transcript Q2 FY26 (call 14 Nov 2025)
- Earnings presentation Q2 & H1 FY27
- US FDA cGMP inspection at 2nd Goa facility (Verna) closed with zero Form 483 observations
- Outcome of board meeting: unaudited results Q2 FY27 (standalone and consolidated)
- Consolidated results XBRL Q2 FY27, incl. half-year balance sheet and cash flow (integrated filing)
- Consolidated results XBRL Q4 FY26 and FY26, incl. balance sheet and cash flow (integrated filing)
- Earnings call transcript Q1 FY27 (call 13 Aug 2026)
09Supporters and critics
What do supporters and critics point to?
What supporters point to
- Revenue rose every year from FY22 to FY26, from ₹1,491 crore to ₹2,951 crore, and profit for shareholders from ₹185 crore to ₹418 crore.
- Free cash flow was positive in each of the five years, ₹620 crore in total, and borrowings were ₹29.0 crore against ₹1,124 crore of cash and investments on 30 Sep 2026.
- No promoter shares were pledged in any of the 12 quarters from Dec 2023 to Sep 2026.
- The second Goa plant's US FDA inspection in Nov 2025 ended with zero Form 483 observations.
- Without QliniQ, the company put Q2 FY27 revenue growth at about 25%.
What critics point to
- Two unnamed customers gave 23.0% of FY26 revenue, while no single customer reached 10% in FY24 or FY25.
- CARE said about 45% of revenue came from pain management and called the OTC segment highly competitive and price-sensitive.
- Europe and UK revenue fell 1.4% in FY26, and management described UK price erosion on the Nov 2025 call.
- Lease liabilities of ₹314 crore on 31 Mar 2026 were more than ten times borrowings of ₹29.6 crore.
- Other income in FY26 included ₹50.1 crore of currency gains, equal to 8.9% of profit before tax (Cityfort calculation).
10What to watch next
What should you watch next at Marksans Pharma?
Next event
Q3 FY27 results
Date not announced yet.
Customer concentration
Two customers gave 23.0% of FY26 revenue; the FY27 annual report will show whether that share changed.
Growth without acquisitions
The company put Q2 FY27 revenue growth without QliniQ at about 25%; ABCnow has been included since 1 Jul 2026.
The ₹4,000 crore target
Management said on 27 May 2026 that its target was ₹4,000 crore of revenue in the next 2 years; FY26 revenue was ₹2,951 crore and H1 FY27 revenue ₹1,781 crore.
11Key facts
Key facts about Marksans Pharma
- What does Marksans Pharma do?
- Marksans Pharma Ltd, a Mumbai company incorporated in 1992, makes generic medicines such as painkillers and cough-and-cold products at four plants, two in Goa and one each in the US and the UK. Marksans Pharma sells them mainly in the US, the UK, Europe and Australia, and its FY26 revenue was ₹2,951 crore.
- How does Marksans Pharma make money?
- Marksans Pharma earns most of its money from medicines sold without a prescription: its presentation put over-the-counter (OTC) products at 80.0% of FY26 revenue and prescription medicines at 20.0%. Pain-management products sold ₹1,311 crore in FY26, 44.4% of Marksans Pharma's revenue (Cityfort calculation from the company's presentation).
- Who are Marksans Pharma's customers?
- Marksans Pharma makes medicines that retail chains sell under their own brands; CARE Ratings said in Oct 2025 that retail chains gave nearly 80% of Marksans Pharma's US OTC revenue in FY25. In FY26 two unnamed customers together gave ₹679 crore, or 23.0% of Marksans Pharma's revenue.
- How big is Marksans Pharma?
- In FY26 Marksans Pharma earned ₹2,951 crore of revenue and ₹418 crore of net profit for its shareholders, against ₹2,623 crore and ₹381 crore in FY25. The FY26 annual report says the Marksans Pharma group has more than 2,000 employees.
- Who owns Marksans Pharma?
- On 30 Sep 2026 the promoter group held 43.87% of Marksans Pharma, almost all of it (43.80%) in founder Mark Saldanha's name, with no shares pledged. OrbiMed Asia IV Mauritius held 8.62%, foreign portfolio investors 10.44%, Indian institutions 5.54% and other shareholders 31.53%.
- How did Marksans Pharma do in Q2 FY27?
- In Q2 FY27 (Jul–Sep 2026) Marksans Pharma's revenue was ₹940 crore, up 30.5% from ₹720 crore in Q2 FY26, and net profit for shareholders was ₹141 crore, up 43.8% from ₹98.3 crore. Marksans Pharma said QliniQ, a Dutch company it bought in 2026, added about ₹40 crore of the quarter's revenue.
- Does Marksans Pharma have debt?
- Marksans Pharma had ₹29.0 crore of borrowings and ₹1,124 crore of cash, bank balances and current investments on 30 Sep 2026. Marksans Pharma's lease liabilities, shown separately from borrowings, were ₹314 crore on 31 Mar 2026.
- What dividend does Marksans Pharma pay?
- Marksans Pharma's board recommended a final dividend of ₹0.90 a share for FY26, against ₹0.80 for FY25 and ₹0.60 for FY24. The FY26 dividend comes to ₹40.8 crore.
- What did Marksans Pharma buy in 2026?
- Marksans Pharma bought QliniQ B.V. of the Netherlands for EUR 7.50 million, a subsidiary from 1 Apr 2026, and ABCnow GmbH of Germany, a subsidiary from 1 Jul 2026, for EUR 1.10 million according to the Q2 FY27 results.
Sources (11)
- Annual Report 2025-26 (FY26), incl. BRSR
- CARE Ratings: upgrade to CARE AA-; Stable / CARE A1+ (press release attached to company intimation)
- Earnings presentation Q2 & H1 FY27
- Shareholding pattern Sep-26 (XBRL)
- Consolidated results XBRL Q2 FY27, incl. half-year balance sheet and cash flow (integrated filing)
- Consolidated results XBRL Q2 FY26, incl. half-year balance sheet and cash flow (integrated filing)
- Annual Report 2024-25 (FY25)
- Annual Report 2023-24 (FY24)
- Outcome of board meeting 26 May 2026: audited FY26 results and final dividend ₹0.90 a share
- Press release and Reg. 30 disclosure: agreement to acquire QliniQ B.V.
- Outcome of board meeting: unaudited results Q2 FY27 (standalone and consolidated)
Terms on this page
- Capital expenditure (capex)
- Credit rating
- Dividend payout ratio
- EBITDA
- FII and DII holding
- Free cash flow
- Market capitalisation
- Net debt
- Net profit
- Operating margin
Each explains the term in plain English, with the same number from other companies on Cityfort.
Go deeper
More detail from the same filings. Open any section.
12What it sells
12What it sells
What does Marksans Pharma sell?
Over-the-counter (OTC) medicines
Painkillers, cough-and-cold, digestive and allergy products that people buy without a prescription. The company's presentation put OTC at 80.0% of FY26 revenue. It says about 85% of OTC revenue came from store brands (shop chains' own labels) and the rest from its own labels, an approximate split.
Prescription generics
Medicines a doctor prescribes, 20.0% of FY26 revenue. Relonchem holds 175+ UK marketing authorisations (licences to sell a medicine), and Nova Pharmaceuticals launched 11 branded prescription medicines in Australia and New Zealand in FY26.
Pain-management products
The largest therapy group: ₹1,311 crore in FY26, 44.4% of revenue (Cityfort calculation from the company's presentation). CARE Ratings put pain management at about 45% of revenue and cough and cold at 13% in its Oct 2025 report.
What it does
- Does: Makes medicines at four plants: two in Verna, Goa, one in the US (Time-Cap Labs) and one in the UK
- Does: Holds 350+ approved product licences (US ANDAs and marketing authorisations elsewhere), with 30+ awaiting approval, the FY26 annual report says
- Does: Exports everything the Indian company makes: 100% of the standalone FY26 turnover went abroad, to 50+ countries
What it does not do
- Does not: Does not sell much in India: India sits in 'rest of world', which with other countries gave 3.4% of FY26 revenue
- Does not: Does not name its two largest customers
- Does not: Does not report profit by region or product: it reports one segment, pharmaceuticals
13How the money flows
13How the money flows · FY26
How does money flow through Marksans Pharma?
Money in
- Revenue from operations₹2,951 cr
- Other income (including ₹50.1 crore of currency gains)₹82.5 cr
The company
Marksans Pharma
₹3,033 cr came in
Money out
- Materials and goods bought for resale₹1,277 cr
- Employee costs₹421 cr
- Other running costs₹652 cr
- Depreciation and interest₹123 cr
- Income tax₹141 cr
- Profit belonging to Nova's minority holders₹2.2 cr
- Net profit₹418 cr
- In FY26 Marksans sold ₹2,951 crore of medicines and earned ₹82.5 crore of other income, including ₹50.1 crore of currency gains.
- Materials and goods bought for resale took ₹1,277 crore, the biggest cost.
- Other running costs took ₹652 crore and employees ₹421 crore.
- Depreciation and interest took ₹123 crore, income tax ₹141 crore and Nova's minority holders ₹2.2 crore.
- What was left was ₹418 crore of net profit for Marksans' shareholders.
14What it needs to run
14What it needs to run
What does Marksans Pharma need to run?
Plants
Four manufacturing units: two in Verna, Goa, one in the US and one in the UK. The Indian plants can make 14 billion tablets and 2.4 billion soft-gel and hard capsules a year.
Regulator approvals
Buyers in the US, UK and Australia need plants their regulators approve. The second Goa plant, bought from Tevapharm India in FY23, Marksans announced on 20 Mar 2025 that the plant had won Australian TGA approval, and a US FDA inspection on 3–7 Nov 2025 ended with zero Form 483 observations (no inspector findings recorded).
Product licences
Each medicine needs a licence in each country. The FY26 annual report lists 350+ approved licences, 30+ awaiting approval and 200+ products in development; R&D spending was ₹89.0 crore in FY26.
People
More than 2,000 employees across the group; the Indian company had 1,685 permanent employees on 31 Mar 2026.
Stock and credit to customers
Inventories were ₹972 crore and trade receivables ₹645 crore on 31 Mar 2026. The company put its working-capital cycle at about 138 days in FY26 and about 128 days in H1 FY27.
Sources (6)
- Annual Report 2025-26 (FY26), incl. BRSR
- CARE Ratings: upgrade to CARE AA-; Stable / CARE A1+ (press release attached to company intimation)
- Annual Report 2022-23 (FY23)
- Australian TGA approval for Verna (Goa) facility
- US FDA cGMP inspection at 2nd Goa facility (Verna) closed with zero Form 483 observations
- Earnings presentation Q2 & H1 FY27
15Where growth could come from
15Where growth could come from
Where could Marksans Pharma's growth come from?
Management said on the 27 May 2026 call that it expected FY27 revenue to grow by 15% to 20%, with the EBITDA margin about the same as the 20–21% range it was asked about, and that "our target is still there for INR4,000 crores in the next 2 years". On the 13 Aug 2026 call management said it would stick with that plan.
US store brands
Working₹1,534 crore, FY26 (up 24.0%)
US and North America revenue rose from ₹1,237 crore in FY25 to ₹1,534 crore in FY26. The company put Q2 FY27 at ₹421 crore, up 8.7%, and says it aims to double US store-brand OTC revenue, without giving a date.
Status: Working, on track against what the company said.
UK and Europe
Mixed₹405 crore, Q2 FY27 (company)
Europe and UK revenue fell 1.4% in FY26 to ₹1,015 crore. The company put Q2 FY27 at ₹405 crore, up 64.9%, or 48.6% without QliniQ, and said the UK market had stabilised after a flat FY26.
Status: Mixed, partly on track.
European acquisitions
NewAbout ₹84 crore, H1 FY27 (QliniQ, company)
QliniQ (Netherlands) is a subsidiary from 1 Apr 2026 and ABCnow (Germany) from 1 Jul 2026. Management said on 13 Aug 2026 that it expected QliniQ to bring in about ₹150–175 crore of revenue in FY27.
Status: New, recently announced.
Australia and New Zealand
Working₹303 crore, FY26 (₹180 crore in FY22)
Nova (60% owned) launched 11 branded prescription medicines in FY26. The company put Q2 FY27 revenue in the region at ₹101 crore, up 64.0%.
Status: Working, on track against what the company said.
Second Goa plant
WorkingAround 50% used, Feb 2026 (management)
Bought from Tevapharm India in FY23. CARE said it brought in over ₹300 crore of revenue in FY25, and its US FDA inspection in Nov 2025 ended with zero observations.
Status: Working, on track against what the company said.
Status compares progress with what the company itself said it would do: Working = on track against what the company said; Mixed = partly on track; Behind = behind the company's own plan; New = recently announced; Early = too early to judge.
Sources (9)
- Earnings call transcript Q4 FY26 (call 27 May 2026)
- Earnings call transcript Q1 FY27 (call 13 Aug 2026)
- Annual Report 2025-26 (FY26), incl. BRSR
- Earnings presentation Q2 & H1 FY27
- Outcome of board meeting: unaudited results Q2 FY27 (standalone and consolidated)
- Annual Report 2022-23 (FY23)
- Earnings call transcript Q3 FY26 (call 6 Feb 2026)
- CARE Ratings: upgrade to CARE AA-; Stable / CARE A1+ (press release attached to company intimation)
- US FDA cGMP inspection at 2nd Goa facility (Verna) closed with zero Form 483 observations
16Financial strength and debt
16Financial strength · 30 Sep 2026
How much debt does Marksans Pharma have?
- Total debt₹29 cr
- Cash and investments₹1,124 cr
- Net cash (cash minus debt)₹1,095 cr
- Net worth (shareholders' money)₹3,332 cr
- Debt to equity
- 0.01×
- ₹ of debt for every ₹1 of shareholders' money
- Borrowings are all short-term and were between ₹23 crore and ₹42 crore at every year end from Mar 2022 to Mar 2026.
- Lease liabilities are shown separately from borrowings: ₹314 crore on 31 Mar 2026, against ₹69.5 crore on 31 Mar 2022. Counting them, cash and investments exceeded borrowings and leases by ₹646 crore on 31 Mar 2026 (Cityfort calculation from the FY26 annual report).
- The FY26 annual report shows no contingent liabilities on 31 Mar 2026 or 31 Mar 2025.
- Inventories were ₹996 crore and trade receivables ₹757 crore on 30 Sep 2026.
- CARE Ratings upgraded the long-term bank facilities to CARE AA-; Stable on 6 Oct 2025, and India Ratings revised its outlook to Positive on 9 Jun 2026.
- Debt to equity = borrowings ÷ shareholders' equity of ₹3,332 crore (Cityfort calculation).
Sources (6)
- Consolidated results XBRL Q2 FY27, incl. half-year balance sheet and cash flow (integrated filing)
- Earnings presentation Q2 & H1 FY27
- Annual Report 2025-26 (FY26), incl. BRSR
- Annual Report 2022-23 (FY23)
- CARE Ratings: upgrade to CARE AA-; Stable / CARE A1+ (press release attached to company intimation)
- Intimation: India Ratings outlook revised to Positive, IND AA-/IND A1+ affirmed
17Who owns it
17Who owns it · Q2 FY27
Who owns Marksans Pharma?
- Promoters (founders or parent company)43.9%
- Foreign institutions (FII)10.4%
- Indian institutions (DII)5.5%
- Public and others40.2%
Promoter pledge
No promoter shares were pledged in Q2 FY27.
How ownership changed
* Pledged = share of the promoters' own holding reported as pledged. In older filings this can include shares “otherwise encumbered”; the governance flags say when.
† Others = OrbiMed Asia IV Mauritius (foreign direct investment).
Sources (12)
- Shareholding pattern Dec-23 (XBRL)
- Shareholding pattern Mar-24 (XBRL)
- Shareholding pattern Jun-24 (XBRL)
- Shareholding pattern Sep-24 (XBRL)
- Shareholding pattern Dec-24 (XBRL)
- Shareholding pattern Mar-25 (XBRL)
- Shareholding pattern Jun-25 (XBRL)
- Shareholding pattern Sep-25 (XBRL)
- Shareholding pattern Dec-25 (XBRL); revised file of 19 May 2026
- Shareholding pattern Mar-26 (XBRL)
- Shareholding pattern Jun-26 (XBRL)
- Shareholding pattern Sep-26 (XBRL)
18What it does with profit
18What it does with profit
What does Marksans Pharma do with its profit?
Dividend per share
₹0.90FY26
Dividend paid for each share, by financial year.
₹ per share
See the numbers
No buybacks or fund raises in the period covered.
19Governance signals
19Governance signals
What do Marksans Pharma's governance filings show?
- Auditor
- M S K A & Associates LLP, since 2022
- Auditor changes
- 31 May 2022: Bhuta Shah & Co. LLP → M S K A & Associates (Bhuta Shah & Co. LLP resigned, citing preoccupation with other assignments and the voluminous audit work involved; the board appointed M S K A & Associates on 30 May 2022 to fill the casual vacancy, the FY22 annual report says.)
- Audit qualifications
- None reported
- Related-party dealings
- In FY26 the group paid key managers ₹13.3 crore of remuneration, ₹7.69 crore of it to Mark Saldanha, and paid him ₹1.07 crore of rent, according to the consolidated related-party note of the FY26 annual report.
- Credit rating
- India Ratings and Research IND AA-/Positive/IND A1+ on ₹195.75 crore of bank loan facilities (outlook revised to Positive from Stable) (outlook Positive), 9 Jun 2026
A credit rating describes the company's ability to repay debt. It is not a rating of the share.
Flags to know about
auditor · 31 May 2022
Previous auditor resigned in 2022
Bhuta Shah & Co. LLP resigned as statutory auditor with effect from 31 May 2022, citing preoccupation with other assignments and the voluminous audit work involved. The board appointed M S K A & Associates the day before, and the FY22 AGM notice sought a five-year term for it.
regulatory · 6 Oct 2025
US FDA observation at a subsidiary, closed
CARE said that in Apr 2025 one of Marksans' subsidiaries received an inspectional observation from the US FDA on routine current good manufacturing practices, and that the FDA issued an Establishment Inspection Report closing the inspection in Jun 2025.
disclosure · 4 Aug 2026
Largest customers not named
The FY26 annual report says two customers gave ₹679.1 crore, 23.0% of revenue, but does not name them, and Marksans reports a single segment with no profit by region or product.
20What the market paid
20What the market paid · price as of 11 Nov 2026
What did the market pay for Marksans Pharma on 11 Nov 2026?
Price as of 11 Nov 2026 (shown for education; prices change daily).
Price as of 11 Nov 2026: ₹306.55, the NSE closing price. Market value = price × 453,163,746 shares (30 Sep 2026 shareholding pattern) = ₹13,892 crore (Cityfort calculation from the NSE closing price and the shareholding pattern); 56,250 more shares were allotted under the ESOP scheme on 4 Nov 2026. P/E (price ÷ earnings) = market value ÷ profit for shareholders of the last four quarters (Q3 FY26 to Q2 FY27, ₹560 crore) = 24.8; on FY26 profit it is 33.2. P/B = market value ÷ shareholders' equity on 30 Sep 2026 (₹3,332 crore) = 4.2. Dividend yield = FY26 dividend of ₹0.90 ÷ price = 0.29%.
- Share price
- ₹306.55
- Market value (market cap)
- ₹13,892 cr
- P/E
- 24.8×
- P/B
- 4.2×
Source: NSE historical price data MARKSANS (EQ), 2–11 Nov 2026; close ₹306.55 on 11 Nov 2026; Shareholding pattern Sep-26 (XBRL); Allotment of 56,250 shares under ESOP Scheme 2024 and 5 more
Sources (8)
- NSE historical price data MARKSANS (EQ), 2–11 Nov 2026; close ₹306.55 on 11 Nov 2026
- Shareholding pattern Sep-26 (XBRL)
- Allotment of 56,250 shares under ESOP Scheme 2024
- Consolidated results XBRL Q3 FY26 (integrated filing)
- Consolidated results XBRL Q4 FY26 and FY26, incl. balance sheet and cash flow (integrated filing)
- Consolidated results XBRL Q1 FY27 (integrated filing)
- Consolidated results XBRL Q2 FY27, incl. half-year balance sheet and cash flow (integrated filing)
- Annual Report 2025-26 (FY26), incl. BRSR
21How it got here
21How it got here
How did Marksans Pharma get here?
1992
Milestone
Incorporated
Marksans Pharma Ltd was incorporated in 1992, its FY26 annual report says.
2003
Business-model change
Separated from Glenmark
The FY26 annual report's timeline says the company began as a wholly owned subsidiary of Glenmark Pharmaceuticals, was spun off in 2003 as Glenmark Laboratories Ltd and renamed Marksans Pharma Ltd.
2005
Milestone
Australia: Nova Pharmaceuticals
Marksans bought 60% of Nova Pharmaceuticals Australasia, its business in Australia and New Zealand.
2007
Business-model change
UK: Bell, Sons & Co.
Marksans bought Bell, Sons & Co. (Druggists), a UK OTC medicine maker, and added Relonchem, a UK prescription generics company, in 2008.
2015
Business-model change
US: Time-Cap Labs
Marksans bought Time-Cap Laboratories, a US maker of OTC medicines; the US and North America became its largest region, 52.0% of FY26 revenue.
2023
Milestone
Second Goa plant and ₹372 crore raised
Marksans bought a plant in Goa from Tevapharm India and raised ₹372.40 crore when warrants issued to OrbiMed and the promoters were converted into shares.
2025
Milestone
US FDA inspection with zero observations
The US FDA inspected the second Goa plant on 3–7 Nov 2025 and closed with zero Form 483 observations.
2026
Business-model change
Into mainland Europe
Marksans bought QliniQ B.V. in the Netherlands (a subsidiary from 1 Apr 2026) and ABCnow GmbH in Germany (from 1 Jul 2026).
Sources (7)
- Annual Report 2025-26 (FY26), incl. BRSR
- Earnings presentation Q2 & H1 FY27
- Annual Report 2022-23 (FY23)
- US FDA cGMP inspection at 2nd Goa facility (Verna) closed with zero Form 483 observations
- Press release and Reg. 30 disclosure: agreement to acquire QliniQ B.V.
- Completion of ABCnow GmbH acquisition
- Outcome of board meeting: unaudited results Q2 FY27 (standalone and consolidated)
22Sources and changes
Where every number on this page comes from
Sources (42 documents)
- S1Annual Report 2025-26 (FY26), incl. BRSR · Marksans Pharma Ltd (company IR site) · Tier 1: company or exchange filing · 4 Aug 2026
- S2Annual Report 2024-25 (FY25) · Marksans Pharma Ltd (company IR site) · Tier 1: company or exchange filing · 16 Jul 2025
- S3Annual Report 2023-24 (FY24) · Marksans Pharma Ltd (company IR site) · Tier 1: company or exchange filing · 31 Aug 2024
- S4Annual Report 2022-23 (FY23) · Marksans Pharma Ltd (company IR site) · Tier 1: company or exchange filing · 8 Aug 2023
- S5Annual Report 2021-22 (FY22) · Marksans Pharma Ltd (company IR site) · Tier 1: company or exchange filing · 4 Aug 2022
- S6Consolidated results XBRL Q2 FY27, incl. half-year balance sheet and cash flow (integrated filing) · NSE (XBRL) · Tier 1: company or exchange filing · 4 Nov 2026
- S7Consolidated results XBRL Q1 FY27 (integrated filing) · NSE (XBRL) · Tier 1: company or exchange filing · 12 Aug 2026
- S8Consolidated results XBRL Q4 FY26 and FY26, incl. balance sheet and cash flow (integrated filing) · NSE (XBRL) · Tier 1: company or exchange filing · 26 May 2026
- S9Consolidated results XBRL Q3 FY26 (integrated filing) · NSE (XBRL) · Tier 1: company or exchange filing · 5 Feb 2026
- S10Consolidated results XBRL Q2 FY26, incl. half-year balance sheet and cash flow (integrated filing) · NSE (XBRL) · Tier 1: company or exchange filing · 13 Nov 2025
- S11Consolidated results XBRL Q1 FY26 (integrated filing) · NSE (XBRL) · Tier 1: company or exchange filing · 12 Aug 2025
- S13Consolidated results XBRL Q3 FY25 and 9M FY25 · NSE (XBRL) · Tier 1: company or exchange filing · 11 Feb 2025
- S14Consolidated results XBRL Q4 FY24 and FY24, incl. balance sheet and cash flow · NSE (XBRL) · Tier 1: company or exchange filing · 30 May 2024
- S15Consolidated results XBRL Q4 FY23 and FY23, incl. balance sheet and cash flow · NSE (XBRL) · Tier 1: company or exchange filing · 31 May 2023
- S16Outcome of board meeting: unaudited results Q2 FY27 (standalone and consolidated) · Marksans Pharma Ltd (company IR site) · Tier 1: company or exchange filing · 4 Nov 2026
- S17Earnings presentation Q2 & H1 FY27 · Marksans Pharma Ltd (company IR site) · Tier 1: company or exchange filing · 4 Nov 2026
- S19Earnings call transcript Q1 FY27 (call 13 Aug 2026) · Marksans Pharma Ltd (company IR site) · Tier 1: company or exchange filing · 20 Aug 2026
- S20Earnings call transcript Q4 FY26 (call 27 May 2026) · Marksans Pharma Ltd (company IR site) · Tier 1: company or exchange filing · 3 Jun 2026
- S21Earnings call transcript Q3 FY26 (call 6 Feb 2026) · Marksans Pharma Ltd (company IR site) · Tier 1: company or exchange filing · 12 Feb 2026
- S22Earnings call transcript Q2 FY26 (call 14 Nov 2025) · Marksans Pharma Ltd (company IR site) · Tier 1: company or exchange filing · 21 Nov 2025
- S23Shareholding pattern Dec-23 (XBRL) · NSE (XBRL) · Tier 1: company or exchange filing · 17 Jan 2024
- S24Shareholding pattern Mar-24 (XBRL) · NSE (XBRL) · Tier 1: company or exchange filing · 15 Apr 2024
- S25Shareholding pattern Jun-24 (XBRL) · NSE (XBRL) · Tier 1: company or exchange filing · 12 Jul 2024
- S26Shareholding pattern Sep-24 (XBRL) · NSE (XBRL) · Tier 1: company or exchange filing · 17 Oct 2024
- S27Shareholding pattern Dec-24 (XBRL) · NSE (XBRL) · Tier 1: company or exchange filing · 13 Jan 2025
- S28Shareholding pattern Mar-25 (XBRL) · NSE (XBRL) · Tier 1: company or exchange filing · 11 Apr 2025
- S29Shareholding pattern Jun-25 (XBRL) · NSE (XBRL) · Tier 1: company or exchange filing · 18 Jul 2025
- S30Shareholding pattern Sep-25 (XBRL) · NSE (XBRL) · Tier 1: company or exchange filing · 17 Oct 2025
- S31Shareholding pattern Dec-25 (XBRL); revised file of 19 May 2026 · NSE (XBRL) · Tier 1: company or exchange filing · 13 Jan 2026
- S32Shareholding pattern Mar-26 (XBRL) · NSE (XBRL) · Tier 1: company or exchange filing · 10 Apr 2026
- S33Shareholding pattern Jun-26 (XBRL) · NSE (XBRL) · Tier 1: company or exchange filing · 20 Jul 2026
- S34Shareholding pattern Sep-26 (XBRL) · NSE (XBRL) · Tier 1: company or exchange filing · 15 Oct 2026
- S35CARE Ratings: upgrade to CARE AA-; Stable / CARE A1+ (press release attached to company intimation) · Marksans Pharma Ltd (NSE filing) · Tier 2: rating agency or regulator · 8 Oct 2025
- S36Intimation: India Ratings outlook revised to Positive, IND AA-/IND A1+ affirmed · Marksans Pharma Ltd (NSE filing) · Tier 1: company or exchange filing · 9 Jun 2026
- S37Press release and Reg. 30 disclosure: agreement to acquire QliniQ B.V. · Marksans Pharma Ltd (NSE filing) · Tier 1: company or exchange filing · 1 Jun 2026
- S40Completion of ABCnow GmbH acquisition · Marksans Pharma Ltd (NSE filing) · Tier 1: company or exchange filing · 20 Jul 2026
- S41US FDA cGMP inspection at 2nd Goa facility (Verna) closed with zero Form 483 observations · Marksans Pharma Ltd (NSE filing) · Tier 1: company or exchange filing · 10 Nov 2025
- S42Australian TGA approval for Verna (Goa) facility · Marksans Pharma Ltd (NSE filing) · Tier 1: company or exchange filing · 20 Mar 2025
- S43Allotment of 56,250 shares under ESOP Scheme 2024 · Marksans Pharma Ltd (NSE filing) · Tier 1: company or exchange filing · 4 Nov 2026
- S44Outcome of board meeting 26 May 2026: audited FY26 results and final dividend ₹0.90 a share · Marksans Pharma Ltd (NSE filing) · Tier 1: company or exchange filing · 26 May 2026
- S46NSE historical price data MARKSANS (EQ), 2–11 Nov 2026; close ₹306.55 on 11 Nov 2026 · NSE · Tier 1: company or exchange filing · 11 Nov 2026
- S49Outcome of board meeting 19 May 2025: audited results Q4 FY25 and FY25 (standalone and consolidated; scanned) · Marksans Pharma Ltd (company IR site) · Tier 1: company or exchange filing · 19 May 2025
Changes to this page (v1 · 12 Nov 2026)
- v1 · 12 Nov 2026First version. (first version)
Numbers come only from tier 1 and tier 2 sources. Read how we research.
Disclaimer
For learning only. Cityfort is not a SEBI-registered adviser and does not recommend buying or selling any security. Prices shown are dated and may be out of date.
Investing in securities involves risk, including loss of capital. Before making any investment decision, do your own research and consider consulting a SEBI-registered investment adviser.
Cityfort, its owners and contributors may or may not hold securities of companies covered. Content is not an offer or solicitation to buy or sell any security.
Read the full disclaimerHide the full disclaimer
Cityfort publishes educational content that explains how listed companies work. Cityfort is not registered with the Securities and Exchange Board of India (SEBI) as an Investment Adviser or Research Analyst and does not provide investment advice, recommendations, ratings, price targets or any opinion on whether to buy, sell or hold any security.
All information is taken from publicly available sources, mainly company filings on BSE and NSE, which are listed on each page with dates. We work to keep it accurate and correct errors publicly, but we do not guarantee that it is complete, accurate or up to date. Any market price or price-based ratio shown is dated, may be out of date by the time you read it, and is included only to explain concepts.
Statements by company management are reported as statements, with their date and source; they are not our forecasts.