Consumer Services · NSE: NYKAA · BSE: 543384
Nykaa: how the business works
Nykaa sells beauty products and clothes through its apps, websites and 338 stores, including its own brands, and its FY26 revenue was ₹10,022 crore.
Follow Nykaa
Email me when Nykaa's page is updated after results.
We store your email address with Kit, our email provider, which also records when you sign up and whether you open or click our emails. We send a confirmation email first. See our privacy policy.
FSN E-Commerce Ventures Limited · Mumbai, Maharashtra · Founded 2012
Updated for Q2 FY27 · checked
- Revenue from operations, FY26
- ₹10,022 cr
- Profit to shareholders, FY26
- ₹199 cr
- Beauty stores, 30 Sep 2026
- 338 in 111 cities
- Incorporated
- 2012
- Promoter (Nayar family) holding, Sep 2026
- 52.07%
The short version
Nykaa in 5 points
1 · What it sells
Nykaa sells beauty products and clothes through its apps, websites and 338 stores, including its own brands, and its FY26 revenue was ₹10,022 crore.
2 · Who pays it
In FY26 product sales to shoppers and shops were 86.3% of Nykaa's revenue, brands' marketing support payments 9.1%, marketplace fees 3.7% and shipping and other charges 0.9%.
3 · What it keeps from ₹100
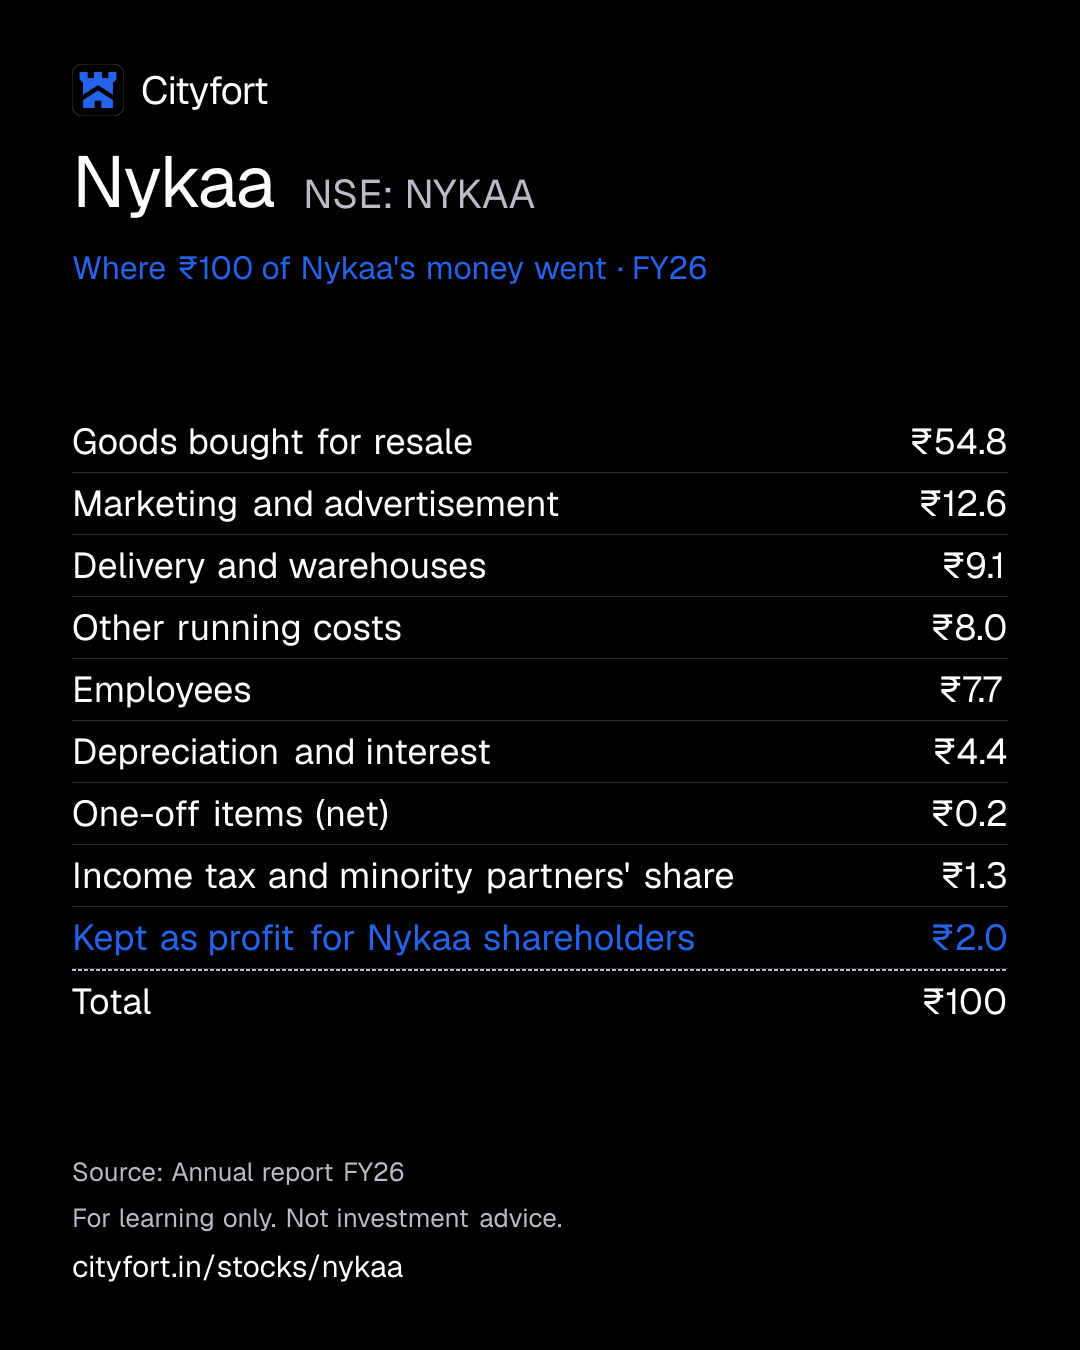
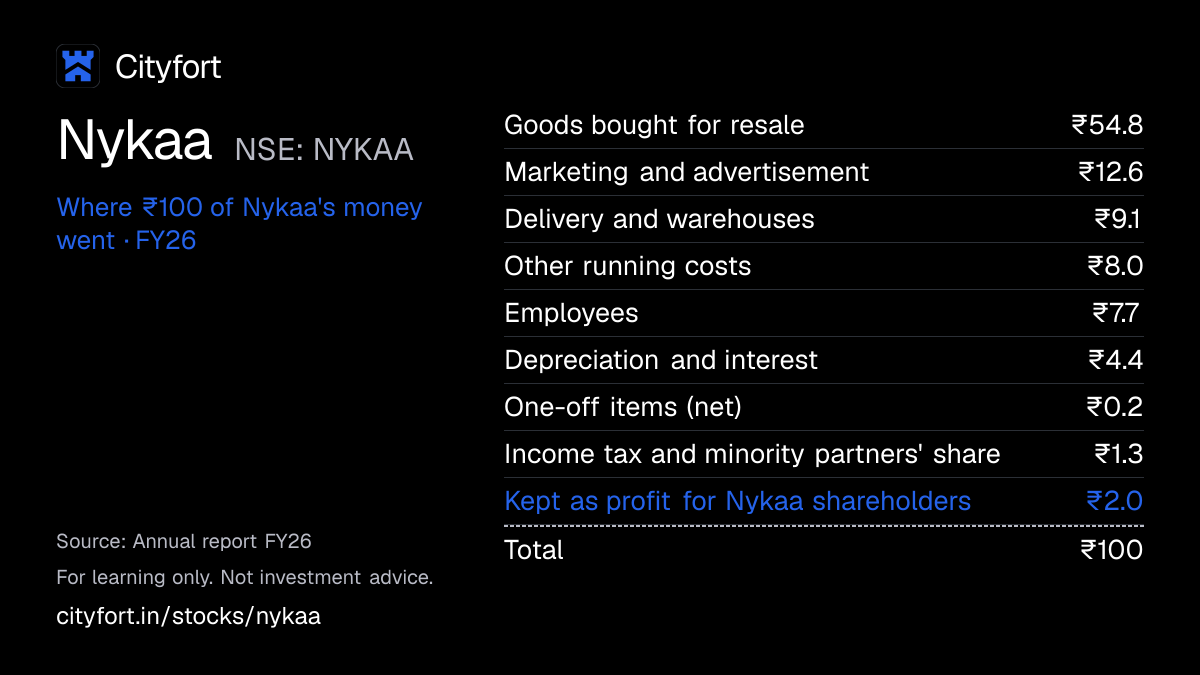
Of every ₹100 that came in during FY26, Nykaa kept ₹2.0 as profit, after ₹54.8 for goods bought for resale, ₹12.6 for marketing and ₹0.2 of net one-off charges.
4 · Where the operating profit comes from
In FY26 Nykaa's Beauty segment made a ₹504.05 crore profit before tax and unallocated costs, while Fashion lost ₹67.45 crore and the Gulf business ₹43.85 crore.
5 · The one thing to watch
In H1 FY27 Nykaa's operating cash flow was an outflow of ₹28.56 crore, with ₹564.74 crore more tied up in inventories, against an inflow of ₹129.29 crore in H1 FY26.
Sources: From Nykaa's FY26 annual report, its Q2 FY27 results and its Q2 FY27 press release · checked
01Where the money goes · FY26
Where does ₹100 of Nykaa's money go?
Nykaa · FY26
Receipt for every ₹100
| Goods bought for resale | ₹54.8 |
|---|---|
| Marketing and advertisement | ₹12.6 |
| Delivery and warehouses | ₹9.1 |
| Other running costs | ₹8.0 |
| Employees | ₹7.7 |
| Depreciation and interest | ₹4.4 |
| One-off items (net) | ₹0.2 |
| Income tax and minority partners' share | ₹1.3 |
| Kept as profit for Nykaa shareholders | ₹2.0 |
| Total | ₹100 |
Each line = amount ÷ total money in × 100. Lines may not add to exactly ₹100 because of rounding.
How this is worked out
Of every ₹100 that came in during FY26: revenue (₹10,022 crore) plus other income (₹33 crore). Cityfort calculation from the FY26 annual report; lines add to 100.1 because of rounding. One-off items were a net ₹17.40 crore charge: a ₹16.36 crore Labour Code cost and a ₹10.38 crore inventory provision, less ₹9.34 crore of arbitration income.
Save this receipt as an image
Embed this receipt or the key numbers
Paste this code into a blog or website to show the card you choose, with a link back to this page.
Each week: the next company due to report results, explained in 5 points.
We'll email you once a week with what changed on Cityfort. Facts only, no tips. Unsubscribe any time.
We store your email address with Kit, our email provider, which also records when you sign up and whether you open or click our emails. We send a confirmation email first. See our privacy policy.
02The business in one line
What does Nykaa do?
Shoppers pay Nykaa for beauty products and clothes, and brands pay it for ads; in FY26 goods bought for resale took ₹54.8 of every ₹100 that came in, and ₹2.0 was profit.
- Sales of products were 86.3% of Nykaa's FY26 revenue; brands' payments for marketing support were 9.1% and marketplace fees 3.7%.
- In Q2 FY27 Nykaa's revenue rose 28.1% to ₹3,006 crore, and profit for shareholders was ₹100.81 crore, up from ₹34.43 crore a year earlier.
03Who pays it
Who pays Nykaa?
Shoppers and small shops buying products
86.3%
of revenue
Shoppers buy on the Nykaa apps, websites and in stores; small retailers buy through Superstore, and other platforms and shops stock its own brands. Share is of FY26 revenue from operations.
Brands paying for marketing support
9.1%
of revenue
Brands pay Nykaa to advertise and promote their products on its platforms. Share is of FY26 revenue.
Sellers paying marketplace fees
3.7%
of revenue
Income from marketplace services: fees from sellers who list their products on Nykaa's platforms. Share is of FY26 revenue.
Shoppers paying shipping and other charges
0.9%
of revenue
Shipping and delivery charges and other operating revenue. Share is of FY26 revenue.
- Shoppers and small shops buying products86.3%
- Brands paying for marketing support9.1%
- Sellers paying marketplace fees3.7%
- Shoppers paying shipping and other charges0.9%
How spread out the customers are
Nykaa does not give revenue by customer; it sells to millions of shoppers (Beauty: 19.7 million annual unique transacting customers in FY26, a company measure). Customers outside India paid 0.5% of FY26 revenue.
04How it makes money
How does Nykaa make money?
Profit is the thin gap between what shoppers and brands pay and the cost of goods, marketing and delivery.
Goods, marketing and delivery took ₹76.5 of every ₹100 that came in during FY26. Brands' payments for ads are a second source of income, beside product sales. EBITDA (profit before interest, tax and wear-and-tear of assets) per ₹100 of revenue rose from ₹4.3 in FY22 to ₹7.3 in FY26.
EBITDA per ₹100 of revenue
₹4.3₹7.3
FY22 to FY26
- Shoppers buy beauty products and clothes on Nykaa's apps, websites and in its stores.
- Nykaa buys the goods from brands first: ₹54.8 of every ₹100 that came in during FY26.
- Brands pay Nykaa to promote their products to those shoppers: ₹912.61 crore in FY26.
- Marketing (₹12.6) and delivery and warehouses (₹9.1) take much of the rest.
- Own brands add to sales: House of Nykaa GMV was ₹3,176 crore in FY26 (company measure).
- What was left after all costs in FY26 was ₹2.0 of every ₹100 as profit.
↺ Step 6 feeds back into step 1.
05Business segments · FY26
Which businesses make up Nykaa?
Beauty
91.2%Online beauty shop, stores, own beauty brands, Superstore (wholesale to shops) and Nykaa Man grooming. FY26 segment profit before tax and unallocated costs: ₹504.05 crore. Segments start in FY25; Nykaa reported one segment until FY24, so this page shows no earlier split.
Revenue ₹9,139 cr
Fashion
8.3%Nykaa Fashion online, own fashion brands, fashion stores, the LBB content platform and Nykaa Man lifestyle. FY26 segment result: a ₹67.45 crore loss.
Revenue ₹832 cr
Others (Gulf)
0.5%Only the international beauty business in the GCC countries. FY26 segment result: a ₹43.85 crore loss.
Revenue ₹51 cr
How the mix changed
- Beauty
- Fashion
- Others (Gulf)
Revenue by segment, FY25 to FY26.
₹ crore
See the numbers
06The numbers · Consolidated · ₹ crore
How has Nykaa done?
Revenue
₹10,022 crFY26
Revenue from operations rose every year, from ₹3,774 crore in FY22 to ₹10,022 crore in FY26, and was ₹3,006 crore in Q2 FY27, 28.1% above Q2 FY26.
₹ crore
See the numbers
Net profit
₹199 crFY26
Profit for shareholders fell from ₹41.1 crore in FY22 to ₹19.3 crore in FY23, then rose each year to ₹199 crore in FY26, after a net ₹17.40 crore of one-off charges.
₹ crore
See the numbers
Net profit for every ₹100 of revenue
₹2.0FY26
EBITDA per ₹100 of revenue rose from ₹4.3 in FY22 to ₹7.3 in FY26, after a ₹16.36 crore Labour Code cost, a ₹10.38 crore inventory provision and ₹9.34 crore of arbitration income, and was ₹8.7 in Q2 FY27.
Net margin: ₹ of net profit per ₹100 of revenue
See the numbers
Free cash flow
₹490 crFY26
Free cash flow went from −₹448 crore in FY22 to ₹490 crore in FY26; in H1 FY27 it was −₹101.9 crore, with ₹564.74 crore more tied up in inventories.
₹ crore · cash from operations minus spending on plants and equipment
See the numbers
See all yearly numbers
EBITDA = profit before interest, tax and wear-and-tear of assets. Financial year runs April to March (March year end). Net profit is the share belonging to the company's owners.
Sources (23)
- Annual Report FY23
- Consolidated financial results Q4 FY22 and FY22 (XBRL)
- Integrated Annual Report FY24
- Consolidated financial results Q4 FY23 and FY23 (XBRL)
- Integrated Annual Report FY25
- Consolidated financial results Q4 FY24 and FY24 (XBRL)
- Integrated Annual Report FY26 (incl. BRSR, standalone boundary)
- Consolidated financial results Q4 FY25 (XBRL)
- Consolidated financial results Q4 FY26 (XBRL)
- Consolidated financial results Q3 FY25 (XBRL)
- Consolidated financial results Q3 FY25 (board outcome PDF, scanned)
- Consolidated financial results Q4 FY25 (board outcome PDF, scanned)
- Consolidated financial results Q1 FY26 (XBRL)
- Consolidated financial results Q1 FY26 (board outcome PDF, scanned)
- Consolidated financial results Q2 FY26 (XBRL)
- Consolidated financial results Q2 FY26 (board outcome PDF, scanned)
- Consolidated financial results Q3 FY26 (XBRL)
- Consolidated financial results Q3 FY26 (board outcome PDF, scanned)
- Consolidated financial results Q4 FY26 (board outcome PDF, scanned)
- Consolidated financial results Q1 FY27 (XBRL)
- Consolidated financial results Q1 FY27 (board outcome PDF, scanned)
- Consolidated financial results Q2 FY27 (XBRL)
- Consolidated financial results Q2 FY27 (board outcome PDF, scanned)
07Who runs it
Who runs Nykaa, and did they deliver?
Falguni Nayar
Founder, Executive Chairperson, Managing Director and CEO · since 2012
FY26 pay ₹16.48 crore, of which ₹15.74 crore came from subsidiary Nykaa E-Retail.
Adwaita Nayar
Executive Director; MD and CEO of Nykaa Fashion, and head of owned brands
Anchit Nayar
Executive Director; MD and CEO of Nykaa E-Retail
P. Ganesh
Chief Financial Officer
Chetan Sharma
Company Secretary and Compliance Officer · since 2025
In the role from 26 Nov 2025.
What they said, and what happened
3 too early to tell
Said on 4 Aug 2026
Management said in the Q1 FY27 call (4 Aug 2026) that Nykaa Now, its fast-delivery service, plans "to be in over 25 cities by the end of FY27".
Too early to tellWhat happened
The Q2 FY27 press release (4 Nov 2026) says Nykaa Now had reached 15 cities, with plans for 25+ by the end of FY27.
Said on 18 Jun 2026
At its Investor Day on 18 Jun 2026, Nykaa said Nykaa Fashion aims by FY30 to grow GMV 3–3.5 times, with potential high single-digit EBITDA margins.
Too early to tellWhat happened
In the Q2 FY27 call, management repeated the guidance as "high single digits by FY '30 and then 10% plus in steady state". Fashion's own-measure EBITDA was ₹1 crore in Q2 FY27.
Said on 4 Nov 2026
Management said in the Q2 FY27 call (4 Nov 2026) that Nykaa plans about 600 beauty stores over the next few years.
Too early to tellWhat happened
Nykaa had 338 stores on 30 Sep 2026.
Sources (7)
- Integrated Annual Report FY26 (incl. BRSR, standalone boundary)
- Red Herring Prospectus (dated 20 Oct 2021)
- Earnings call transcript Q1 FY27 (call 4 Aug 2026)
- Press release Q2 FY27 results
- Press release: Investor Day 2026, FY30 targets
- Earnings call transcript Q2 FY27 (call 4 Nov 2026)
- Investor presentation Q2 FY27
08What could go wrong
What could go wrong for Nykaa?
- Execution
Fashion still makes a loss
The Fashion segment lost ₹67.45 crore in FY26 and ₹7.65 crore in Q2 FY27. Crisil's upgrade triggers include positive fashion EBITDA.
Watch Fashion segment result in each quarter's results.
- Cash and liquidity
Cash tied up in stock
In H1 FY27 operating cash flow was an outflow of ₹28.56 crore, with ₹564.74 crore more tied up in inventories, against an inflow of ₹129.29 crore in H1 FY26. Crisil lists working capital intensity as a weakness.
Watch Inventories and operating cash flow in the FY27 annual results.
- Debt
Borrowings rose in H1 FY27
Borrowings rose from ₹747.21 crore on 31 Mar 2026 to ₹990.65 crore on 30 Sep 2026; in March, ₹637.74 crore were working-capital loans from banks. Lease liabilities were a further ₹528.10 crore in September.
Watch Net debt on 31 Mar 2027, against ₹427 crore a year earlier.
- Competition
Competition and discounts
Crisil says Nykaa faces intense competition from offline stores and other e-commerce sites, which requires periodic discounts. Marketing took ₹12.6 of every ₹100 that came in during FY26.
Watch Marketing and advertisement cost in each annual report (₹1,266.02 crore in FY26, ₹994.82 crore in FY25).
- Execution
Superstore growth and profit unclear
Superstore GMV grew 15% in Q2 FY27 to ₹328 crore, below ₹336 crore in Q1 FY27 (company measure). Its revenue and profit are not disclosed; Crisil named B2B distribution losses as a weakness.
Watch Superstore GMV and retailer count in each quarterly deck.
- Execution
Losses in the Gulf business
The Others segment, the beauty business in the GCC countries, lost ₹43.85 crore in FY26 on revenue of ₹50.70 crore.
Watch Others segment result in each quarter's results (₹10.70 crore loss in Q2 FY27).
- Governance
Founder family runs the company
The Nayar family holds 52.07% through family trusts, and Falguni, Adwaita and Anchit Nayar are all executive directors.
Watch Promoter holding and pledges in each shareholding pattern (no pledges to Sep 2026).
Sources (8)
- Integrated Annual Report FY26 (incl. BRSR, standalone boundary)
- Consolidated financial results Q2 FY27 (XBRL)
- CRISIL Ratings rationale: Crisil A/Stable reaffirmed, bank facilities Rs 178 crore
- Consolidated financial results Q2 FY27 (board outcome PDF, scanned)
- Intimation: CRISIL reaffirms Crisil A/Stable (8 May 2026)
- Investor presentation Q2 FY27
- Investor presentation Q1 FY27
- Shareholding pattern Sep 2026 (XBRL)
09Supporters and critics
What do supporters and critics point to?
What supporters point to
- Revenue from operations rose every year, from ₹3,774 crore in FY22 to ₹10,022 crore in FY26.
- EBITDA per ₹100 of revenue rose from ₹4.3 in FY22 to ₹7.3 in FY26, and was ₹8.7 in Q2 FY27.
- Free cash flow went from −₹448 crore in FY22 to ₹490 crore in FY26.
- House of Nykaa GMV was ₹3,176 crore in FY26, up 49% (company measure).
- Crisil reaffirmed its A/Stable rating on 8 May 2026.
What critics point to
- Nykaa kept ₹2.0 as profit of every ₹100 that came in during FY26.
- In FY26 the Fashion segment lost ₹67.45 crore and the Gulf business ₹43.85 crore.
- In H1 FY27 operating cash flow was an outflow of ₹28.56 crore, with ₹564.74 crore more tied up in inventories.
- Borrowings rose to ₹990.65 crore on 30 Sep 2026, from ₹747.21 crore on 31 Mar 2026.
- Superstore's revenue and profit are not disclosed; only its GMV is.
10What to watch next
What should you watch next at Nykaa?
Next event
Q3 FY27 results (date not announced)
Date not announced yet.
Fashion profit
Fashion's segment result was a ₹7.65 crore loss in Q2 FY27, against a ₹12.01 crore loss in Q2 FY26 that included ₹9.34 crore of arbitration income.
Stock and cash
Inventories were ₹2,209.66 crore on 30 Sep 2026, against ₹1,642.16 crore on 31 Mar 2026; H1 FY27 operating cash flow was an outflow of ₹28.56 crore.
Q3 FY27 results
No board-meeting date had been filed by 12 Nov 2026; Q3 FY26 results came on 5 Feb 2026. Q3 FY26 included a ₹16.36 crore one-off Labour Code cost.
11Key facts
Key facts about Nykaa
- What does Nykaa do?
- Nykaa, the brand of FSN E-Commerce Ventures, sells beauty and personal-care products and clothes through its apps, websites and 338 beauty stores (30 Sep 2026). Nykaa also owns brands such as Dot & Key, Kay Beauty and Nykd, and sells beauty products wholesale to small shops through its Superstore app. Nykaa's FY26 revenue from operations was ₹10,022 crore.
- How does Nykaa make money?
- Nykaa makes most of its money by buying products from brands and reselling them: sales of products were 86.3% of Nykaa's FY26 revenue. Brands paying Nykaa for marketing support (ads on its platforms) gave 9.1%, and marketplace fees 3.7%. Of every ₹100 that came in during FY26, Nykaa kept ₹2.0 as profit.
- Who are Nykaa's customers?
- Nykaa's customers are shoppers, small retailers and brands. Nykaa's Beauty business had 19.7 million annual unique transacting customers in FY26 and its Fashion business 4.3 million, both company measures. Superstore by Nykaa had 493,000 onboarded retailers at the end of FY26. Customers outside India paid 0.5% of Nykaa's FY26 revenue.
- How big is Nykaa?
- In FY26 Nykaa's consolidated revenue from operations was ₹10,022 crore, up from ₹7,950 crore in FY25, and its profit for shareholders was ₹199 crore. Nykaa had 338 beauty stores in 111 cities on 30 Sep 2026.
- Who owns Nykaa?
- On 30 Sep 2026 Nykaa's promoters, the Nayar family and its family trusts, held 52.07% of FSN E-Commerce Ventures. Foreign portfolio investors held 15.65%, Indian institutions 22.35% and individuals and others 9.93%. No promoter shares were pledged.
- Does Nykaa have debt?
- On 31 Mar 2026 Nykaa had ₹747 crore of borrowings, ₹637.74 crore of them working-capital loans from banks, against ₹320 crore of cash and bank balances. On 30 Sep 2026 Nykaa's borrowings were ₹990.65 crore and its cash and bank balances ₹348.83 crore. Lease liabilities for stores and warehouses are extra: ₹528.10 crore on 30 Sep 2026.
- Does Nykaa pay a dividend?
- Nykaa has not declared a dividend since it listed in November 2021, its FY26 annual report says. In November 2022 Nykaa issued 5 bonus shares for every share held.
- What is Superstore by Nykaa?
- Superstore by Nykaa is an app through which Nykaa sells beauty products wholesale to small retailers. Nykaa reports it inside its Beauty segment and gives only its GMV (the value of orders, a company measure): ₹1,187 crore in FY26 and ₹328 crore in Q2 FY27. Nykaa does not disclose Superstore's revenue or profit separately.
- What were Nykaa's Q2 FY27 results?
- In Q2 FY27 (July–September 2026) Nykaa's revenue from operations was ₹3,006 crore, up 28.1% from ₹2,346 crore a year earlier. Nykaa's profit for shareholders was ₹100.81 crore, against ₹34.43 crore in Q2 FY26.
Sources (9)
- Integrated Annual Report FY26 (incl. BRSR, standalone boundary)
- Press release Q2 FY27 results
- Investor presentation Q4 FY26
- Shareholding pattern Sep 2026 (XBRL)
- Consolidated financial results Q2 FY27 (XBRL)
- Annual Report FY22
- Allotment of 5:1 bonus shares (12 Nov 2022)
- Investor presentation Q2 FY27
- Consolidated financial results Q2 FY26 (XBRL)
Terms on this page
- Capital expenditure (capex)
- Credit rating
- EBITDA
- FII and DII holding
- Free cash flow
- Market capitalisation
- Net debt
- Net profit
- Operating margin
- Promoter holding
Each explains the term in plain English, with the same number from other companies on Cityfort.
Go deeper
More detail from the same filings. Open any section.
12What it sells
12What it sells
What does Nykaa sell?
Nykaa beauty: app, website and stores
Make-up, skincare, hair care and fragrance from many brands. Beauty GMV (value of orders, a company measure) was ₹14,954 crore in FY26; there were 338 stores on 30 Sep 2026.
House of Nykaa (own brands)
Brands Nykaa owns, such as Dot & Key, Kay Beauty, Nykaa Cosmetics and Nykd. Their FY26 GMV was ₹3,176 crore, up 49% (company measure); 30% of own-brand beauty GMV came through other platforms.
Nykaa Fashion
An online shop for clothes, footwear and accessories, with marketplace sellers and own fashion brands. FY26 Fashion revenue was ₹832 crore on GMV of ₹4,954 crore (company measure).
Superstore by Nykaa
An app that sells beauty products wholesale to small shops. FY26 GMV was ₹1,187 crore (company measure) with 493,000 onboarded retailers; its revenue is not disclosed separately.
Marketing support for brands
Brands pay Nykaa to promote their products on its platforms. This marketing support revenue was ₹912.61 crore in FY26.
Gulf business
Nykaa's beauty business in the GCC countries, reported as its Others segment. FY26 revenue was ₹50.70 crore.
What it does
- Does: Buys products from brands and resells them: sales of products were 86.3% of FY26 revenue
- Does: Earns fees from brands for ads on its platforms: ₹912.61 crore in FY26
- Does: Runs 338 beauty stores in 111 cities (30 Sep 2026)
- Does: Sells its own brands on other platforms and through its stores and Superstore
What it does not do
- Does not: Count GMV as revenue: FY26 GMV was ₹19,963 crore and revenue ₹10,022 crore; GMV includes taxes and is counted before discounts, cancellations and returns (company definition)
- Does not: Disclose Superstore's revenue or profit: only its GMV, a company measure
- Does not: Pay a dividend: none has been declared since listing in 2021
- Does not: Earn much outside India: 0.5% of FY26 revenue
13How the money flows
13How the money flows · FY26
How does money flow through Nykaa?
Money in
- Revenue from operations₹10,022 cr
- Other income₹33 cr
The company
Nykaa
₹10,055 cr came in
Money out
- Goods bought for resale (incl. materials, after stock build-up)₹5,507 cr
- Marketing and advertisement₹1,266 cr
- Delivery, warehouses and other running costs₹1,726 cr
- Employee costs₹772 cr
- Depreciation, interest and one-off items (net)₹455 cr
- Income tax and minority partners' share₹131 cr
- Net profit for Nykaa shareholders₹199 cr
- In FY26 Nykaa's sales brought in ₹10,022 crore of revenue, plus ₹33 crore of other income.
- Goods bought from brands for resale took ₹5,507 crore, after ₹227 crore more went into stock.
- Marketing took ₹1,266 crore; delivery, warehouses and other running costs ₹1,726 crore; employees ₹772 crore.
- Depreciation, interest and net one-off items took ₹455 crore, and tax and minority partners ₹131 crore.
- What was left for Nykaa's shareholders was ₹199 crore of profit.
14What it needs to run
14What it needs to run
What does Nykaa need to run?
Brands that supply it
Nykaa resells other companies' products. It launched over 330 brands in the year to Q2 FY27; Crisil cites its long relationships with brand owners.
Stock on hand
Nykaa buys goods before it sells them. Inventories were ₹1,642.16 crore on 31 Mar 2026 and ₹2,209.66 crore on 30 Sep 2026.
Warehouses and stores
The parent company alone listed 31 warehouses and 37 rapid stores in its FY26 BRSR. The group had 338 beauty stores on 30 Sep 2026.
Delivery
Freight cost ₹650.67 crore in FY26, and warehouse staff, packing and operations a further ₹267.22 crore.
People and technology
The parent company had 2,921 employees and 8,567 other workers in FY26 (BRSR). Group web and technology costs were ₹180.57 crore.
15Where it sells
15Where it sells · FY26
Where does Nykaa sell?
- India99.5%
- Outside India0.5%
16Competitors and what protects it
16Competitors and what protects it
Who does Nykaa compete with?
Amazon
Named in Nykaa's 2021 prospectus as a horizontal online marketplace (one that sells many categories) competing with Nykaa.
Flipkart
Named in Nykaa's 2021 prospectus as a horizontal online marketplace competing with Nykaa.
Myntra
Named in Nykaa's 2021 prospectus, with Purplle and MyGlamm, as vertical online platforms Nykaa competes with in beauty and fashion.
Purplle
Named in Nykaa's 2021 prospectus, with Myntra, Purplle and MyGlamm, as vertical online platforms Nykaa competes with in beauty and fashion.
MyGlamm
Named in Nykaa's 2021 prospectus, with Myntra, Purplle and MyGlamm, as vertical online platforms Nykaa competes with in beauty and fashion.
What protects the business
Each strength is scored 1 (weak) to 5 (strong) for the business, with the reason. It is not a rating of the share.
- Beauty customer base4 of 5
Crisil cites an established market position in online beauty products. Beauty annual unique transacting customers rose from 15.8 million in FY25 to 19.7 million in FY26 (company measure).
- Own brands3 of 5
House of Nykaa GMV was ₹3,176 crore in FY26, up 49% (company measure). Dot & Key alone had ₹1,790 crore of GMV and also sells on other platforms.
- Store network3 of 5
Nykaa ran 338 beauty stores in 111 cities on 30 Sep 2026, up from 313 stores in 99 cities on 31 Mar 2026.
- Brand relationships3 of 5
Crisil cites long relationships with brand owners. Marketing support revenue from brands was ₹912.61 crore in FY26, against ₹733.33 crore in FY25.
Weak spot
Fashion and the Gulf business still lose money
In FY26 the Fashion segment lost ₹67.45 crore and the Gulf business ₹43.85 crore. Crisil lists the fashion and distribution businesses as yet to stabilise.
Sources (8)
- Red Herring Prospectus (dated 20 Oct 2021)
- CRISIL Ratings rationale: Crisil A/Stable reaffirmed, bank facilities Rs 178 crore
- Integrated Annual Report FY26 (incl. BRSR, standalone boundary)
- Investor presentation Q4 FY26
- Earnings call transcript Q4 FY26 (call 21 May 2026)
- Press release Q2 FY27 results
- Press release Q4 FY26 and FY26 results
- Intimation: CRISIL reaffirms Crisil A/Stable (8 May 2026)
17Where growth could come from
17Where growth could come from
Where could Nykaa's growth come from?
At its Investor Day on 18 Jun 2026, Nykaa said it aims by FY30 to grow revenue 2–3 times and EBITDA 4–5 times, with a "low to mid-teens EBITDA margin". These are the company's targets, not Cityfort's forecasts.
Own brands (House of Nykaa)
WorkingGMV ₹3,176 crore in FY26, +49% (company measure)
Own-brand beauty GMV was ₹2,788 crore in FY26, against ₹1,695 crore in FY25. In FY26, 30% of it came through other platforms and 16% through Nykaa's B2B channel, including Superstore.
Status: Working, on track against what the company said.
More beauty stores
Working338 stores on 30 Sep 2026
Nykaa added 14 stores in Q2 FY27 and 76 in FY26. Management said in the Q2 FY27 call (4 Nov 2026) that it plans about 600 stores over the next few years.
Status: Working, on track against what the company said.
Fashion reaching break-even
MixedCompany EBITDA ₹1 crore, Q2 FY27
Fashion's own-measure EBITDA moved from a ₹12 crore loss in Q2 FY26 to ₹1 crore in Q2 FY27. Its reported segment result was still a ₹7.65 crore loss.
Status: Mixed, partly on track.
Superstore (beauty wholesale to shops)
MixedGMV ₹328 crore, Q2 FY27, +15% (company measure)
Superstore GMV was ₹285 crore in Q2 FY26 and ₹336 crore in Q1 FY27. The Q2 FY27 deck cites GST-led cuts in maximum retail prices; revenue is not disclosed.
Status: Mixed, partly on track.
Nykaa Now (delivery within an hour)
New15 cities by Q2 FY27
Nykaa Now delivers beauty orders within 30–60 minutes. It was in 13 cities at the Q1 FY27 call and 15 at the Q2 FY27 results.
Status: New, recently announced.
Gulf beauty business
EarlyRevenue ₹50.70 crore, FY26
Revenue rose from ₹23.96 crore in FY25, while the segment loss widened from ₹29.09 crore to ₹43.85 crore.
Status: Early, too early to judge.
Status compares progress with what the company itself said it would do: Working = on track against what the company said; Mixed = partly on track; Behind = behind the company's own plan; New = recently announced; Early = too early to judge.
Sources (11)
- Press release: Investor Day 2026, FY30 targets
- Investor presentation Q4 FY26
- Press release Q2 FY27 results
- Press release Q4 FY26 and FY26 results
- Earnings call transcript Q2 FY27 (call 4 Nov 2026)
- Investor presentation Q2 FY27
- Consolidated financial results Q2 FY27 (XBRL)
- Investor presentation Q1 FY27
- Earnings call transcript Q1 FY27 (call 4 Aug 2026)
- Integrated Annual Report FY26 (incl. BRSR, standalone boundary)
- Integrated Annual Report FY25
18Financial strength and debt
18Financial strength · 31 Mar 2026
How much debt does Nykaa have?
- Total debt₹747 cr
- Cash and investments₹320 cr
- Net debt (debt minus cash)₹427 cr
- Net worth (shareholders' money)₹1,438 cr
- Debt to equity
- 0.5×
- ₹ of debt for every ₹1 of shareholders' money
- Net debt = borrowings minus cash and other bank balances, excluding lease liabilities: Cityfort calculation from the FY26 annual report. The company's own FY26 net debt figure, which also nets longer-term deposits, is ₹329 crore.
- On 30 Sep 2026 borrowings were ₹990.65 crore and cash and bank balances ₹348.83 crore: net debt of ₹641.8 crore (Cityfort calculation from the Q2 FY27 results).
- Lease liabilities for stores and warehouses were a further ₹490.60 crore on 31 Mar 2026 and ₹528.10 crore on 30 Sep 2026.
- Debt to equity uses total equity of ₹1,502.10 crore, including minority partners; net worth shown is the shareholders' share, ₹1,438 crore.
- Inventories rose from ₹1,642.16 crore on 31 Mar 2026 to ₹2,209.66 crore on 30 Sep 2026.
19Who owns it
19Who owns it · Q2 FY27
Who owns Nykaa?
- Promoters (founders or parent company)52.1%
- Foreign institutions (FII)15.7%
- Indian institutions (DII)22.4%
- Public and others9.9%
Promoter pledge
No promoter shares were pledged in Q2 FY27.
How ownership changed
* Pledged = share of the promoters' own holding reported as pledged. In older filings this can include shares “otherwise encumbered”; the governance flags say when.
Sources (13)
- Shareholding pattern Sep 2026 (XBRL)
- Shareholding pattern Jun 2026 (XBRL)
- Shareholding pattern Mar 2026 (XBRL)
- Shareholding pattern Dec 2025 (XBRL)
- Shareholding pattern Sep 2025 (XBRL)
- Shareholding pattern Jun 2025 (XBRL)
- Shareholding pattern Mar 2025 (XBRL)
- Shareholding pattern Dec 2024 (XBRL)
- Shareholding pattern Sep 2024 (XBRL)
- Shareholding pattern Jun 2024 (XBRL)
- Shareholding pattern Mar 2024 (XBRL)
- Shareholding pattern Dec 2023 (XBRL)
- SAST Reg 31(4) declaration by promoters: no encumbrance in FY26 (dated 1 Apr 2026)
20What it does with profit
20What it does with profit
What does Nykaa do with its profit?
No buybacks or fund raises in the period covered.
21Governance signals
21Governance signals
What do Nykaa's governance filings show?
- Auditor
- Walker Chandiok & Co LLP, since 2026
- Auditor changes
- 23 Jul 2026: S.R. Batliboi & Associates LLP → Walker Chandiok & Co LLP (The board proposed Walker Chandiok for five years from the 14th AGM, subject to shareholders' approval. Batliboi's term ran to that AGM, "marking the completion of their term"; Batliboi signed the FY26 accounts.)
- Audit qualifications
- None reported
- Related-party dealings
- The FY26 board report says the audit committee reviewed and approved all related-party transactions. The Nayar family holds its 52.07% through family trusts. Falguni Nayar's FY26 pay was ₹16.48 crore, of which ₹15.74 crore came from subsidiary Nykaa E-Retail; Adwaita and Anchit Nayar are also paid by subsidiaries they run.
- Credit rating
- Crisil A (long-term bank facilities of ₹178 crore) (outlook Stable), 8 May 2026
A credit rating describes the company's ability to repay debt. It is not a rating of the share.
Flags to know about
pledge · 30 Sep 2026
No promoter shares pledged
Shareholding patterns from Dec 2023 to Sep 2026 show no promoter shares pledged or encumbered. A promoter trust declared no encumbrance for FY26.
auditor · 23 Jul 2026
Auditor rotation in 2026
S.R. Batliboi & Associates' term ended at the 14th AGM; Walker Chandiok & Co LLP was appointed for five years and reviewed the Q2 FY27 results. The FY26 audit opinion was unmodified.
disclosure
Segments only from FY25; Superstore revenue not disclosed
Nykaa reported a single segment until FY24 and Beauty, Fashion and Others from FY25. Superstore sits inside Beauty and is reported only by GMV, a company measure.
regulatory · 25 Sep 2024
Exchange fines in 2024
On 25 Sep 2024 NSE and BSE each fined the company ₹29,500 (including GST) for alleged delay in complying with Regulation 44(5) of the Listing Regulations. The company said it was seeking a waiver and saw no material impact.
other · 31 Mar 2026
Inventory misappropriated at a warehouse
In FY26 Nykaa made a ₹10.38 crore provision for misappropriation of inventory at one of a subsidiary's warehouses. The subsidiary has filed an insurance claim, the FY26 annual report says.
related party · 31 Mar 2026
Family members paid by subsidiaries
Falguni Nayar received ₹15.74 crore of her ₹16.48 crore FY26 pay from subsidiary Nykaa E-Retail. Adwaita Nayar and Anchit Nayar also run, and are paid by, subsidiaries.
Sources (12)
- Board outcome: Walker Chandiok & Co LLP proposed as statutory auditor (23 Jul 2026)
- Consolidated financial results Q2 FY27 (board outcome PDF, scanned)
- Integrated Annual Report FY26 (incl. BRSR, standalone boundary)
- Shareholding pattern Sep 2026 (XBRL)
- Intimation: CRISIL reaffirms Crisil A/Stable (8 May 2026)
- CRISIL Ratings rationale: Crisil A/Stable reaffirmed, bank facilities Rs 178 crore
- Shareholding pattern Dec 2023 (XBRL)
- SAST Reg 31(4) declaration by promoters: no encumbrance in FY26 (dated 1 Apr 2026)
- Integrated Annual Report FY25
- Consolidated financial results Q4 FY24 and FY24 (XBRL)
- Investor presentation Q4 FY26
- Reg 30: NSE/BSE fine of Rs 29,500 each for alleged delay under Reg 44(5) (26 Sep 2024)
22What the market paid
22What the market paid · price as of 11 Nov 2026
What did the market pay for Nykaa on 11 Nov 2026?
Price as of 11 Nov 2026 (shown for education; prices change daily).
Price as of 11 Nov 2026: ₹356.80, the NSE closing price. Cityfort calculation: market value = that price × 286.43 crore shares (30 Sep 2026 shareholding pattern) = ₹102,198 crore. P/E (how many rupees the market paid for each rupee of yearly profit per share) is 318.6 on the last four quarters' earnings per share of ₹1.12 (Q3 FY26 to Q2 FY27). P/B of 61.8 = market value ÷ shareholders' equity of ₹1,654.92 crore on 30 Sep 2026. Nykaa pays no dividend.
- Share price
- ₹356.80
- Market value (market cap)
- ₹102,198 cr
- P/E
- 318.6×
- P/B
- 61.8×
Source: NSE CM bhavcopy 11 Nov 2026 (NYKAA EQ close); Shareholding pattern Sep 2026 (XBRL); Consolidated financial results Q2 FY27 (XBRL) and 4 more
Sources (7)
- NSE CM bhavcopy 11 Nov 2026 (NYKAA EQ close)
- Shareholding pattern Sep 2026 (XBRL)
- Consolidated financial results Q2 FY27 (XBRL)
- Consolidated financial results Q1 FY27 (XBRL)
- Consolidated financial results Q4 FY26 (XBRL)
- Consolidated financial results Q3 FY26 (XBRL)
- Integrated Annual Report FY26 (incl. BRSR, standalone boundary)
23How it got here
23How it got here
How did Nykaa get here?
2012
Milestone
Incorporated
FSN E-Commerce Ventures was incorporated in Mumbai on 24 Apr 2012, its prospectus says.
2014
Business-model change
First store
Nykaa opened its first physical store, at Terminal 3 of Delhi airport, adding stores to online sales.
2015
Milestone
First own brand
Nykaa launched its own make-up brand, Nykaa Cosmetics.
2018
Business-model change
Nykaa Fashion launched
Nykaa Fashion started as a curated online marketplace for clothes and accessories.
2021
Milestone
Dot & Key bought; shares listed
Nykaa acquired skincare brand Dot & Key. Its shares listed on NSE and BSE on 10 Nov 2021 after an IPO at ₹1,125 a share.
2022
Milestone
5-for-1 bonus issue
Nykaa issued 5 bonus shares for each share held; 2,373,563,075 bonus shares were allotted on 12 Nov 2022.
2025
Milestone
Segments reported; e-B2B business moved
The FY25 annual report split results into Beauty, Fashion and Others for the first time. In May 2025 the NCLT approved moving FSN Distribution's e-B2B business into Nykaa E-Retail, both wholly owned subsidiaries.
2026
Milestone
Revenue passes ₹10,000 crore; FY30 targets
FY26 revenue was ₹10,022 crore. At its Investor Day on 18 Jun 2026 Nykaa set FY30 targets for revenue and EBITDA growth.
2026
Milestone
Two brand deals
Nykaa completed a 51% purchase of Aminu Wellness for up to ₹32 crore in Sep 2026. In Nov 2026 its board approved buying 82% of Simply Nam Beauty for up to ₹33 crore.
Sources (10)
- Red Herring Prospectus (dated 20 Oct 2021)
- Annual Report FY22
- Board outcome: 5:1 bonus issue recommended (3 Oct 2022)
- Allotment of 5:1 bonus shares (12 Nov 2022)
- Integrated Annual Report FY25
- NCLT approves demerger of FSN Distribution into Nykaa E-Retail (10 May 2025)
- Integrated Annual Report FY26 (incl. BRSR, standalone boundary)
- Press release: Investor Day 2026, FY30 targets
- Completion of 51% acquisition of Aminu Wellness (24 Sep 2026)
- Consolidated financial results Q2 FY27 (board outcome PDF, scanned)
24Sources and changes
Where every number on this page comes from
Sources (58 documents)
- S1Integrated Annual Report FY26 (incl. BRSR, standalone boundary) · FSN E-Commerce Ventures Ltd (filed with NSE/BSE) · Tier 1: company or exchange filing · 1 Aug 2026
- S2Integrated Annual Report FY25 · FSN E-Commerce Ventures Ltd (filed with NSE/BSE) · Tier 1: company or exchange filing · 2 Aug 2025
- S3Integrated Annual Report FY24 · FSN E-Commerce Ventures Ltd (filed with NSE/BSE) · Tier 1: company or exchange filing · 26 Aug 2024
- S4Annual Report FY23 · FSN E-Commerce Ventures Ltd (filed with NSE/BSE) · Tier 1: company or exchange filing · 24 Aug 2023
- S5Annual Report FY22 · FSN E-Commerce Ventures Ltd (filed with NSE/BSE) · Tier 1: company or exchange filing · 5 Sep 2022
- S6Consolidated financial results Q2 FY27 (board outcome PDF, scanned) · FSN E-Commerce Ventures Ltd (filed with NSE/BSE) · Tier 1: company or exchange filing · 4 Nov 2026
- S7Consolidated financial results Q2 FY27 (XBRL) · FSN E-Commerce Ventures Ltd (filed with NSE/BSE) · Tier 1: company or exchange filing · 4 Nov 2026
- S8Consolidated financial results Q1 FY27 (board outcome PDF, scanned) · FSN E-Commerce Ventures Ltd (filed with NSE/BSE) · Tier 1: company or exchange filing · 4 Aug 2026
- S9Consolidated financial results Q1 FY27 (XBRL) · FSN E-Commerce Ventures Ltd (filed with NSE/BSE) · Tier 1: company or exchange filing · 4 Aug 2026
- S10Consolidated financial results Q4 FY26 (board outcome PDF, scanned) · FSN E-Commerce Ventures Ltd (filed with NSE/BSE) · Tier 1: company or exchange filing · 21 May 2026
- S11Consolidated financial results Q4 FY26 (XBRL) · FSN E-Commerce Ventures Ltd (filed with NSE/BSE) · Tier 1: company or exchange filing · 21 May 2026
- S12Consolidated financial results Q3 FY26 (board outcome PDF, scanned) · FSN E-Commerce Ventures Ltd (filed with NSE/BSE) · Tier 1: company or exchange filing · 5 Feb 2026
- S13Consolidated financial results Q3 FY26 (XBRL) · FSN E-Commerce Ventures Ltd (filed with NSE/BSE) · Tier 1: company or exchange filing · 5 Feb 2026
- S14Consolidated financial results Q2 FY26 (board outcome PDF, scanned) · FSN E-Commerce Ventures Ltd (filed with NSE/BSE) · Tier 1: company or exchange filing · 7 Nov 2025
- S15Consolidated financial results Q2 FY26 (XBRL) · FSN E-Commerce Ventures Ltd (filed with NSE/BSE) · Tier 1: company or exchange filing · 7 Nov 2025
- S16Consolidated financial results Q1 FY26 (board outcome PDF, scanned) · FSN E-Commerce Ventures Ltd (filed with NSE/BSE) · Tier 1: company or exchange filing · 12 Aug 2025
- S17Consolidated financial results Q1 FY26 (XBRL) · FSN E-Commerce Ventures Ltd (filed with NSE/BSE) · Tier 1: company or exchange filing · 12 Aug 2025
- S18Consolidated financial results Q4 FY25 (board outcome PDF, scanned) · FSN E-Commerce Ventures Ltd (filed with NSE/BSE) · Tier 1: company or exchange filing · 30 May 2025
- S19Consolidated financial results Q4 FY25 (XBRL) · FSN E-Commerce Ventures Ltd (filed with NSE/BSE) · Tier 1: company or exchange filing · 30 May 2025
- S20Consolidated financial results Q3 FY25 (board outcome PDF, scanned) · FSN E-Commerce Ventures Ltd (filed with NSE/BSE) · Tier 1: company or exchange filing · 10 Feb 2025
- S21Consolidated financial results Q3 FY25 (XBRL) · FSN E-Commerce Ventures Ltd (filed with NSE/BSE) · Tier 1: company or exchange filing · 10 Feb 2025
- S22Consolidated financial results Q4 FY24 and FY24 (XBRL) · FSN E-Commerce Ventures Ltd (filed with NSE/BSE) · Tier 1: company or exchange filing · 22 May 2024
- S23Consolidated financial results Q4 FY23 and FY23 (XBRL) · FSN E-Commerce Ventures Ltd (filed with NSE/BSE) · Tier 1: company or exchange filing · 24 May 2023
- S24Consolidated financial results Q4 FY22 and FY22 (XBRL) · FSN E-Commerce Ventures Ltd (filed with NSE/BSE) · Tier 1: company or exchange filing · 27 May 2022
- S25Investor presentation Q2 FY27 · FSN E-Commerce Ventures Ltd (filed with NSE/BSE) · Tier 1: company or exchange filing · 4 Nov 2026
- S26Investor presentation Q1 FY27 · FSN E-Commerce Ventures Ltd (filed with NSE/BSE) · Tier 1: company or exchange filing · 4 Aug 2026
- S27Investor presentation Q4 FY26 · FSN E-Commerce Ventures Ltd (filed with NSE/BSE) · Tier 1: company or exchange filing · 21 May 2026
- S29Press release Q2 FY27 results · FSN E-Commerce Ventures Ltd (filed with NSE/BSE) · Tier 1: company or exchange filing · 4 Nov 2026
- S31Press release Q4 FY26 and FY26 results · FSN E-Commerce Ventures Ltd (filed with NSE/BSE) · Tier 1: company or exchange filing · 21 May 2026
- S32Press release: Investor Day 2026, FY30 targets · FSN E-Commerce Ventures Ltd (filed with NSE/BSE) · Tier 1: company or exchange filing · 18 Jun 2026
- S33Earnings call transcript Q2 FY27 (call 4 Nov 2026) · FSN E-Commerce Ventures Ltd (filed with NSE/BSE) · Tier 1: company or exchange filing · 6 Nov 2026
- S34Earnings call transcript Q1 FY27 (call 4 Aug 2026) · FSN E-Commerce Ventures Ltd (filed with NSE/BSE) · Tier 1: company or exchange filing · 7 Aug 2026
- S35Earnings call transcript Q4 FY26 (call 21 May 2026) · FSN E-Commerce Ventures Ltd (filed with NSE/BSE) · Tier 1: company or exchange filing · 26 May 2026
- S37Shareholding pattern Sep 2026 (XBRL) · FSN E-Commerce Ventures Ltd (filed with NSE/BSE) · Tier 1: company or exchange filing · 20 Oct 2026
- S38Shareholding pattern Jun 2026 (XBRL) · FSN E-Commerce Ventures Ltd (filed with NSE/BSE) · Tier 1: company or exchange filing · 20 Jul 2026
- S39Shareholding pattern Mar 2026 (XBRL) · FSN E-Commerce Ventures Ltd (filed with NSE/BSE) · Tier 1: company or exchange filing · 17 Apr 2026
- S40Shareholding pattern Dec 2025 (XBRL) · FSN E-Commerce Ventures Ltd (filed with NSE/BSE) · Tier 1: company or exchange filing · 20 Jan 2026
- S41Shareholding pattern Sep 2025 (XBRL) · FSN E-Commerce Ventures Ltd (filed with NSE/BSE) · Tier 1: company or exchange filing · 17 Oct 2025
- S42Shareholding pattern Jun 2025 (XBRL) · FSN E-Commerce Ventures Ltd (filed with NSE/BSE) · Tier 1: company or exchange filing · 21 Jul 2025
- S43Shareholding pattern Mar 2025 (XBRL) · FSN E-Commerce Ventures Ltd (filed with NSE/BSE) · Tier 1: company or exchange filing · 10 Apr 2025
- S44Shareholding pattern Dec 2024 (XBRL) · FSN E-Commerce Ventures Ltd (filed with NSE/BSE) · Tier 1: company or exchange filing · 21 Jan 2025
- S45Shareholding pattern Sep 2024 (XBRL) · FSN E-Commerce Ventures Ltd (filed with NSE/BSE) · Tier 1: company or exchange filing · 4 Oct 2024
- S46Shareholding pattern Jun 2024 (XBRL) · FSN E-Commerce Ventures Ltd (filed with NSE/BSE) · Tier 1: company or exchange filing · 16 Jul 2024
- S47Shareholding pattern Mar 2024 (XBRL) · FSN E-Commerce Ventures Ltd (filed with NSE/BSE) · Tier 1: company or exchange filing · 16 Apr 2024
- S48Shareholding pattern Dec 2023 (XBRL) · FSN E-Commerce Ventures Ltd (filed with NSE/BSE) · Tier 1: company or exchange filing · 15 Jan 2024
- S49CRISIL Ratings rationale: Crisil A/Stable reaffirmed, bank facilities Rs 178 crore · CRISIL Ratings Ltd · Tier 2: rating agency or regulator · 9 Apr 2025
- S50Intimation: CRISIL reaffirms Crisil A/Stable (8 May 2026) · FSN E-Commerce Ventures Ltd (filed with NSE/BSE) · Tier 1: company or exchange filing · 8 May 2026
- S51Red Herring Prospectus (dated 20 Oct 2021) · FSN E-Commerce Ventures Ltd (filed with SEBI/RoC) · Tier 1: company or exchange filing · 22 Oct 2021
- S52Board outcome: 5:1 bonus issue recommended (3 Oct 2022) · FSN E-Commerce Ventures Ltd (filed with NSE/BSE) · Tier 1: company or exchange filing · 3 Oct 2022
- S53Allotment of 5:1 bonus shares (12 Nov 2022) · FSN E-Commerce Ventures Ltd (filed with NSE/BSE) · Tier 1: company or exchange filing · 12 Nov 2022
- S54NSE corporate actions: NYKAA bonus 5:1, ex-date 10 Nov 2022, record date 11 Nov 2022 · NSE · Tier 1: company or exchange filing · 10 Nov 2022
- S55Clarification on IPO price: correct exact IPO price Rs 186.85 per share (25 Feb 2025) · FSN E-Commerce Ventures Ltd (filed with NSE/BSE) · Tier 1: company or exchange filing · 25 Feb 2025
- S56Board outcome: Walker Chandiok & Co LLP proposed as statutory auditor (23 Jul 2026) · FSN E-Commerce Ventures Ltd (filed with NSE/BSE) · Tier 1: company or exchange filing · 23 Jul 2026
- S57SAST Reg 31(4) declaration by promoters: no encumbrance in FY26 (dated 1 Apr 2026) · FSN E-Commerce Ventures Ltd (filed with NSE/BSE) · Tier 1: company or exchange filing · 9 Apr 2026
- S58Completion of 51% acquisition of Aminu Wellness (24 Sep 2026) · FSN E-Commerce Ventures Ltd (filed with NSE/BSE) · Tier 1: company or exchange filing · 24 Sep 2026
- S60Reg 30: NSE/BSE fine of Rs 29,500 each for alleged delay under Reg 44(5) (26 Sep 2024) · FSN E-Commerce Ventures Ltd (filed with NSE/BSE) · Tier 1: company or exchange filing · 26 Sep 2024
- S62NCLT approves demerger of FSN Distribution into Nykaa E-Retail (10 May 2025) · FSN E-Commerce Ventures Ltd (filed with NSE/BSE) · Tier 1: company or exchange filing · 10 May 2025
- S63NSE CM bhavcopy 11 Nov 2026 (NYKAA EQ close) · NSE · Tier 1: company or exchange filing · 11 Nov 2026
Changes to this page (v1 · 12 Nov 2026)
- v1 · 12 Nov 2026First version. (first version)
Numbers come only from tier 1 and tier 2 sources. Read how we research.
Disclaimer
For learning only. Cityfort is not a SEBI-registered adviser and does not recommend buying or selling any security. Prices shown are dated and may be out of date.
Investing in securities involves risk, including loss of capital. Before making any investment decision, do your own research and consider consulting a SEBI-registered investment adviser.
Cityfort, its owners and contributors may or may not hold securities of companies covered. Content is not an offer or solicitation to buy or sell any security.
Read the full disclaimerHide the full disclaimer
Cityfort publishes educational content that explains how listed companies work. Cityfort is not registered with the Securities and Exchange Board of India (SEBI) as an Investment Adviser or Research Analyst and does not provide investment advice, recommendations, ratings, price targets or any opinion on whether to buy, sell or hold any security.
All information is taken from publicly available sources, mainly company filings on BSE and NSE, which are listed on each page with dates. We work to keep it accurate and correct errors publicly, but we do not guarantee that it is complete, accurate or up to date. Any market price or price-based ratio shown is dated, may be out of date by the time you read it, and is included only to explain concepts.
Statements by company management are reported as statements, with their date and source; they are not our forecasts.