Consumer Services · NSE: TRENT · BSE: 500251
Trent: how the business works
Trent runs the Westside and Zudio fashion store chains across India, earning ₹20,074 crore of revenue in FY26.
Follow Trent
Email me when Trent's page is updated after results.
We store your email address with Kit, our email provider, which also records when you sign up and whether you open or click our emails. We send a confirmation email first. See our privacy policy.
Trent Limited · Mumbai, Maharashtra · Founded 1952
Updated for Q2 FY27 · checked
- Revenue, FY26
- ₹20,074 cr
- Profit to shareholders, FY26
- ₹1,720 cr
- Fashion stores, 30 Sep 2026
- 1,342
- Incorporated
- 1952
- Promoter (Tata group) holding, Sep 2026
- 37.01%
The short version
Trent in 5 points
1 · What it sells
Trent sells own-brand clothes, footwear and beauty products in 1,342 fashion stores, mostly Zudio (999) and Westside (311), and its FY26 revenue was ₹20,074 crore.
2 · Who pays it
Individual shoppers in 339 cities pay Trent, mostly at once according to CARE, but Trent does not disclose how much of its revenue comes from Zudio, Westside or other stores.
3 · What it keeps from ₹100
Of every ₹100 that came in during FY26, Trent paid ₹55.8 for the goods it resold and kept ₹8.5 as profit, which includes ₹115 crore of other income and a one-off ₹26 crore labour-code charge; operating profit before those (EBITDA) was ₹18.3 per ₹100 of revenue.
4 · Where the operating profit comes from
Trent reports one 'Retail' segment, so its FY26 EBITDA of ₹3,673 crore is not split by brand, and Star, Zara and its other part-owned companies added a net ₹3.90 crore.
5 · The one thing to watch
Trent's revenue rose 21.9% in Q2 FY27 from a year earlier, while like-for-like sales at its fashion stores grew at a mid-single-digit rate, the company said.
Sources: From Trent's FY26 annual report, its Q2 FY27 results, press release and presentation, and CARE Ratings' 12 May 2026 report · checked
Sources (6)
- Press release: Q2 and H1 FY27 results
- Investor presentation Q2 FY27
- Integrated Annual Report FY26 (2025-26), incl. BRSR and consolidated financial statements
- CARE Ratings press release: Trent Limited, ratings reaffirmed (CARE AA+; Stable / CARE A1+) and NCD rating assigned
- Q2 FY27 consolidated results, XBRL (integrated filing)
- Outcome of board meeting 29 Oct 2026 with Q2 FY27 standalone and consolidated results
01Where the money goes · FY26
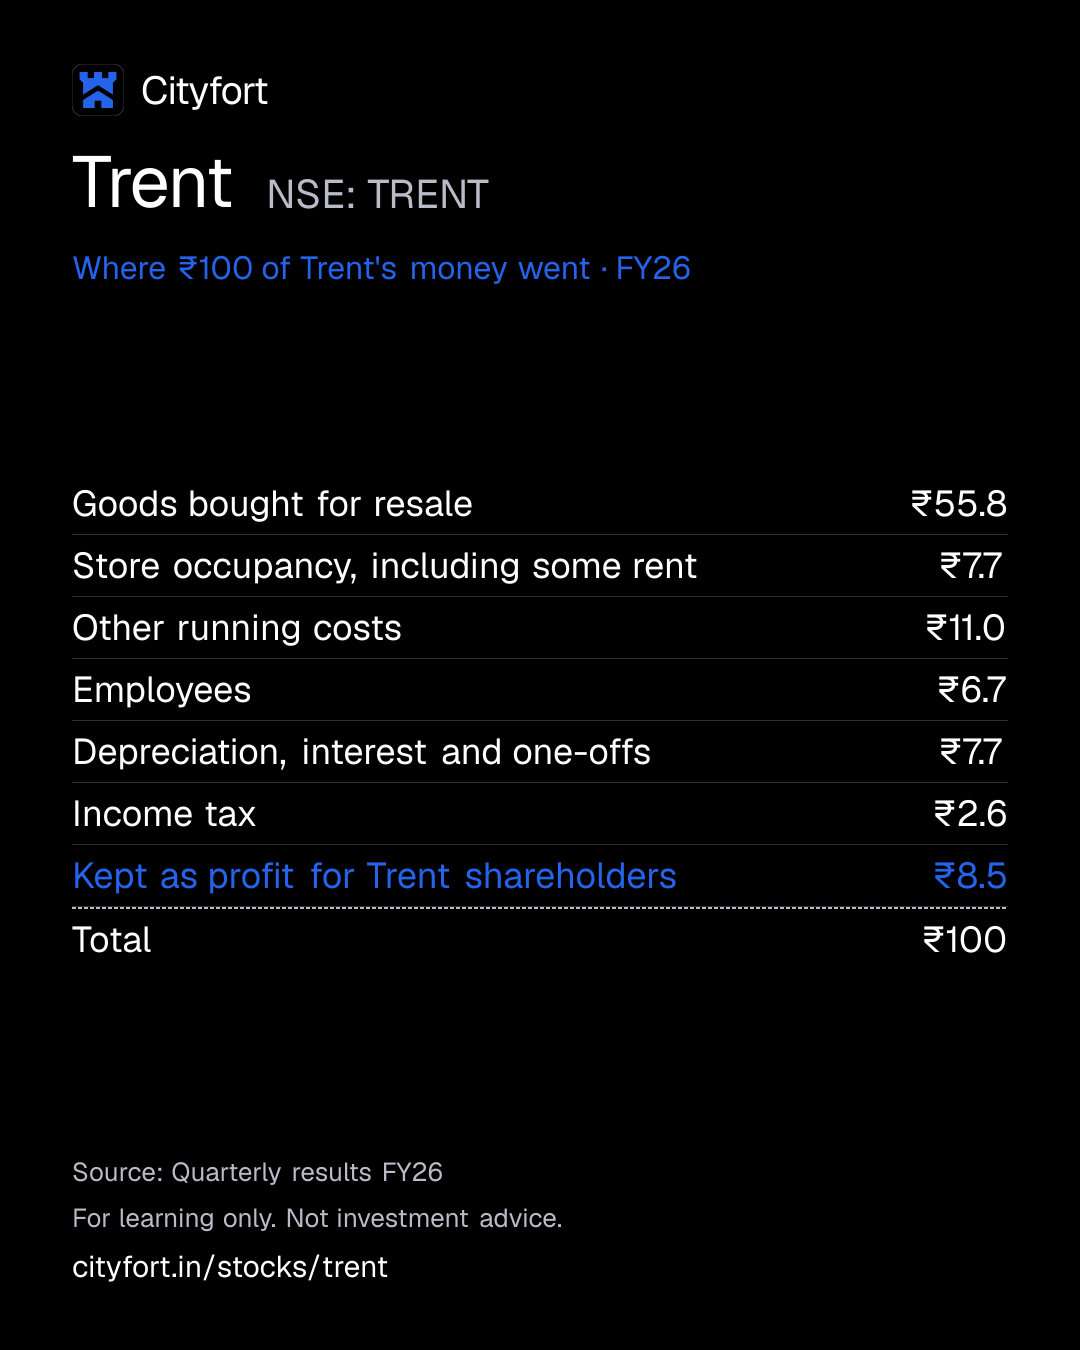
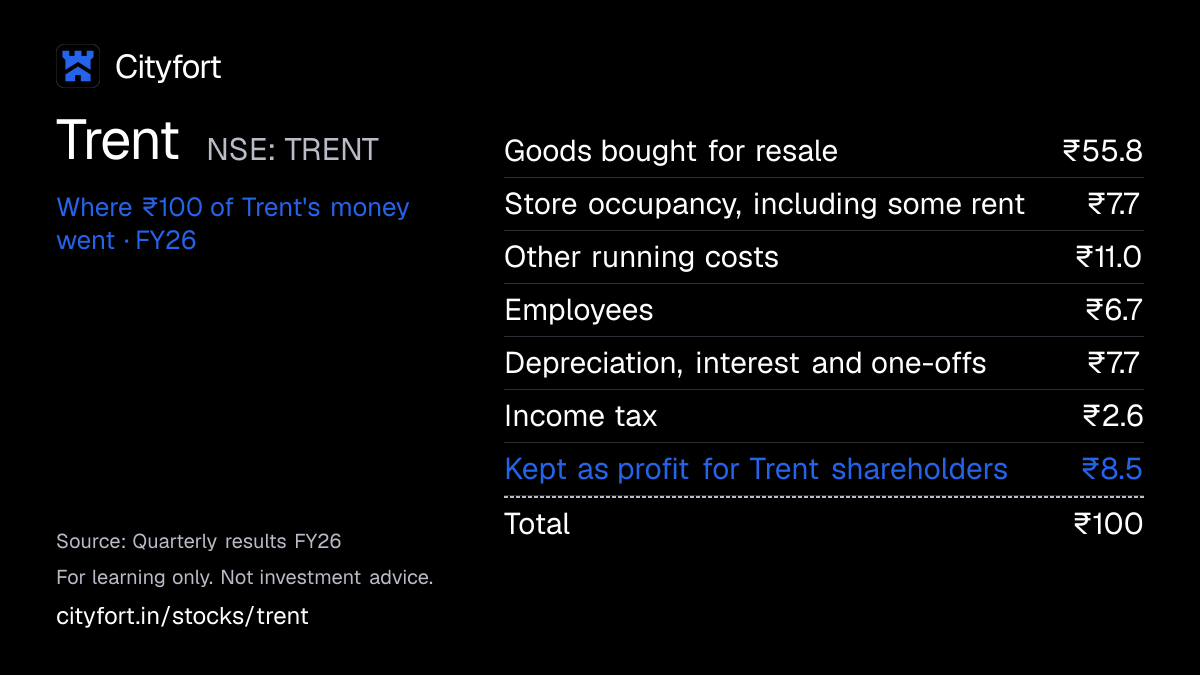
Where does ₹100 of Trent's money go?
Trent · FY26
Receipt for every ₹100
| Goods bought for resale | ₹55.8 |
|---|---|
| Store occupancy, including some rent | ₹7.7 |
| Other running costs | ₹11.0 |
| Employees | ₹6.7 |
| Depreciation, interest and one-offs | ₹7.7 |
| Income tax | ₹2.6 |
| Kept as profit for Trent shareholders | ₹8.5 |
| Total | ₹100 |
Each line = amount ÷ total money in × 100. Lines may not add to exactly ₹100 because of rounding.
How this is worked out
Of every ₹100 that came in during FY26: revenue (₹20,074 crore) plus other income (₹115 crore). Each line = cost ÷ ₹20,189 crore × 100 (Cityfort calculation from the FY26 annual report). Most rent sits in depreciation and interest because store leases are booked as assets and loans; the one-off labour-code charge, the net result of part-owned companies and the minority partners' share are in that line too.
Save this receipt as an image
Embed this receipt or the key numbers
Paste this code into a blog or website to show the card you choose, with a link back to this page.
Each week: the next company due to report results, explained in 5 points.
We'll email you once a week with what changed on Cityfort. Facts only, no tips. Unsubscribe any time.
We store your email address with Kit, our email provider, which also records when you sign up and whether you open or click our emails. We send a confirmation email first. See our privacy policy.
02The business in one line
What does Trent do?
Shoppers pay Trent for own-brand clothes, footwear and beauty products sold in its own stores; most of the money goes on buying those goods, and what's left after rent, staff and tax is profit.
- In FY26 Trent's revenue was ₹20,074 crore, from 1,286 fashion stores at the year end and its websites.
- Of every ₹100 that came in during FY26, ₹55.8 paid for the goods it resold and ₹8.5 was kept as profit.
03Who pays it
Who pays Trent?
Trent does not disclose how much each type of customer pays.
Shoppers at Zudio, Westside and other Trent stores
Individual customers buying clothes, footwear and beauty products in 1,342 stores in 339 cities (30 Sep 2026). Trent does not disclose the split by brand.
Online shoppers
Buy from Westside's website and app. Online sales were over 6% of Westside's revenue in Q2 FY27; Trent gives no group-wide online share.
Shops and businesses buying wholesale
Buy from Booker India, a 51% subsidiary that runs 3 cash-and-carry wholesale stores. Booker's FY26 total income was ₹199 crore.
How spread out the customers are
Trent sells to a very large number of individual shoppers. CARE Ratings notes most sales are paid at once, so Trent collects its money within 1–2 days. Trent reports one 'Retail' segment and does not disclose revenue by brand, format or channel.
Sources (6)
- Investor presentation Q2 FY27
- Q2 FY27 consolidated results, XBRL (integrated filing)
- Press release: Q2 and H1 FY27 results
- Integrated Annual Report FY26 (2025-26), incl. BRSR and consolidated financial statements
- CARE Ratings press release: Trent Limited, ratings reaffirmed (CARE AA+; Stable / CARE A1+) and NCD rating assigned
- Outcome of board meeting 29 Oct 2026 with Q2 FY27 standalone and consolidated results
04How it makes money
How does Trent make money?
Trent grows mainly by opening new stores; it said like-for-like fashion sales grew at a mid-single-digit rate in Q2 FY27.
Trent opened 272 fashion stores in FY26. In Q2 FY27 its like-for-like sales (sales at comparable existing stores) grew at a mid-single-digit rate, the company said, while revenue rose 21.9%. EBITDA (profit before interest, tax and wear-and-tear) per ₹100 of revenue rose from ₹13.0 in FY23 to ₹18.3 in FY26.
EBITDA per ₹100 of revenue (Cityfort calculation)
₹13.0₹18.3
FY23 to FY26
- Trent designs own-brand clothes and outside suppliers make them.
- It sells them only in stores it runs, at prices it sets.
- It opens new stores each year: 272 in FY26 (60 Westside, 212 Zudio).
- Revenue rose from ₹8,242 crore in FY23 to ₹20,074 crore in FY26.
- Cash from operations (₹2,668 crore in FY26) paid for ₹1,763 crore of new stores and property.
- Each new store adds rent and depreciation, so store sales decide what is left.
↺ Step 6 feeds back into step 1.
05The numbers · Consolidated · ₹ crore
How has Trent done?
Revenue
₹20,074 crFY26
Revenue grew every year, from ₹4,498 crore in FY22 to ₹20,074 crore in FY26, and Q2 FY27 revenue was 21.9% above Q2 FY26.
₹ crore
See the numbers
Net profit
₹1,720 crFY26
FY24 profit of ₹1,487 crore includes a one-off ₹439 crore after-tax gain from re-assessing store leases, so FY25's ₹1,547 crore was 4% higher; FY26 profit was ₹1,720 crore.
₹ crore
See the numbers
Net profit for every ₹100 of revenue
₹8.6FY26
EBITDA per ₹100 of revenue rose from ₹12.8 in FY22 to ₹18.3 in FY26, while net profit per ₹100 was ₹8.6 in FY26 (FY24's ₹12.0 includes the one-off lease gain).
Net margin: ₹ of net profit per ₹100 of revenue
See the numbers
Free cash flow
₹905 crFY26
Free cash flow (cash from operations minus spending on stores and property) was ₹905 crore in FY26, and Trent also paid ₹797 crore on store leases that year.
₹ crore · cash from operations minus spending on plants and equipment
See the numbers
See all yearly numbers
EBITDA = profit before interest, tax and wear-and-tear of assets. Financial year runs April to March (March year end). Net profit is the share belonging to the company's owners. Total net income differs from net profit to the company's owners: Total profit was lower than shareholders' profit because minority partners in subsidiaries such as Booker India took ₹71 crore of losses.
Sources (16)
- Annual Report FY23 (2022-23), incl. consolidated financial statements
- Allotment of 1:2 bonus equity shares (share count 53,32,32,301)
- Integrated Annual Report FY24 (2023-24), incl. consolidated financial statements
- Integrated Annual Report FY25 (2024-25), incl. consolidated financial statements
- Integrated Annual Report FY26 (2025-26), incl. BRSR and consolidated financial statements
- Outcome of board meeting 29 Oct 2026 with Q2 FY27 standalone and consolidated results
- Q2 FY25 consolidated results, XBRL
- Q4 FY25 and FY25 standalone and consolidated results (machine-readable re-filing of the 29 Apr 2025 board outcome)
- Q3 FY25 consolidated results, XBRL
- Q1 FY26 standalone and consolidated results (machine-readable re-filing of the 6 Aug 2025 board outcome)
- Q2 FY26 consolidated results, XBRL (integrated filing)
- Outcome of board meeting 6 Aug 2026: Q1 FY27 results; statutory auditor rotation (B S R & Co. LLP proposed from the 75th AGM, 2027)
- Q3 FY26 consolidated results, XBRL (integrated filing)
- Q4 FY26 and FY26 consolidated results, XBRL (integrated filing)
- Q1 FY27 consolidated results, XBRL (integrated filing)
- Q2 FY27 consolidated results, XBRL (integrated filing)
06Who runs it
Who runs Trent, and did they deliver?
Bahram Vakil
Chairman (from 12 Nov 2026) · since 2026
Joined the board on 23 Apr 2026. Becomes chairman from 12 Nov 2026, as announced on 29 Oct 2026.
Noel N. Tata
Chairman until the close of 11 Nov 2026, then Chairman Emeritus
Retires as chairman and director from the close of business on 11 Nov 2026, under the Tata Group's governance guidelines, as announced on 29 Oct 2026.
P. Venkatesalu
Managing Director
Neeraj Basur
Chief Financial Officer
Krupa Anandpara
Company Secretary
What they said, and what happened
1 delivered · 3 too early to tell
Said on 22 Apr 2026
Issue 1 bonus share for every 2 shares held, subject to shareholder approval.
DeliveredWhat happened
Shareholders approved the bonus by postal ballot (results filed 27 May 2026), and Trent allotted the shares on 5 Jun 2026.
Said on 22 Apr 2026
Speed up the expansion of Star grocery stores in the coming years, after it was slower than expected (Noel N. Tata, then chairman).
Too early to tellWhat happened
Star had 87 stores in 13 cities at 30 Sep 2026, up from 84 at 31 Mar 2026.
Said on 22 Apr 2026
The board approved raising up to ₹2,500 crore of equity through a rights issue or other permitted routes, with timing to be evaluated.
Too early to tellWhat happened
CARE said on 12 May 2026 that the timeline was not finalised. The filings collected show no allotment by 11 Nov 2026.
Said on 23 Oct 2026
Sell Netria Property Holdings, a subsidiary that holds premises Trent uses, to TreBits Investment Trust after that trust's IPO, and lease the premises back.
Too early to tellWhat happened
A binding term sheet was signed on 22 Oct 2026; the sale was not complete when this page was written.
Sources (9)
- Change in directors: Noel N. Tata retires as Chairman (close of 11 Nov 2026); Bahram Vakil Chairman from 12 Nov 2026; Rajiv Dube and Kalpana Merchant appointed
- Outcome of board meeting 22 Apr 2026: FY26 audited results, dividend, 1:2 bonus, ESOP 2026, Rs 2,500 crore fund-raising enabling approval, Bahram Vakil appointed
- Integrated Annual Report FY26 (2025-26), incl. BRSR and consolidated financial statements
- Postal ballot voting results (bonus issue, ESOP 2026, capital clause)
- Allotment of 1:2 bonus equity shares (share count 53,32,32,301)
- Press release: Q4 and FY26 results
- Press release: Q2 and H1 FY27 results
- CARE Ratings press release: Trent Limited, ratings reaffirmed (CARE AA+; Stable / CARE A1+) and NCD rating assigned
- Proposed divestment of Netria Property Holdings (step-down subsidiary) to TreBits Investment Trust (SM REIT); binding term sheet 22 Oct 2026
07What could go wrong
What could go wrong for Trent?
- Execution
Growth relies on new stores
Like-for-like fashion sales grew at a mid-single-digit rate in Q2 FY27, Trent said, and at a low-single-digit rate in FY26, CARE said.
Watch Store openings and like-for-like growth in each results presentation, and the revenue update Trent files a few days after each quarter (5 Oct 2026 for Q2 FY27).
- Competition
Many rivals, low entry barriers
CARE names Shoppers Stop, Lifestyle International and Aditya Birla Fashion as rivals and online sellers as a threat. It says entry barriers in branded clothing are low and unorganised sellers compete too.
Watch EBITDA per ₹100 of revenue (₹18.3 in FY26).
- Demand
Unsold stock
Trent buys its goods outright, so it carries the cost of anything that does not sell. CARE notes fashion spending is discretionary and cyclical. Inventory rose from ₹2,289 crore (31 Mar 2026) to ₹2,841 crore (30 Sep 2026).
Watch Inventory on the half-year and full-year balance sheets.
- Debt
Rising store lease costs
Depreciation, which includes leased store space, rose 52% to ₹1,361 crore in FY26 while revenue rose 17%. Lease payments were ₹797 crore in FY26, and lease liabilities ₹1,839 crore at 30 Sep 2026.
Watch Depreciation and lease payments compared with revenue growth.
- Execution
Losses at Star
Trent Hypermarket (Star) lost ₹129.76 crore in FY26, after a loss of ₹70.32 crore in FY25. Trent's share of all part-owned companies' results fell from ₹124 crore in FY24 to ₹3.90 crore in FY26, partly because its Zara stake fell to 20%.
Watch Trent's share of joint-venture and associate results each quarter (minus ₹21 crore in Q2 FY27).
- Execution
High staff turnover
59.28% of permanent employees left during FY26, after 52.64% in FY25, Trent's sustainability report shows. Store service depends on hiring and training staff quickly.
Watch Permanent-employee turnover in the FY27 annual report.
Sources (8)
- Investor presentation Q2 FY27
- CARE Ratings press release: Trent Limited, ratings reaffirmed (CARE AA+; Stable / CARE A1+) and NCD rating assigned
- Press release: Q4 and FY26 results
- Update for Q2 FY27 and H1 FY27 (standalone revenue and store count)
- Integrated Annual Report FY26 (2025-26), incl. BRSR and consolidated financial statements
- Outcome of board meeting 29 Oct 2026 with Q2 FY27 standalone and consolidated results
- Q2 FY27 consolidated results, XBRL (integrated filing)
- Inditex Trent Retail India buyback accepted: 94,900 shares for Rs 146.35 crore; Trent stake now 20%
08Supporters and critics
What do supporters and critics point to?
What supporters point to
- Revenue grew every year from ₹4,498 crore in FY22 to ₹20,074 crore in FY26, and rose 21.9% in Q2 FY27.
- EBITDA per ₹100 of revenue rose from ₹12.8 in FY22 to ₹18.3 in FY26.
- At 30 Sep 2026 cash and liquid investments (₹917 crore) exceeded borrowings (₹489 crore); CARE rates Trent AA+ with a stable outlook.
- The Tata promoter group's 37.01% holding was unchanged for 12 quarters to Sep 2026, with no shares pledged.
What critics point to
- Like-for-like fashion sales grew at a mid-single-digit rate in Q2 FY27, the company said, while revenue rose 21.9%.
- Star lost ₹129.76 crore in FY26, after a loss of ₹70.32 crore in FY25, and its store expansion was slower than Trent expected.
- Depreciation rose 52% in FY26 while revenue rose 17%.
- Trent does not disclose revenue or profit by brand, so Westside and Zudio cannot be compared.
09What to watch next
What should you watch next at Trent?
Next event
Q3 FY27 results (date not announced)
Date not announced yet.
Store openings and like-for-like sales
Trent opened 10 Westside and 19 Zudio stores in Q2 FY27. It usually files a revenue and store-count update a few days after each quarter ends, as on 5 Oct 2026.
Star's expansion
Star had 87 stores at 30 Sep 2026. Then-chairman Noel N. Tata said on 22 Apr 2026 that Trent wants to speed up Star's expansion.
The ₹2,500 crore equity approval
The board approved raising up to ₹2,500 crore of equity on 22 Apr 2026. CARE said in May 2026 the timing was not finalised.
A new chairman
Bahram Vakil becomes chairman from 12 Nov 2026. Noel N. Tata retires as chairman and director from the close of business on 11 Nov 2026, under the Tata Group's governance guidelines.
10Key facts
Key facts about Trent
- What does Trent do?
- Trent Ltd, a Tata group company, runs fashion stores under its own brands, mainly Zudio (999 stores) and Westside (311 stores) at 30 Sep 2026. Trent also owns half of Star, a grocery chain run as a joint venture with Tesco.
- How does Trent make money?
- Trent buys clothes, footwear and beauty products made to its own designs by outside suppliers and sells them in its own stores. In FY26 goods bought for resale took ₹55.8 of every ₹100 that came in, and Trent kept ₹8.5 as profit.
- Who are Trent's customers?
- Trent sells to individual shoppers through 1,342 fashion stores in 339 cities (30 Sep 2026) and online. CARE Ratings notes that most of Trent's sales are paid at once, so it collects its money within 1–2 days. Trent does not disclose revenue by brand.
- How big is Trent?
- Trent's FY26 consolidated revenue was ₹20,074 crore and its profit for shareholders ₹1,720 crore, up from ₹17,135 crore and ₹1,547 crore in FY25. Trent's Q2 FY27 revenue was ₹5,873 crore.
- Who owns Trent?
- At 30 Sep 2026 Trent's promoter group held 37.01%, led by Tata Sons (32.45%) and Tata Investment Corporation (4.28%), with no shares pledged. Domestic institutions held 23.33%, foreign investors 15.28% and other shareholders 24.38%.
- Is Star part of Trent's revenue?
- No. Star is run by Trent Hypermarket, a 50:50 joint venture of Trent and Tesco, so its ₹2,774 crore of FY26 income is not in Trent's revenue. Only Trent's share of Star's profit or loss appears in Trent's accounts.
- How much does Trent owe?
- At 30 Sep 2026 Trent had ₹489 crore of borrowings and ₹917 crore of cash and liquid investments. Trent also owed ₹1,839 crore under store leases.
- What was Trent's 2026 bonus issue?
- Trent allotted 1 bonus share for every 2 shares held on 5 Jun 2026, raising its share count from 35.55 crore to 53.32 crore. Restated for the bonus, Trent's FY26 earnings per share were ₹32.25.
- Who is Trent's chairman?
- Bahram Vakil is Trent's chairman from 12 Nov 2026. Noel N. Tata retires as chairman and director from the close of business on 11 Nov 2026, under the Tata Group's governance guidelines, and becomes Chairman Emeritus, Trent announced on 29 Oct 2026.
Sources (9)
- Press release: Q2 and H1 FY27 results
- Integrated Annual Report FY26 (2025-26), incl. BRSR and consolidated financial statements
- Investor presentation Q2 FY27
- CARE Ratings press release: Trent Limited, ratings reaffirmed (CARE AA+; Stable / CARE A1+) and NCD rating assigned
- Q2 FY27 consolidated results, XBRL (integrated filing)
- Shareholding pattern as of 30 Sep 2026 (XBRL)
- Outcome of board meeting 29 Oct 2026 with Q2 FY27 standalone and consolidated results
- Allotment of 1:2 bonus equity shares (share count 53,32,32,301)
- Change in directors: Noel N. Tata retires as Chairman (close of 11 Nov 2026); Bahram Vakil Chairman from 12 Nov 2026; Rajiv Dube and Kalpana Merchant appointed
Terms on this page
- Capital expenditure (capex)
- Credit rating
- Dividend payout ratio
- EBITDA
- FII and DII holding
- Free cash flow
- Market capitalisation
- Net debt
- Net profit
- Operating margin
Each explains the term in plain English, with the same number from other companies on Cityfort.
Go deeper
More detail from the same filings. Open any section.
11What it sells
11What it sells
What does Trent sell?
Zudio
Fashion stores of about 10,000–12,000 sq ft. 999 stores at 30 Sep 2026, including 7 in the UAE and Zudio shops inside Star stores.
Westside
Larger fashion stores, mostly 20,000–30,000 sq ft, plus an online store. 311 stores at 30 Sep 2026; online sales were over 6% of Westside's revenue in Q2 FY27.
Beauty, innerwear and footwear
Trent calls these emerging categories. Together they were over 21% of its revenue in Q2 FY27, the company said.
Other fashion concepts
Smaller own-brand store formats: 32 stores at 30 Sep 2026.
Star (joint venture)
Grocery and daily-needs stores, 87 stores in 13 cities at 30 Sep 2026. Trent owns 50%; Tesco owns the other half.
Zara and Massimo Dutti stakes
Trent owns 20% of the Indian companies that run Zara (22 stores) and Massimo Dutti (4 stores). Inditex, the Spanish owner of both brands, runs them.
What it does
- Does: Designs and sells its own brands of clothes, footwear, innerwear and beauty products
- Does: Runs its stores itself; the company says it franchises only selectively, mainly where a property calls for it
- Does: Buys and owns the stock in its stores, rather than taking goods on sale-or-return
- Does: Sells Zudio in the UAE (7 stores at 30 Sep 2026)
What it does not do
- Does not: Does not make clothes: Trent's FY26 sustainability report says it has no manufacturing
- Does not: Does not count Star's grocery sales as its revenue: Star is a 50:50 joint venture, so only Trent's share of its profit or loss shows
- Does not: Does not run Zara in India: Inditex controls the brand, buying and stores, and Trent holds 20%
Sources (6)
- Press release: Q2 and H1 FY27 results
- Press release: Q1 FY27 results
- Investor presentation Q2 FY27
- Integrated Annual Report FY26 (2025-26), incl. BRSR and consolidated financial statements
- Inditex Trent Retail India buyback accepted: 94,900 shares for Rs 146.35 crore; Trent stake now 20%
- Sale of shares in Massimo Dutti India (stake 49% to 20%) to Grupo Massimo Dutti for Rs 20.75 crore
12How the money flows
12How the money flows · FY26
How does money flow through Trent?
Money in
- Revenue from operations (store and online sales)₹20,074 cr
- Other income₹115 cr
The company
Trent
₹20,189 cr came in
Money out
- Goods bought for resale₹11,265 cr
- Store occupancy costs, including some rent₹1,564 cr
- Other running costs₹2,217 cr
- Employee costs₹1,355 cr
- Depreciation and interest (much of it on leased stores), one-off charge and partner companies' net result₹1,553 cr
- Income tax₹515 cr
- Net profit for Trent shareholders₹1,720 cr
- In FY26 shoppers paid Trent ₹20,074 crore. Trent also had ₹115 crore of other income, such as interest.
- Buying the goods it resold took ₹11,265 crore, the largest cost by far.
- Store occupancy costs took ₹1,564 crore, other running costs ₹2,217 crore and employees ₹1,355 crore.
- Depreciation and interest, much of it on leased stores, took ₹1,530 crore; a one-off labour-code charge took ₹26 crore, and income tax ₹515 crore.
- What was left for Trent's shareholders was ₹1,720 crore of profit.
13What it needs to run
13What it needs to run
What does Trent need to run?
Store space
18.57 million sq ft of fashion stores at 30 Sep 2026. Lease liabilities were ₹1,839 crore on that date.
Stock on the shelves
Trent buys its goods outright, CARE notes. Inventory was ₹2,841 crore at 30 Sep 2026, up from ₹2,289 crore at 31 Mar 2026.
Outside suppliers
Trent has no factories, its FY26 sustainability report says, so suppliers make its own-brand goods.
Store staff
38,417 people worked for Trent at 31 Mar 2026, 31,226 of them permanent. Permanent-staff turnover was 59.28% in FY26.
Sources (4)
- Investor presentation Q2 FY27
- Outcome of board meeting 29 Oct 2026 with Q2 FY27 standalone and consolidated results
- CARE Ratings press release: Trent Limited, ratings reaffirmed (CARE AA+; Stable / CARE A1+) and NCD rating assigned
- Integrated Annual Report FY26 (2025-26), incl. BRSR and consolidated financial statements
14Competitors and what protects it
14Competitors and what protects it
Who does Trent compete with?
Shoppers Stop Ltd
NSE: SHOPERSTOP
Named by CARE as a rival physical retailer. Its FY26 consolidated revenue was ₹5,043 crore, with a loss of ₹36 crore.
Aditya Birla Fashion and Retail Ltd
NSE: ABFRL
Named by CARE as a rival. Its FY26 consolidated revenue was ₹8,177 crore, with a loss of ₹776 crore.
Lifestyle International
Named by CARE as a rival physical retailer. It is not listed in India, so no figures were collected.
Amazon, Flipkart and Myntra
CARE says these online retailers are a competitive threat to Trent's stores.
What protects the business
Each strength is scored 1 (weak) to 5 (strong) for the business, with the reason. It is not a rating of the share.
- Own brands in own stores4 of 5
Trent sells its own brands straight to shoppers and prefers stores it runs itself. Its Q2 FY27 presentation says it owns the goods at all times.
- Store network4 of 5
Trent had 1,342 fashion stores in 339 cities, with 18.57 million sq ft, at 30 Sep 2026. Zudio alone had 999 stores.
- Low borrowings4 of 5
At 30 Sep 2026 borrowings were ₹489 crore and cash and liquid investments ₹917 crore. CARE put gearing, including leases, at 0.36 times net worth in FY26.
- Tata group backing3 of 5
Tata Sons holds 32.45% of Trent. CARE's rating takes Tata group support into account and notes Tata Sons put ₹950 crore into Trent in FY20.
Weak spot
Slow growth at existing stores
Like-for-like fashion sales grew at a mid-single-digit rate in Q2 FY27, Trent said, and at a low-single-digit rate in FY26, CARE said. CARE also says entry barriers in branded clothing are low.
Sources (7)
- CARE Ratings press release: Trent Limited, ratings reaffirmed (CARE AA+; Stable / CARE A1+) and NCD rating assigned
- Shoppers Stop Ltd: Q4 FY26 and FY26 consolidated results, XBRL (peer)
- Aditya Birla Fashion and Retail Ltd: Q4 FY26 and FY26 consolidated results, XBRL (peer)
- Investor presentation Q2 FY27
- Press release: Q2 and H1 FY27 results
- Outcome of board meeting 29 Oct 2026 with Q2 FY27 standalone and consolidated results
- Shareholding pattern as of 30 Sep 2026 (XBRL)
15Where growth could come from
15Where growth could come from
Where could Trent's growth come from?
Trent gives no numeric revenue or profit guidance and publishes no earnings-call transcripts. In its Q2 FY27 presentation (29 Oct 2026), the company said it expects the yearly pace of new store openings "to remain broadly consistent".
More Zudio stores
Working765 → 963 stores, FY25 to FY26
Zudio opened 212 stores in FY26 and 19 in Q2 FY27, reaching 999. Trent said about 85% of Q2 FY27 Zudio openings were in peripheral growth markets or in Tier II cities and beyond.
Status: Working, on track against what the company said.
More Westside stores
Working248 → 300 stores, FY25 to FY26
Westside opened 60 stores and consolidated 8 in FY26, then opened 10 in Q2 FY27, reaching 311.
Status: Working, on track against what the company said.
Star grocery stores
Behind84 → 87 stores, Mar to Sep 2026
Noel N. Tata, then chairman, said on 22 Apr 2026 that Star's store expansion had been slower than Trent expected, and that it wants to speed it up. Trent said Star's Q2 FY27 revenue grew over 20%.
Status: Behind, behind the company's own plan.
Zudio in the UAE
Early7 stores, 30 Sep 2026
The first Zudio store in Dubai opened in Aug 2024. The UAE company had FY26 total income of ₹61 crore and a loss of ₹14 crore.
Status: Early, too early to judge.
Status compares progress with what the company itself said it would do: Working = on track against what the company said; Mixed = partly on track; Behind = behind the company's own plan; New = recently announced; Early = too early to judge.
Sources (6)
- Investor presentation Q2 FY27
- Integrated Annual Report FY25 (2024-25), incl. consolidated financial statements
- Press release: Q4 and FY26 results
- Press release: Q2 and H1 FY27 results
- Opening of first Zudio store in Dubai, UAE (Trent Global Trading LLC)
- Integrated Annual Report FY26 (2025-26), incl. BRSR and consolidated financial statements
16Financial strength and debt
16Financial strength · 30 Sep 2026
How much debt does Trent have?
- Total debt₹489 cr
- Cash and investments₹917 cr
- Net cash (cash minus debt)₹427 cr
- Net worth (shareholders' money)₹7,896 cr
- Debt to equity
- 0.06×
- ₹ of debt for every ₹1 of shareholders' money
- Debentures (bond-type loans) issued in FY22 were repaid on 29 May 2026. In H1 FY27 Trent repaid ₹500 crore of borrowings and took ₹476.28 crore of new ones; the results do not say what type. Borrowings were ₹489 crore at 30 Sep 2026, all due within a year. The board approved new debentures of up to ₹500 crore on 26 Mar 2026.
- Lease liabilities (rent Trent has committed to pay under store leases) were ₹1,839 crore, down from ₹2,061 crore at 31 Mar 2026.
- Lease liabilities fell from ₹3,966 crore in FY23 to ₹1,254 crore in FY24 after Trent re-assessed its lease terms. That re-assessment also produced the one-off FY24 gain of ₹576 crore before tax.
- Cash and liquid investments = cash, other bank balances and current investments. Net worth of ₹7,896 crore includes ₹127 crore belonging to minority partners; shareholders' equity was ₹7,769 crore.
- Contingent liabilities (claims against the group that it disputes) were ₹92 crore at 31 Mar 2026, mostly income tax claims of ₹79 crore.
Sources (7)
- Outcome of board meeting 29 Oct 2026 with Q2 FY27 standalone and consolidated results
- Q2 FY27 consolidated results, XBRL (integrated filing)
- Integrated Annual Report FY26 (2025-26), incl. BRSR and consolidated financial statements
- Integrated Annual Report FY25 (2024-25), incl. consolidated financial statements
- Integrated Annual Report FY24 (2023-24), incl. consolidated financial statements
- CARE Ratings press release: Trent Limited, ratings reaffirmed (CARE AA+; Stable / CARE A1+) and NCD rating assigned
- Outcome of board meeting 26 Mar 2026: NCDs up to Rs 500 crore approved
17Who owns it
17Who owns it · Q2 FY27
Who owns Trent?
- Promoters (founders or parent company)37.0%
- Foreign institutions (FII)15.3%
- Indian institutions (DII)23.3%
- Public and others24.4%
Promoter pledge
No promoter shares were pledged in Q2 FY27.
How ownership changed
* Pledged = share of the promoters' own holding reported as pledged. In older filings this can include shares “otherwise encumbered”; the governance flags say when.
Sources (12)
- Shareholding pattern as of 31 Dec 2023 (XBRL)
- Shareholding pattern as of 31 Mar 2024 (XBRL)
- Shareholding pattern as of 30 Jun 2024 (XBRL)
- Shareholding pattern as of 30 Sep 2024 (XBRL)
- Shareholding pattern as of 31 Dec 2024 (XBRL)
- Shareholding pattern as of 31 Mar 2025 (XBRL)
- Shareholding pattern as of 30 Jun 2025 (XBRL; link is the revised filing of Jul 2026)
- Shareholding pattern as of 30 Sep 2025 (XBRL; link is the revised filing of Jul 2026)
- Shareholding pattern as of 31 Dec 2025 (XBRL; link is the revised filing of Jul 2026)
- Shareholding pattern as of 31 Mar 2026 (XBRL)
- Shareholding pattern as of 30 Jun 2026 (XBRL)
- Shareholding pattern as of 30 Sep 2026 (XBRL)
18What it does with profit
18What it does with profit
What does Trent do with its profit?
Dividend per share
₹4.00FY26
Dividend paid for each share, by financial year.
₹ per share
See the numbers
No buybacks or fund raises in the period covered.
Sources (6)
- Annual Report FY22 (2021-22), incl. consolidated financial statements
- Allotment of 1:2 bonus equity shares (share count 53,32,32,301)
- Annual Report FY23 (2022-23), incl. consolidated financial statements
- Integrated Annual Report FY24 (2023-24), incl. consolidated financial statements
- Integrated Annual Report FY25 (2024-25), incl. consolidated financial statements
- Integrated Annual Report FY26 (2025-26), incl. BRSR and consolidated financial statements
19Governance signals
19Governance signals
What do Trent's governance filings show?
- Auditor
- Deloitte Haskins & Sells LLP
- Auditor changes
- None in the period covered
- Audit qualifications
- None reported
- Related-party dealings
- Trent's main related parties are its joint ventures and associates: Star (Trent Hypermarket, 50:50 with Tesco), the Zara and Massimo Dutti companies (20% each) and Trent MAS Fashion (50:50 with MAS Amity). Booker India, a subsidiary, provides warehousing to Star. In Mar 2025 Booker agreed to buy THPL Support Services from Trent Hypermarket, a related-party deal Trent described as at arm's length.
- Credit rating
- CARE Ratings AA+ (long term), A1+ (short term) (outlook Stable), 12 May 2026
A credit rating describes the company's ability to repay debt. It is not a rating of the share.
Flags to know about
disclosure
No split by brand
Trent reports a single 'Retail' segment. It does not disclose revenue or profit for Westside, Zudio or its other formats separately.
disclosure · 29 Oct 2026
No earnings-call transcripts
Trent publishes a press release and a presentation with each quarter's results, but no earnings-call transcripts are on its exchange filings.
auditor · 6 Aug 2026
Auditor rotation due in 2027
Deloitte Haskins & Sells LLP's second five-year term ends at the 2027 AGM, a mandatory rotation. On 6 Aug 2026 the board recommended B S R & Co. LLP for FY28–FY32.
other · 29 Oct 2026
Chairman and board changes
Noel N. Tata retires as chairman and director from the close of business on 11 Nov 2026, under the Tata Group's governance guidelines; Bahram Vakil is chairman from 12 Nov. Harish Bhat resigned as a director on 17 Oct 2026; Rajiv Dube and Kalpana Merchant joined the board from 30 Oct 2026.
regulatory · 26 Nov 2024
Small fines in 2024
Trent disclosed GST and customs penalties of ₹41,830 to ₹9.8 lakh in 2024. In Nov 2024 NSE and BSE fined it ₹4,720 each for alleged non-compliance relating to an independent director above 75 continuing for two days; Trent said it was reviewing the notices.
Sources (16)
- Integrated Annual Report FY26 (2025-26), incl. BRSR and consolidated financial statements
- Outcome of board meeting 6 Aug 2026: Q1 FY27 results; statutory auditor rotation (B S R & Co. LLP proposed from the 75th AGM, 2027)
- Booker India to acquire 100% of THPL Support Services Ltd from Trent Hypermarket (related-party, arm's length)
- CARE Ratings press release: Trent Limited, ratings reaffirmed (CARE AA+; Stable / CARE A1+) and NCD rating assigned
- Intimation regarding credit rating (CARE reaffirmation of 4 May 2026)
- Q2 FY27 consolidated results, XBRL (integrated filing)
- Outcome of board meeting 29 Oct 2026 with Q2 FY27 standalone and consolidated results
- Investor presentation Q2 FY27
- Press release: Q2 and H1 FY27 results
- Change in directors: Noel N. Tata retires as Chairman (close of 11 Nov 2026); Bahram Vakil Chairman from 12 Nov 2026; Rajiv Dube and Kalpana Merchant appointed
- Resignation of Harish Bhat, non-executive non-independent director (17 Oct 2026)
- GST penalty order Rs 41,830 (Raipur, FY2018-19)
- GST penalty order Rs 8,30,391 (Pune, FY2019-20)
- Customs (CBIC) fine Rs 9,80,930 (data transmission glitch)
- GST penalty order Rs 4,82,220 (Ahmedabad, FY2019-20)
- BSE and NSE fines Rs 4,720 each (director above 75 years, 2 days)
20What the market paid
20What the market paid · price as of 11 Nov 2026
What did the market pay for Trent on 11 Nov 2026?
Price as of 11 Nov 2026 (shown for education; prices change daily).
Trent's NSE closing price was ₹3,222.70 as of 11 Nov 2026. With 53.32 crore shares, that puts its market value at about ₹1,71,845 crore (Cityfort calculation). P/E (price ÷ yearly earnings per share) was 99.9 on FY26 earnings of ₹32.25 per share, restated for the bonus, or 90.6 on the four quarters to Sep 2026. P/B (price ÷ shareholders' equity per share) was 22.1, on equity at 30 Sep 2026. The FY26 dividend of ₹4 per share was 0.12% of that price. Peers named by CARE made losses in FY26, so no peer P/E is shown.
- Share price
- ₹3,222.70
- Market value (market cap)
- ₹171,845 cr
- P/E
- 99.9×
- P/B
- 22.1×
Source: NSE security-wise historical data, TRENT EQ, 2 to 11 Nov 2026 (close 11 Nov 2026: Rs 3,222.70); Shareholding pattern as of 30 Sep 2026 (XBRL); Allotment of 1:2 bonus equity shares (share count 53,32,32,301) and 5 more
Sources (8)
- NSE security-wise historical data, TRENT EQ, 2 to 11 Nov 2026 (close 11 Nov 2026: Rs 3,222.70)
- Shareholding pattern as of 30 Sep 2026 (XBRL)
- Allotment of 1:2 bonus equity shares (share count 53,32,32,301)
- Integrated Annual Report FY26 (2025-26), incl. BRSR and consolidated financial statements
- Outcome of board meeting 29 Oct 2026 with Q2 FY27 standalone and consolidated results
- Q2 FY27 consolidated results, XBRL (integrated filing)
- Shoppers Stop Ltd: Q4 FY26 and FY26 consolidated results, XBRL (peer)
- Aditya Birla Fashion and Retail Ltd: Q4 FY26 and FY26 consolidated results, XBRL (peer)
21How it got here
21How it got here
How did Trent get here?
1952
Milestone
Incorporated in Mumbai
The company was incorporated in 1952, according to its corporate identity number. It was earlier called Lakmé Limited and later renamed Trent Limited.
1998
Business-model change
First Westside store
Trent opened its first Westside store on Commercial Street, Bengaluru, starting its fashion retail business.
2024
Milestone
Store leases re-assessed
In FY24 Trent re-assessed its lease terms, cutting lease liabilities and booking a one-off gain of ₹576 crore before tax.
2024
Milestone
Zudio opens in Dubai
Trent opened its first Zudio store outside India, in Dubai, in Aug 2024.
2025
Business-model change
Zara and Massimo Dutti stakes cut to 20%
Trent's stake in the Zara company fell from 49% to 20% through buybacks in Aug 2024 and Nov 2025; it sold Massimo Dutti shares down to 20% in Feb 2025.
2026
Milestone
1:2 bonus issue
Trent allotted 1 bonus share for every 2 held on 5 Jun 2026, taking its shares to 53.32 crore.
2026
Milestone
New chairman
Bahram Vakil becomes chairman from 12 Nov 2026. Noel N. Tata retires as chairman and director from the close of business on 11 Nov 2026, under the Tata Group's governance guidelines.
Sources (10)
- Q4 FY25 and FY25 standalone and consolidated results (machine-readable re-filing of the 29 Apr 2025 board outcome)
- Integrated Annual Report FY26 (2025-26), incl. BRSR and consolidated financial statements
- Integrated Annual Report FY24 (2023-24), incl. consolidated financial statements
- Opening of first Zudio store in Dubai, UAE (Trent Global Trading LLC)
- Inditex Trent Retail India buyback offer of Aug 2024 (Trent holding 49%)
- Inditex Trent Retail India buyback offer (Trent holding 34.94%)
- Inditex Trent Retail India buyback accepted: 94,900 shares for Rs 146.35 crore; Trent stake now 20%
- Sale of shares in Massimo Dutti India (stake 49% to 20%) to Grupo Massimo Dutti for Rs 20.75 crore
- Allotment of 1:2 bonus equity shares (share count 53,32,32,301)
- Change in directors: Noel N. Tata retires as Chairman (close of 11 Nov 2026); Bahram Vakil Chairman from 12 Nov 2026; Rajiv Dube and Kalpana Merchant appointed
Used in a free classroom lesson: Project: a fair comparison of two companies.
22Sources and changes
Where every number on this page comes from
Sources (56 documents)
- S1Integrated Annual Report FY26 (2025-26), incl. BRSR and consolidated financial statements · NSE (company filing, nsearchives.nseindia.com) · Tier 1: company or exchange filing · 30 May 2026
- S2Integrated Annual Report FY25 (2024-25), incl. consolidated financial statements · NSE (company filing, nsearchives.nseindia.com) · Tier 1: company or exchange filing · 11 Jun 2025
- S3Integrated Annual Report FY24 (2023-24), incl. consolidated financial statements · NSE (company filing, nsearchives.nseindia.com) · Tier 1: company or exchange filing · 18 May 2024
- S4Annual Report FY23 (2022-23), incl. consolidated financial statements · NSE (company filing, nsearchives.nseindia.com) · Tier 1: company or exchange filing · 12 May 2023
- S5Annual Report FY22 (2021-22), incl. consolidated financial statements · NSE (company filing, nsearchives.nseindia.com) · Tier 1: company or exchange filing · 13 May 2022
- S6Q2 FY27 consolidated results, XBRL (integrated filing) · NSE (company filing, nsearchives.nseindia.com) · Tier 1: company or exchange filing · 29 Oct 2026
- S7Outcome of board meeting 29 Oct 2026 with Q2 FY27 standalone and consolidated results · NSE (company filing, nsearchives.nseindia.com) · Tier 1: company or exchange filing · 29 Oct 2026
- S8Q1 FY27 consolidated results, XBRL (integrated filing) · NSE (company filing, nsearchives.nseindia.com) · Tier 1: company or exchange filing · 6 Aug 2026
- S9Q4 FY26 and FY26 consolidated results, XBRL (integrated filing) · NSE (company filing, nsearchives.nseindia.com) · Tier 1: company or exchange filing · 22 Apr 2026
- S10Q3 FY26 consolidated results, XBRL (integrated filing) · NSE (company filing, nsearchives.nseindia.com) · Tier 1: company or exchange filing · 4 Feb 2026
- S11Q2 FY26 consolidated results, XBRL (integrated filing) · NSE (company filing, nsearchives.nseindia.com) · Tier 1: company or exchange filing · 7 Nov 2025
- S12Q1 FY26 standalone and consolidated results (machine-readable re-filing of the 6 Aug 2025 board outcome) · NSE (company filing, nsearchives.nseindia.com) · Tier 1: company or exchange filing · 14 Aug 2025
- S13Q4 FY25 and FY25 standalone and consolidated results (machine-readable re-filing of the 29 Apr 2025 board outcome) · NSE (company filing, nsearchives.nseindia.com) · Tier 1: company or exchange filing · 9 May 2025
- S14Q3 FY25 consolidated results, XBRL · NSE (company filing, nsearchives.nseindia.com) · Tier 1: company or exchange filing · 6 Feb 2025
- S15Q2 FY25 consolidated results, XBRL · NSE (company filing, nsearchives.nseindia.com) · Tier 1: company or exchange filing · 8 Nov 2024
- S16Investor presentation Q2 FY27 · NSE (company filing, nsearchives.nseindia.com) · Tier 1: company or exchange filing · 29 Oct 2026
- S18Press release: Q2 and H1 FY27 results · NSE (company filing, nsearchives.nseindia.com) · Tier 1: company or exchange filing · 29 Oct 2026
- S19Press release: Q1 FY27 results · NSE (company filing, nsearchives.nseindia.com) · Tier 1: company or exchange filing · 6 Aug 2026
- S20Press release: Q4 and FY26 results · NSE (company filing, nsearchives.nseindia.com) · Tier 1: company or exchange filing · 22 Apr 2026
- S21Update for Q2 FY27 and H1 FY27 (standalone revenue and store count) · NSE (company filing, nsearchives.nseindia.com) · Tier 1: company or exchange filing · 5 Oct 2026
- S22Shareholding pattern as of 31 Dec 2023 (XBRL) · NSE (company filing, nsearchives.nseindia.com) · Tier 1: company or exchange filing · 11 Jan 2024
- S23Shareholding pattern as of 31 Mar 2024 (XBRL) · NSE (company filing, nsearchives.nseindia.com) · Tier 1: company or exchange filing · 16 Apr 2024
- S24Shareholding pattern as of 30 Jun 2024 (XBRL) · NSE (company filing, nsearchives.nseindia.com) · Tier 1: company or exchange filing · 11 Jul 2024
- S25Shareholding pattern as of 30 Sep 2024 (XBRL) · NSE (company filing, nsearchives.nseindia.com) · Tier 1: company or exchange filing · 18 Oct 2024
- S26Shareholding pattern as of 31 Dec 2024 (XBRL) · NSE (company filing, nsearchives.nseindia.com) · Tier 1: company or exchange filing · 13 Jan 2025
- S27Shareholding pattern as of 31 Mar 2025 (XBRL) · NSE (company filing, nsearchives.nseindia.com) · Tier 1: company or exchange filing · 10 Apr 2025
- S28Shareholding pattern as of 30 Jun 2025 (XBRL; link is the revised filing of Jul 2026) · NSE (company filing, nsearchives.nseindia.com) · Tier 1: company or exchange filing · 21 Jul 2025
- S29Shareholding pattern as of 30 Sep 2025 (XBRL; link is the revised filing of Jul 2026) · NSE (company filing, nsearchives.nseindia.com) · Tier 1: company or exchange filing · 21 Oct 2025
- S30Shareholding pattern as of 31 Dec 2025 (XBRL; link is the revised filing of Jul 2026) · NSE (company filing, nsearchives.nseindia.com) · Tier 1: company or exchange filing · 21 Jan 2026
- S31Shareholding pattern as of 31 Mar 2026 (XBRL) · NSE (company filing, nsearchives.nseindia.com) · Tier 1: company or exchange filing · 16 Apr 2026
- S32Shareholding pattern as of 30 Jun 2026 (XBRL) · NSE (company filing, nsearchives.nseindia.com) · Tier 1: company or exchange filing · 14 Jul 2026
- S33Shareholding pattern as of 30 Sep 2026 (XBRL) · NSE (company filing, nsearchives.nseindia.com) · Tier 1: company or exchange filing · 13 Oct 2026
- S34CARE Ratings press release: Trent Limited, ratings reaffirmed (CARE AA+; Stable / CARE A1+) and NCD rating assigned · CARE Ratings Limited (careratings.com) · Tier 2: rating agency or regulator · 12 May 2026
- S35Intimation regarding credit rating (CARE reaffirmation of 4 May 2026) · NSE (company filing, nsearchives.nseindia.com) · Tier 1: company or exchange filing · 5 May 2026
- S36NSE security-wise historical data, TRENT EQ, 2 to 11 Nov 2026 (close 11 Nov 2026: Rs 3,222.70) · NSE (historical price data, nseindia.com) · Tier 1: company or exchange filing · 11 Nov 2026
- S37Outcome of board meeting 22 Apr 2026: FY26 audited results, dividend, 1:2 bonus, ESOP 2026, Rs 2,500 crore fund-raising enabling approval, Bahram Vakil appointed · NSE (company filing, nsearchives.nseindia.com) · Tier 1: company or exchange filing · 22 Apr 2026
- S38Allotment of 1:2 bonus equity shares (share count 53,32,32,301) · NSE (company filing, nsearchives.nseindia.com) · Tier 1: company or exchange filing · 5 Jun 2026
- S39Postal ballot voting results (bonus issue, ESOP 2026, capital clause) · NSE (company filing, nsearchives.nseindia.com) · Tier 1: company or exchange filing · 27 May 2026
- S40Outcome of board meeting 6 Aug 2026: Q1 FY27 results; statutory auditor rotation (B S R & Co. LLP proposed from the 75th AGM, 2027) · NSE (company filing, nsearchives.nseindia.com) · Tier 1: company or exchange filing · 6 Aug 2026
- S41Change in directors: Noel N. Tata retires as Chairman (close of 11 Nov 2026); Bahram Vakil Chairman from 12 Nov 2026; Rajiv Dube and Kalpana Merchant appointed · NSE (company filing, nsearchives.nseindia.com) · Tier 1: company or exchange filing · 29 Oct 2026
- S42Resignation of Harish Bhat, non-executive non-independent director (17 Oct 2026) · NSE (company filing, nsearchives.nseindia.com) · Tier 1: company or exchange filing · 18 Oct 2026
- S43Proposed divestment of Netria Property Holdings (step-down subsidiary) to TreBits Investment Trust (SM REIT); binding term sheet 22 Oct 2026 · NSE (company filing, nsearchives.nseindia.com) · Tier 1: company or exchange filing · 23 Oct 2026
- S46Outcome of board meeting 26 Mar 2026: NCDs up to Rs 500 crore approved · NSE (company filing, nsearchives.nseindia.com) · Tier 1: company or exchange filing · 26 Mar 2026
- S49Inditex Trent Retail India buyback accepted: 94,900 shares for Rs 146.35 crore; Trent stake now 20% · NSE (company filing, nsearchives.nseindia.com) · Tier 1: company or exchange filing · 21 Nov 2025
- S50Inditex Trent Retail India buyback offer (Trent holding 34.94%) · NSE (company filing, nsearchives.nseindia.com) · Tier 1: company or exchange filing · 7 Nov 2025
- S51Booker India to acquire 100% of THPL Support Services Ltd from Trent Hypermarket (related-party, arm's length) · NSE (company filing, nsearchives.nseindia.com) · Tier 1: company or exchange filing · 19 Mar 2025
- S52Sale of shares in Massimo Dutti India (stake 49% to 20%) to Grupo Massimo Dutti for Rs 20.75 crore · NSE (company filing, nsearchives.nseindia.com) · Tier 1: company or exchange filing · 6 Feb 2025
- S53Inditex Trent Retail India buyback offer of Aug 2024 (Trent holding 49%) · NSE (company filing, nsearchives.nseindia.com) · Tier 1: company or exchange filing · 9 Aug 2024
- S54Opening of first Zudio store in Dubai, UAE (Trent Global Trading LLC) · NSE (company filing, nsearchives.nseindia.com) · Tier 1: company or exchange filing · 30 Aug 2024
- S55GST penalty order Rs 41,830 (Raipur, FY2018-19) · NSE (company filing, nsearchives.nseindia.com) · Tier 1: company or exchange filing · 2 May 2024
- S56GST penalty order Rs 8,30,391 (Pune, FY2019-20) · NSE (company filing, nsearchives.nseindia.com) · Tier 1: company or exchange filing · 21 Aug 2024
- S57Customs (CBIC) fine Rs 9,80,930 (data transmission glitch) · NSE (company filing, nsearchives.nseindia.com) · Tier 1: company or exchange filing · 26 Aug 2024
- S58GST penalty order Rs 4,82,220 (Ahmedabad, FY2019-20) · NSE (company filing, nsearchives.nseindia.com) · Tier 1: company or exchange filing · 31 Aug 2024
- S59BSE and NSE fines Rs 4,720 each (director above 75 years, 2 days) · NSE (company filing, nsearchives.nseindia.com) · Tier 1: company or exchange filing · 26 Nov 2024
- S60Shoppers Stop Ltd: Q4 FY26 and FY26 consolidated results, XBRL (peer) · NSE (Shoppers Stop filing, nsearchives.nseindia.com) · Tier 1: company or exchange filing · 5 May 2026
- S61Aditya Birla Fashion and Retail Ltd: Q4 FY26 and FY26 consolidated results, XBRL (peer) · NSE (Aditya Birla Fashion and Retail filing, nsearchives.nseindia.com) · Tier 1: company or exchange filing · 25 May 2026
Changes to this page (v1 · 11 Nov 2026)
- v1 · 11 Nov 2026First version. (first version)
Numbers come only from tier 1 and tier 2 sources. Read how we research.
Disclaimer
For learning only. Cityfort is not a SEBI-registered adviser and does not recommend buying or selling any security. Prices shown are dated and may be out of date.
Investing in securities involves risk, including loss of capital. Before making any investment decision, do your own research and consider consulting a SEBI-registered investment adviser.
Cityfort, its owners and contributors may or may not hold securities of companies covered. Content is not an offer or solicitation to buy or sell any security.
Read the full disclaimerHide the full disclaimer
Cityfort publishes educational content that explains how listed companies work. Cityfort is not registered with the Securities and Exchange Board of India (SEBI) as an Investment Adviser or Research Analyst and does not provide investment advice, recommendations, ratings, price targets or any opinion on whether to buy, sell or hold any security.
All information is taken from publicly available sources, mainly company filings on BSE and NSE, which are listed on each page with dates. We work to keep it accurate and correct errors publicly, but we do not guarantee that it is complete, accurate or up to date. Any market price or price-based ratio shown is dated, may be out of date by the time you read it, and is included only to explain concepts.
Statements by company management are reported as statements, with their date and source; they are not our forecasts.