Oil, Gas & Consumable Fuels · NSE: ONGC · BSE: 500312
ONGC: how the business works
ONGC pumps crude oil and gas in India and abroad and owns most of refiners HPCL and MRPL; FY26 group revenue was ₹662,247 crore.
Follow ONGC
Email me when ONGC's page is updated after results.
We store your email address with Kit, our email provider, which also records when you sign up and whether you open or click our emails. We send a confirmation email first. See our privacy policy.
Oil and Natural Gas Corporation Limited · New Delhi · Founded 1955
Updated for Q2 FY27 · checked
- Revenue, FY26 (consolidated, incl. excise duty)
- ₹662,247 cr
- Profit to ONGC shareholders, FY26
- ₹41,424 cr
- Share of India's oil and gas output, FY26 (company figure, incl. joint ventures)
- 64.4%
- Employees, FY26 (annual report)
- 23,117
- Government of India holding, Sep 2026
- 58.89%
The short version
ONGC in 5 points
1 · What it sells
ONGC produces crude oil and natural gas in India and abroad and, through HPCL and MRPL, refines and sells fuels; its FY26 group revenue was ₹662,247 crore.
2 · Who pays it
In FY26, buyers of HPCL's and MRPL's fuels paid 79.0% of the ONGC group's gross segment revenue, refiners and gas companies buying ONGC's Indian crude and gas 17.9%, petrochemical buyers 1.9% and buyers of its overseas oil and gas 1.1%.
3 · What it keeps from ₹100
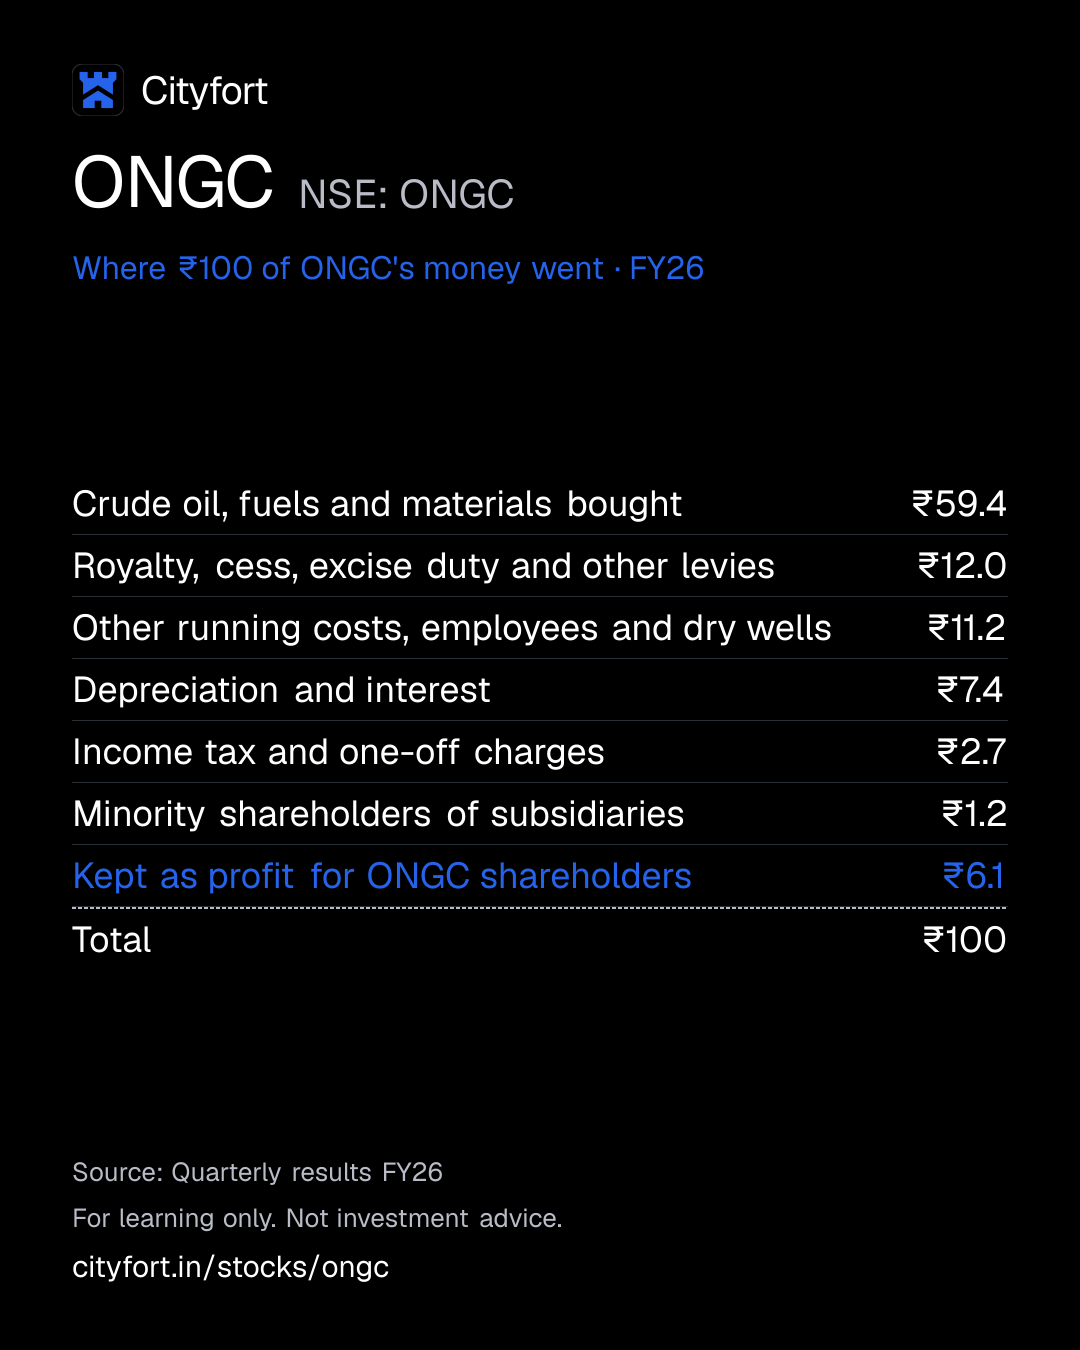
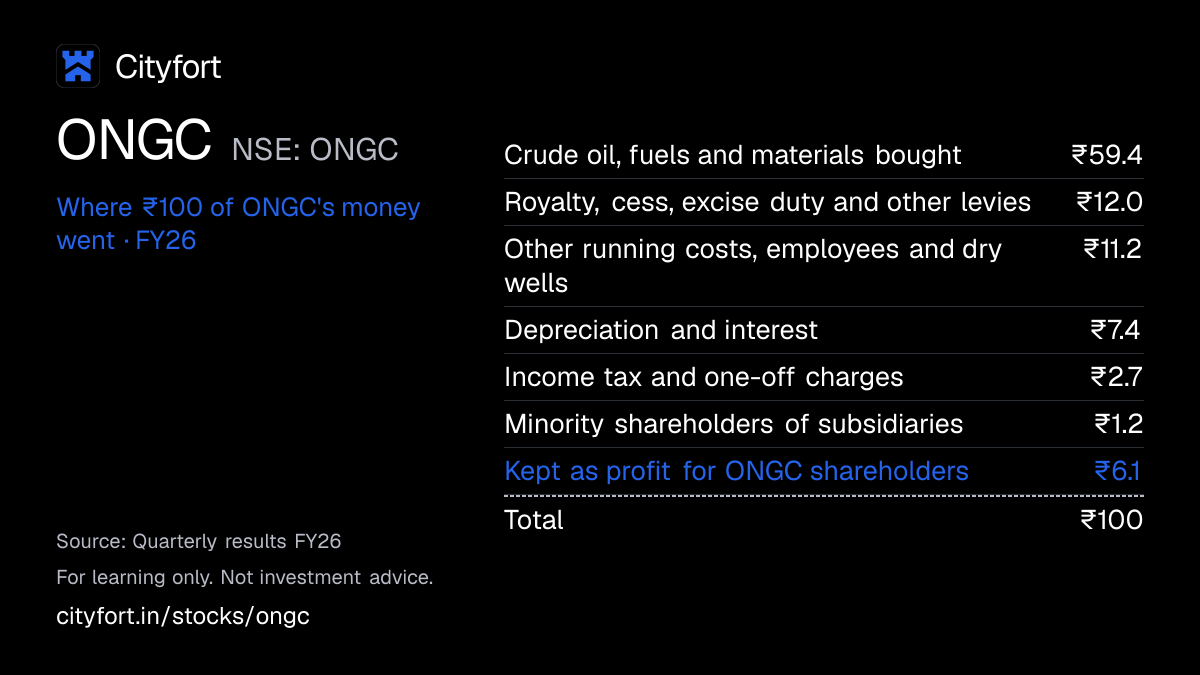
Of every ₹100 that came in during FY26, including ₹12,357 crore of other income, ONGC kept ₹6.1 as profit for its own shareholders after ₹59.4 for crude, fuels and materials and ₹12.0 for levies; its operating profit before interest, tax and depreciation (EBITDA), which leaves other income out, was ₹105,686 crore.
4 · Where the operating profit comes from
Oil and gas production in India and abroad earned ₹42,199 crore, or 59.9%, of ONGC's ₹70,481 crore FY26 segment profit, while refining and marketing earned ₹28,664 crore and petrochemicals lost ₹382 crore.
5 · The one thing to watch
In Q1 FY27, after crude prices jumped, ONGC's offshore segment earned ₹19,298 crore while its refining and marketing segment lost ₹16,155 crore.
Sources: From ONGC's FY26 annual report, its Q4 FY26 and Q2 FY27 results and its Q1 FY27 earnings call · checked
01Where the money goes · FY26
Where does ₹100 of ONGC's money go?
ONGC · FY26
Receipt for every ₹100
| Crude oil, fuels and materials bought | ₹59.4 |
|---|---|
| Royalty, cess, excise duty and other levies | ₹12.0 |
| Other running costs, employees and dry wells | ₹11.2 |
| Depreciation and interest | ₹7.4 |
| Income tax and one-off charges | ₹2.7 |
| Minority shareholders of subsidiaries | ₹1.2 |
| Kept as profit for ONGC shareholders | ₹6.1 |
| Total | ₹100 |
Each line = amount ÷ total money in × 100. Lines may not add to exactly ₹100 because of rounding.
How this is worked out
Money in for FY26 = revenue ₹662,247 crore + other income ₹12,357 crore + joint-venture profit share ₹3,002 crore = ₹677,606 crore. Cityfort calculation from the FY26 annual report and Q4 FY26 results.
Save this receipt as an image
Embed this receipt or the key numbers
Paste this code into a blog or website to show the card you choose, with a link back to this page.
Each week: the next company due to report results, explained in 5 points.
We'll email you once a week with what changed on Cityfort. Facts only, no tips. Unsubscribe any time.
We store your email address with Kit, our email provider, which also records when you sign up and whether you open or click our emails. We send a confirmation email first. See our privacy policy.
02The business in one line
What does ONGC do?
Refiners and fuel buyers pay the ONGC group for crude, gas and fuels; materials take ₹59.4 of every ₹100, levies ₹12.0, and ₹6.1 is profit.
- Refining through HPCL and MRPL was 79.0% of ONGC's FY26 gross segment revenue. Oil and gas production earned 59.9% of segment profit.
- ONGC owns 54.9% of HPCL and 71.63% of MRPL. So ₹8,369 crore of FY26 group profit belonged to minority shareholders of its subsidiaries.
03Who pays it
Who pays ONGC?
Buyers of fuels from HPCL and MRPL
79%
of revenue
HPCL and MRPL refine crude and sell fuels and other products. Shares here are of FY26 gross segment revenue, which counts sales between group companies.
Refiners and gas companies buying ONGC's Indian crude and gas
17.9%
of revenue
ONGC names Indian Oil, BPCL, HPCL, MRPL and GAIL as major buyers. Offshore fields gave 12.5% and onshore fields 5.4%.
Petrochemical buyers
1.9%
of revenue
Buy petrochemicals from OPaL.
Buyers of ONGC Videsh's overseas oil and gas
1.1%
of revenue
Buy crude and gas from ONGC Videsh's fields outside India.
- Buyers of fuels from HPCL and MRPL79%
- Refiners and gas companies buying ONGC's Indian crude and gas17.9%
- Petrochemical buyers1.9%
- Buyers of ONGC Videsh's overseas oil and gas1.1%
How spread out the customers are
No single customer gave the ONGC group 10% or more of FY26 revenue. On its own, ONGC got more than 90% of FY26 revenue (₹127,085 crore) from public sector companies.
04How it makes money
How does ONGC make money?
ONGC's oil fields earn more when crude prices rise, while its refiners can lose.
About 63% of ONGC's own gross revenue comes from crude and gas, India Ratings says. HPCL and MRPL buy crude to make fuels. In Q1 FY27, as crude rose, offshore earned ₹19,298 crore and refining and marketing lost ₹16,155 crore.
Oil and gas production's share of segment profit
78.8%59.9%
FY22 to FY26
- ONGC pumps crude and gas from fields the government gave it or it won in bidding.
- Crude sells at US-dollar prices: ONGC realised US$92.33 a barrel in Q2 FY27.
- Most gas sells at a government-set price: US$7.00 per mmbtu in Q2 FY27.
- HPCL and MRPL buy crude and sell fuels; dearer crude cut their profit in Q1 FY27.
- Oil and gas earned 59.9% of FY26 segment profit; refining and marketing earned 40.7%.
- Cash pays for drilling and dividends: ₹53,990 crore capex and ₹16,980 crore dividends in FY26.
↺ Step 6 feeds back into step 1.
05Business segments · FY26
Which businesses make up ONGC?
Oil and gas, India offshore
12.5%Oil and gas from fields under the sea, such as Mumbai High.
Revenue ₹92,406 cr · Operating profit ₹34,008 cr
Oil and gas, India onshore
5.4%Oil and gas from ONGC's fields on land in India.
Revenue ₹39,778 cr · Operating profit ₹5,955 cr
Refining and marketing
79%HPCL (54.9% owned) and MRPL (71.63%) refine crude and sell fuels.
Revenue ₹584,346 cr · Operating profit ₹28,664 cr
Petrochemicals
1.9%OPaL's petrochemicals. Shown from FY24, after OPaL was combined into the accounts; FY22–FY23 show 0.
Revenue ₹14,214 cr · Operating profit −₹382 cr
Oil and gas, outside India
1.1%ONGC Videsh's oil and gas fields abroad, such as Sakhalin-1 in Russia.
Revenue ₹8,443 cr · Operating profit ₹2,236 cr
How the mix changed
- Oil and gas, India offshore
- Oil and gas, India onshore
- Refining and marketing
- Petrochemicals
- Oil and gas, outside India
Revenue by segment, FY22 to FY26.
₹ crore
See the numbers
Sources (6)
06The numbers · Consolidated · ₹ crore
How has ONGC done?
Revenue
₹662,247 crFY26
Revenue was ₹662,247 crore in FY26, close to FY25's ₹663,261 crore, and reached ₹204,987 crore in Q1 FY27 as crude prices rose.
₹ crore
See the numbers
Net profit
₹41,424 crFY26
Profit for ONGC shareholders ranged from ₹36,226 crore (FY25) to ₹49,144 crore (FY24); FY23 and FY24 are restated figures.
₹ crore
See the numbers
Net profit for every ₹100 of revenue
₹6.3FY26
FY26 EBITDA was ₹105,686 crore, or ₹16.0 per ₹100 of revenue; net profit per ₹100 was ₹6.3, against ₹5.4–₹8.6 in FY22–FY25.
Net margin: ₹ of net profit per ₹100 of revenue
See the numbers
Free cash flow
₹58,729 crFY26
Free cash flow rose to ₹58,729 crore in FY26 from ₹35,181 crore in FY25, as operating cash flow reached ₹112,719 crore.
₹ crore · cash from operations minus spending on plants and equipment
See the numbers
See all yearly numbers
EBITDA = profit before interest, tax and wear-and-tear of assets. Financial year runs April to March (March year end). Net profit is the share belonging to the company's owners. Total net income differs from net profit to the company's owners: Includes ₹8,369 crore of profit belonging to minority shareholders of subsidiaries such as HPCL and MRPL.
Sources (14)
- Integrated Annual Report FY23 (FY22 comparatives)
- Integrated Annual Report FY24 (FY23 restated comparatives)
- Audited financial results Q4 FY24 and FY24
- Integrated Annual Report FY25 (FY24 restated comparatives)
- Audited financial results Q4 FY25 and FY25 (FY24 restated)
- Integrated Annual Report FY26
- Audited financial results Q4 FY26 and FY26
- Unaudited financial results Q3 FY26
- Unaudited financial results Q3 FY25
- Unaudited financial results Q1 FY27
- Unaudited financial results Q1 FY26
- Unaudited financial results Q2 FY27 (quarter and half year ended 30 Sep 2026)
- Unaudited financial results Q2 FY26
- Q2 FY27 consolidated results, XBRL (integrated filing)
07Who runs it
Who runs ONGC, and did they deliver?
Arun Kumar Singh
Chairman & CEO
Due to hand over to Sunil Kumar on or after 7 Dec 2026.
Sunil Kumar
Chairman-designate (Executive Director, ONGC)
Approved by the government's Appointments Committee of the Cabinet as Chairman from on or after 7 Dec 2026.
Anupam Agarwal
Director (Finance) & Chief Financial Officer · since 2026
CFO from 25 Jun 2026.
Satyan Kumar
Director (Strategy & Corporate Affairs) · since 2026
Key managerial person from 25 Jun 2026.
Shashi Bhushan Singh
Company Secretary
What they said, and what happened
2 missed · 3 too early to tell
Said on 11 Nov 2025
Management said in the Q2 FY26 call that ONGC's own (standalone) gas output for FY26 would be 20 billion cubic metres (BCM).
MissedWhat happened
ONGC's standalone gas output in FY26 was 19.53 BCM.
Said on 11 Nov 2025
Management said in the Q2 FY26 call that gas from deepwater block KG-98/2 would ramp up by end-Q4 FY26.
MissedWhat happened
In the Q3 FY26 call ONGC expected gas flow from Apr–Jun 2026. ONGC said Q1 and Q2 FY27 output was hit by reservoir complexities in KG-98/2.
Said on 27 May 2026
Management said in the Q4 FY26 call that OPaL's internal FY27 target is ₹1,500–2,000 crore of EBITDA.
Too early to tellWhat happened
Management said OPaL's EBITDA was −₹57 crore in Q1 FY27.
Said on 5 Aug 2026
Management said in the Q1 FY27 call that FY27 standalone oil and gas output would be about 39 million tonnes.
Too early to tellWhat happened
H1 FY27 standalone output was 18.960 million tonnes, against 19.581 a year earlier.
Said on 5 Aug 2026
Management said in the Q1 FY27 call that Mozambique LNG (Area 1) would start producing in late FY28 or early FY29.
Too early to tellWhat happened
Due in FY28–FY29.
Sources (8)
- Integrated Annual Report FY26
- Letter from MoPNG: ACC approves Shri Sunil Kumar as Chairman from on/after 7 Dec 2026
- Board outcome: Anupam Agarwal, Director (Finance), appointed CFO in place of Yogish Nayak S.
- Q2 FY26 earnings call transcript
- Q3 FY26 earnings call transcript (call 13 Feb 2026)
- Q1 FY27 earnings call transcript (call 5 Aug 2026)
- Press release: ONGC declares results for Q2 FY'27
- Q4 FY26 earnings call transcript (call 27 May 2026)
08What could go wrong
What could go wrong for ONGC?
- Raw-material prices
Oil price swings
India Ratings says about 63% of ONGC's own gross revenue comes from crude and gas. Brent averaged about US$69 a barrel in FY26, against US$76.9 in FY25.
Watch ONGC's realised crude price each quarter (US$92.33 a barrel in Q2 FY27).
- Pricing
Refiners lose when crude jumps
In Q1 FY27 refining and marketing lost ₹16,155 crore while offshore earned ₹19,298 crore. Management said HPCL lost ₹12,265 crore from selling fuel below cost.
Watch Refining and marketing segment result each quarter (₹9,807 crore in Q2 FY27).
- Execution
Output from old fields is falling
ONGC's own crude fell from 19.54 to 19.33 million tonnes, and gas from 20.91 to 19.53 BCM, in FY22–FY26. H1 FY27 output fell again; ONGC cited KG-98/2 and pipeline delays.
Watch Standalone oil and gas output each quarter, against the FY27 aim of about 39 million tonnes.
- Regulation
The government sets key prices and taxes
Most of ONGC's gas sells at a government-set price, US$7.00 per mmbtu in Q2 FY27. A special additional excise duty on crude ended from 2 Dec 2024, management said.
Watch Changes to the government gas price or new taxes on crude.
- Legal
Large disputed claims
Auditors highlighted a Panna-Mukta-Tapti arbitration demand by the oil regulator DGH of US$1,624.05 million (₹15,225 crore, ONGC's share). ONGC treats it as a contingent liability.
Watch Rulings in the Panna-Mukta-Tapti arbitration.
- Other
Assets in Russia and Venezuela
ONGC Videsh did not receive Sakhalin-1 accounts for Jan 2023 to Mar 2025. It also holds 26% of Vankorneft in Russia and stakes in Venezuelan associates.
Watch Notes on Sakhalin-1, Vankorneft and Venezuela in each results filing.
- Execution
Safety incidents
Well Mori-5, run by contractor Deep Industries, blew out in Jan 2026; a stop-production order followed in Apr 2026. A fire hit Mumbai High's SHP platform on 3 Apr 2026.
Watch Incidents and regulator orders disclosed in ONGC's filings.
- Debt
Heavy spending and rising borrowings
Group capital spending was ₹61,131 crore in FY26. Borrowings rose to ₹152,473 crore on 30 Sep 2026 from ₹142,055 crore in March.
Watch Borrowings and free cash flow each half year.
Sources (12)
- India Ratings affirms ONGC's debt at IND AAA/Stable/IND A1+ (rationale, 29 Oct 2026; enclosed in ONGC's 30 Oct 2026 filing)
- Press release: ONGC declares results for Q2 FY'27
- Unaudited financial results Q2 FY27 (quarter and half year ended 30 Sep 2026)
- Q1 FY27 earnings call transcript (call 5 Aug 2026)
- Integrated Annual Report FY26
- Q4 FY26 earnings call transcript (call 27 May 2026)
- Audited financial results Q4 FY26 and FY26
- Audited financial results Q4 FY25 and FY25 (FY24 restated)
- Unaudited financial results Q3 FY26
- Update on well Mori-5 (Mori field operated by Deep Industries Ltd)
- Reg 30 disclosure: Andhra Pradesh Pollution Control Board stop-production order, well Mori#5
- Press release: fire incident at SHP platform, Mumbai High (3 Apr 2026)
09Supporters and critics
What do supporters and critics point to?
What supporters point to
- Profit for ONGC shareholders rose 55.3% to ₹16,744 crore in Q2 FY27 from a year earlier.
- Free cash flow was ₹58,729 crore in FY26, against ₹16,980 crore of dividends paid.
- Proved reserves rose to 793.31 million tonnes of oil equivalent in FY26; India Ratings gives a 1.17 reserve replacement ratio.
- India Ratings and CARE rate ONGC AAA/Stable; ONGC disclosed on 16 Jul 2026 that Fitch raised its standalone credit profile to bbb+.
- New-well gas sold at US$10.24 per mmbtu in Q2 FY27, against US$7.00 for older fields.
What critics point to
- ONGC's own crude output fell from 19.54 to 19.33 million tonnes, and gas from 20.91 to 19.53 BCM, in FY22–FY26.
- Refining and marketing lost ₹16,155 crore in Q1 FY27 when crude prices rose.
- KG-98/2 gas was due to ramp up by Q4 FY26; ONGC later cited reservoir complexities there.
- India Ratings puts ONGC's standalone contingent liabilities at ₹71,570 crore, including the ₹15,225 crore Panna-Mukta-Tapti demand.
- BSE and NSE fined ONGC over board composition for the quarter to 30 Jun 2026.
10What to watch next
What should you watch next at ONGC?
Next event
Q3 FY27 results (date not announced)
Date not announced yet.
The Q2 FY27 call transcript
Depreciation rose to ₹11,731 crore in Q2 FY27 from ₹9,477 crore in Q1. The results filing and press release give no reason.
Output against the FY27 aim
Standalone oil and gas output was 18.960 million tonnes in H1 FY27. Management said in Aug 2026 it expects about 39 for FY27.
New chairman
Sunil Kumar takes over as Chairman on or after 7 Dec 2026, under a government approval filed on 23 Oct 2026.
11Key facts
Key facts about ONGC
- What does ONGC do?
- Oil and Natural Gas Corporation (ONGC) finds and produces crude oil and natural gas in India and, through ONGC Videsh, abroad. The Government of India controls ONGC, which is based in New Delhi. ONGC also owns 54.9% of refiner HPCL and 71.63% of refiner MRPL. ONGC's FY26 consolidated revenue was ₹662,247 crore.
- How does ONGC make money?
- ONGC makes most of its profit from producing oil and gas. In FY26 oil and gas production earned ₹42,199 crore, or 59.9%, of ONGC's ₹70,481 crore segment profit before interest and tax. Refining and marketing through HPCL and MRPL earned ₹28,664 crore, though it was 79.0% of ONGC's gross segment revenue.
- Who are ONGC's customers?
- ONGC sells its own crude and gas mainly to state-owned firms such as Indian Oil, BPCL, HPCL, MRPL and GAIL. Public sector companies gave ONGC more than 90% of its standalone FY26 revenue. No single customer gave the ONGC group 10% or more of FY26 revenue.
- How big is ONGC?
- In FY26 ONGC's consolidated revenue from operations was ₹662,247 crore and profit for ONGC shareholders was ₹41,424 crore. Including minority shareholders of subsidiaries such as HPCL, group profit was ₹49,793 crore. ONGC's FY26 annual report gives 23,117 employees.
- Who owns ONGC?
- On 30 Sep 2026 the Government of India, through the President of India, held 58.89% of ONGC, with no shares pledged. LIC held 10.33%, Indian Oil 7.84% and GAIL 2.45%. Foreign investors held 8.56% of ONGC.
- How much oil and gas does ONGC produce?
- In FY26 the ONGC group produced 27.41 million tonnes of crude oil, including condensate, and 22.72 billion cubic metres of natural gas. ONGC Videsh's overseas fields gave 6.91 million tonnes of that crude. ONGC says that it, with its share of joint ventures, produced 64.4% of India's domestic oil and gas in FY26.
- Why does ONGC report two profit figures?
- ONGC's standalone results cover ONGC alone; its consolidated results add HPCL, MRPL, ONGC Videsh and other group companies. For Q2 FY27 ONGC's standalone net profit was ₹15,489 crore. ONGC's consolidated profit for its shareholders was ₹16,744 crore, or ₹18,535 crore including minority shareholders.
- Does ONGC have debt?
- On 31 Mar 2026 the ONGC group had ₹142,055 crore of borrowings and ₹35,286 crore of cash, bank balances and current investments. India Ratings affirmed ONGC's rating at IND AAA/Stable on 29 Oct 2026.
- What dividend did ONGC pay for FY26?
- ONGC declared dividends of ₹13.25 per share for FY26, which was 40.2% of its consolidated basic earnings per share of ₹32.93. For FY27, ONGC declared an interim dividend of ₹8 per share on 5 Nov 2026.
Sources (7)
- Integrated Annual Report FY26
- Shareholding pattern as on 30 Sep 2026 (XBRL filed with NSE)
- Audited financial results Q4 FY26 and FY26
- Corporate presentation, post-AGM media interaction (31 Aug 2026)
- Press release: ONGC declares results for Q2 FY'27
- Unaudited financial results Q2 FY27 (quarter and half year ended 30 Sep 2026)
- India Ratings affirms ONGC's debt at IND AAA/Stable/IND A1+ (rationale, 29 Oct 2026; enclosed in ONGC's 30 Oct 2026 filing)
Terms on this page
- Capital expenditure (capex)
- Credit rating
- Dividend payout ratio
- EBITDA
- FII and DII holding
- Free cash flow
- Market capitalisation
- Net debt
- Net profit
- Operating margin
Each explains the term in plain English, with the same number from other companies on Cityfort.
Go deeper
More detail from the same filings. Open any section.
12What it sells
12What it sells
What does ONGC sell?
Crude oil from Indian fields
ONGC sold 18.79 million tonnes of crude in FY26, for ₹83,810 crore, mostly to Indian refiners (standalone figures).
Natural gas
ONGC sold 15.491 billion cubic metres of gas in FY26, for ₹36,330 crore (standalone). The government sets the price of most of it.
Value-added products
LPG, naphtha, ethane and similar products made while processing oil and gas: 9.0% of ONGC's standalone FY26 revenue.
Fuels through HPCL and MRPL
The refining and marketing segment had FY26 gross revenue of ₹584,346 crore. HPCL and MRPL processed about 43 million tonnes of crude in FY26.
Petrochemicals through OPaL
OPaL, 95.69% owned by ONGC, makes petrochemicals. Its segment had FY26 revenue of ₹14,214 crore.
Oil and gas abroad through ONGC Videsh
Wholly owned ONGC Videsh produced 6.91 million tonnes of crude and 2.76 billion cubic metres of gas from overseas fields in FY26.
Think of it like this
Like a farmer who owns a flour mill: dearer grain helps the farm but costs the mill more.
What it does
- Does: Explores for and produces oil and gas on land and under the sea in India
- Does: Sells crude to Indian refiners and gas to gas companies
- Does: Owns majority stakes in refiners HPCL and MRPL, which sell fuels
- Does: Produces oil and gas abroad through ONGC Videsh
What it does not do
- Does not: Set the price of most of its gas: the government-set price was US$7.00 per mmbtu in Q2 FY27
- Does not: Own HPCL outright: it holds 54.9%, so part of HPCL's profit belongs to HPCL's other shareholders
- Does not: Count Indian Oil and GAIL as promoters: their 10.30% stake sits in the public category
13How the money flows
13How the money flows · FY26
How does money flow through ONGC?
Money in
- Revenue from operations (incl. excise duty)₹662,247 cr
- Share of profit from joint ventures and associates, such as Petronet LNG₹3,002 cr
- Other income₹12,357 cr
The company
ONGC
₹677,606 cr came in
Money out
- Crude oil, fuels and materials bought₹402,335 cr
- Royalty, cess, excise duty and other levies₹81,130 cr
- Other running costs, employees and dry-well write-offs₹75,663 cr
- Depreciation and interest₹50,420 cr
- Income tax and one-off charges₹18,266 cr
- Profit for minority shareholders of subsidiaries, such as HPCL₹8,369 cr
- Net profit for ONGC shareholders₹41,424 cr
- In FY26 the ONGC group brought in ₹662,247 crore of revenue, plus ₹12,357 crore of other income.
- Joint ventures and associates added ₹3,002 crore as ONGC's share of their profit.
- Crude oil, fuels and materials bought took ₹402,335 crore. Royalty, cess, excise duty and other levies took ₹81,130 crore.
- Other running costs, staff and dry wells took ₹75,663 crore. Depreciation and interest took ₹50,420 crore, and tax and one-offs ₹18,266 crore.
- Minority shareholders of subsidiaries got ₹8,369 crore. That left ₹41,424 crore of profit for ONGC's shareholders.
14What it needs to run
14What it needs to run
What does ONGC need to run?
Oil and gas fields
Blocks the government gave ONGC directly (nomination blocks) plus blocks won in bidding rounds, India Ratings notes. Proved reserves were 793.31 million tonnes of oil equivalent in FY26.
Drilling and platforms
Group capital spending was ₹61,131 crore in FY26, including subsidiaries, ONGC's FY26 annual report says.
Refineries
HPCL processed 26.04 million tonnes of crude and MRPL 17.0 million tonnes in FY26.
People
The FY26 annual report gives 23,117 employees. The BRSR counts 14,063 permanent employees and lists workers separately.
Technical partners
bp became technical services provider for ONGC's western offshore fields on 25 Jun 2026.
Sources (5)
- India Ratings affirms ONGC's debt at IND AAA/Stable/IND A1+ (rationale, 29 Oct 2026; enclosed in ONGC's 30 Oct 2026 filing)
- Integrated Annual Report FY26
- Corporate presentation, post-AGM media interaction (31 Aug 2026)
- Business Responsibility and Sustainability Report FY26
- ONGC and bp sign Technical Services Contract for Western Offshore fields
15Where it sells
15Where it sells · FY26
Where does ONGC sell?
- India92.1%
- Outside India (incl. special economic zones)7.9%
Sources (1)
16Where growth could come from
16Where growth could come from
Where could ONGC's growth come from?
Management said in the Q1 FY27 call (5 Aug 2026) it expects about 39 million tonnes of standalone oil and gas output in FY27. FY26 output was 38.87 million tonnes. It said capex would stay at US$3.5–4 billion a year. ONGC's 31 Aug 2026 presentation gives planned standalone FY27 capex of ₹30,000 crore.
Gas from new wells
WorkingOver 34% of nomination-gas revenue, H1 FY27
New-well gas sold at US$10.24 per mmbtu (a unit of gas energy) in Q2 FY27. Older fields got US$7.00. It brought in ₹7,050 crore in H1 FY27.
Status: Working, on track against what the company said.
KG-98/2 deepwater gas
BehindHit by reservoir complexities, Q1–Q2 FY27
Management said in Feb 2026 it expected 5–6 MMSCMD (million standard cubic metres a day) by the end of FY27. ONGC said output in Q1 and Q2 FY27 was hit by reservoir problems.
Status: Behind, behind the company's own plan.
Western offshore with bp
Newbp contract signed 25 Jun 2026
bp is technical services provider for ONGC's western offshore fields. In Q2 FY27 ONGC awarded two western offshore projects of about ₹11,800 crore.
Status: New, recently announced.
Daman Upside gas (DUDP)
EarlyFirst gas 29 Mar 2026
Management said in Aug 2026 that DUDP would add about 2 MMSCMD of gas by December.
Status: Early, too early to judge.
OPaL petrochemicals
BehindFY26 EBITDA ₹1,206 crore vs ₹1,500 crore promised
OPaL's plant use fell to 84% in FY26 from 93% in FY25. The petrochemicals segment lost ₹382 crore in FY26.
Status: Behind, behind the company's own plan.
Renewable power
Early2.853 GW, Aug 2026
ONGC says it aims for about 10 GW of renewable capacity by 2030 and net zero by 2038.
Status: Early, too early to judge.
Status compares progress with what the company itself said it would do: Working = on track against what the company said; Mixed = partly on track; Behind = behind the company's own plan; New = recently announced; Early = too early to judge.
Sources (8)
- Q1 FY27 earnings call transcript (call 5 Aug 2026)
- Corporate presentation, post-AGM media interaction (31 Aug 2026)
- Press release: ONGC declares results for Q2 FY'27
- Q3 FY26 earnings call transcript (call 13 Feb 2026)
- ONGC and bp sign Technical Services Contract for Western Offshore fields
- Monetisation of Daman Upside Development Project (DUDP), first gas 29 Mar 2026
- Q4 FY26 earnings call transcript (call 27 May 2026)
- Audited financial results Q4 FY26 and FY26
17Financial strength and debt
17Financial strength · 31 Mar 2026
How much debt does ONGC have?
- Total debt₹142,055 cr
- Cash and investments₹35,286 cr
- Net debt (debt minus cash)₹106,769 cr
- Net worth (shareholders' money)₹371,768 cr
- Debt to equity
- 0.35×
- ₹ of debt for every ₹1 of shareholders' money
- Interest cover
- 8.1×
- how many times operating profit covers interest
- On 30 Sep 2026 borrowings were ₹152,473 crore and cash, bank balances and current investments ₹58,909 crore. Net debt was ₹93,564 crore.
- Lease liabilities were a further ₹32,261 crore on 31 Mar 2026, not counted in debt here.
- Cash and investments leave out ONGC's shares in Indian Oil and GAIL. India Ratings values them at about ₹31,600 crore.
- India Ratings puts ONGC's standalone contingent liabilities (claims it disputes) at ₹71,570 crore at 31 Mar 2026.
- Debt ÷ equity uses total equity including minority shareholders, as ONGC reports it. Interest cover = FY26 EBITDA ÷ finance costs.
18Who owns it
18Who owns it · Q2 FY27
Who owns ONGC?
- Promoters (founders or parent company)58.9%
- Foreign institutions (FII)8.6%
- Indian institutions (DII)18.7%
- Public and others13.9%
Promoter pledge
No promoter shares were pledged in Q2 FY27.
How ownership changed
* Pledged = share of the promoters' own holding reported as pledged. In older filings this can include shares “otherwise encumbered”; the governance flags say when.
† Others = Indian Oil (7.84%) and GAIL (2.45%), government-controlled companies in the public category.
Sources (12)
- Shareholding pattern as on 30 Sep 2026 (XBRL filed with NSE)
- Shareholding pattern as on 30 Jun 2026 (XBRL filed with NSE)
- Shareholding pattern as on 31 Mar 2026 (XBRL filed with NSE)
- Shareholding pattern as on 31 Dec 2025 (XBRL filed with NSE)
- Shareholding pattern as on 30 Sep 2025 (XBRL filed with NSE)
- Shareholding pattern as on 30 Jun 2025 (XBRL filed with NSE)
- Shareholding pattern as on 31 Mar 2025 (XBRL filed with NSE)
- Shareholding pattern as on 31 Dec 2024 (XBRL filed with NSE)
- Shareholding pattern as on 30 Sep 2024 (XBRL filed with NSE)
- Shareholding pattern as on 30 Jun 2024 (XBRL filed with NSE)
- Shareholding pattern as on 31 Mar 2024 (XBRL filed with NSE)
- Shareholding pattern as on 31 Dec 2023 (XBRL filed with NSE)
19What it does with profit
19What it does with profit
What does ONGC do with its profit?
Dividend per share
₹13.25FY26
Dividend paid for each share, by financial year.
₹ per share
See the numbers
No buybacks or fund raises in the period covered.
Sources (1)
20Governance signals
20Governance signals
What do ONGC's governance filings show?
- Auditor
- T R Chadha & Co LLP, PKF Sridhar & Santhanam LLP, Suri & Co and A R & Co (joint statutory auditors for FY27, appointed by the C&AG), since 2026
- Auditor changes
- 8 Sep 2026: Laxmi Tripti & Associates, Manubhai & Shah LLP, V Sankar Aiyar & Co., Talati & Talati LLP and Rama K Gupta & Co. (FY26) → T R Chadha & Co LLP, PKF Sridhar & Santhanam LLP, Suri & Co and A R & Co (FY27) (The Comptroller and Auditor General of India (C&AG) appoints ONGC's statutory auditors each year.)
- Audit qualifications
- None reported
- Related-party dealings
- Sales to related parties were 30.35% of ONGC's standalone sales in FY26, down from 32.79% in FY25, according to its BRSR.
- Credit rating
- India Ratings IND AAA (long term), IND A1+ (short term) (outlook Stable), 29 Oct 2026
A credit rating describes the company's ability to repay debt. It is not a rating of the share.
Flags to know about
regulatory · 25 Aug 2026
Exchange fines over board composition
BSE and NSE each fined ONGC ₹14,31,340 (incl. GST) on 25 Aug 2026 over board and committee composition in the quarter to 30 Jun 2026. ONGC said director appointments rest with the Government of India and sought a waiver.
auditor · 26 May 2026
Emphasis of matter in the FY26 audit
The FY26 consolidated audit opinion was unmodified but highlighted three matters. One is a Panna-Mukta-Tapti arbitration demand of ₹15,225 crore (ONGC's share). The others are disputed service tax/GST on royalty and a ₹2,088 crore excise refund ONGC considers recoverable.
disclosure
Frequent restatements
ONGC restated FY23, FY24 and Q3–Q4 FY25. Reasons included combining OPaL's accounts, a Sakhalin-1 accounting change and reclassifying advances to Venezuelan associates.
disclosure
Sakhalin-1 accounts not received
ONGC Videsh did not receive Sakhalin-1 (Russia) financial statements for Jan 2023 to Mar 2025, its results notes say.
Sources (9)
- Appointment of statutory/joint statutory auditors by C&AG for FY 2026-27
- Integrated Annual Report FY26
- Business Responsibility and Sustainability Report FY26
- India Ratings affirms ONGC's debt at IND AAA/Stable/IND A1+ (rationale, 29 Oct 2026; enclosed in ONGC's 30 Oct 2026 filing)
- Reg 30 disclosure: BSE and NSE fines for board/committee composition, quarter ended 30 Jun 2026
- Audited financial results Q4 FY26 and FY26
- Integrated Annual Report FY24 (FY23 restated comparatives)
- Audited financial results Q4 FY25 and FY25 (FY24 restated)
- Unaudited financial results Q3 FY26
21What the market paid
21What the market paid · price as of 11 Nov 2026
What did the market pay for ONGC on 11 Nov 2026?
Price as of 11 Nov 2026 (shown for education; prices change daily).
Price as of 11 Nov 2026: ₹234.80 at the NSE close. On 1,258.03 crore shares, the market value was ₹295,385 crore (Cityfort calculation). P/E divides the price by FY26 earnings per share (₹32.93). P/B divides it by shareholders' equity per share on 30 Sep 2026 (₹318.41). The FY26 dividend of ₹13.25 a share was 5.6% of that price. The 11 Nov price still carried the ₹8 interim dividend (record date 12 Nov 2026).
- Share price
- ₹234.80
- Market value (market cap)
- ₹295,385 cr
- P/E
- 7.1×
- P/B
- 0.7×
Source: NSE equity bhavcopy, 11 Nov 2026 (ONGC EQ close ₹234.80); Shareholding pattern as on 30 Sep 2026 (XBRL filed with NSE); Integrated Annual Report FY26 and 2 more
22How it got here
22How it got here
How did ONGC get here?
1955
Milestone
Started as a government oil unit
ONGC began in 1955 as the oil and gas division of the Geological Survey of India, India Ratings notes.
1994
Milestone
Became a corporation
It became a directorate, then a commission, and in 1994 a corporation.
2024
Business-model change
OPaL became a subsidiary
On 12 Sep 2024 ONGC raised its stake in petrochemical maker OPaL from 49.36% to 91.16%.
2025
Milestone
Named to run block CB-OS/2
In a letter dated 19 Sep 2025, disclosed by ONGC on 22 Sep 2025, the government did not extend the CB-OS/2 contract. It named ONGC to take control. ONGC took over on 22 Jul 2026.
2026
Crisis
Mori-5 well blowout
A blowout and fire hit well Mori-5 in Jan 2026. Deep Industries, ONGC's contractor, operated the field.
2026
Milestone
Deepwater pact with Reliance
ONGC and Reliance agreed in Jan 2026 to share deepwater resources on India's east coast.
2026
Milestone
Daman Upside first gas
First gas flowed on 29 Mar 2026, under two years from the contract award, ONGC said.
2026
Crisis
Fire at a Mumbai High platform
A fire at the SHP platform on 3 Apr 2026 caused 10 minor injuries. ONGC said operations returned to normal.
2026
Business-model change
bp brought in for western offshore
On 25 Jun 2026 ONGC signed bp as technical services provider for its western offshore fields.
2026
Crisis
West Asia crisis lifts crude
Crude prices jumped in Q1 FY27. Management said HPCL lost ₹12,265 crore that quarter.
Sources (11)
- India Ratings affirms ONGC's debt at IND AAA/Stable/IND A1+ (rationale, 29 Oct 2026; enclosed in ONGC's 30 Oct 2026 filing)
- Audited financial results Q4 FY25 and FY25 (FY24 restated)
- Direction by Government of India on block CB-OS/2 (PSC extension not accepted; ONGC to take control as Government nominee)
- Press release: ONGC declares results for Q2 FY'27
- Update on well Mori-5 (Mori field operated by Deep Industries Ltd)
- Reg 30 disclosure: Andhra Pradesh Pollution Control Board stop-production order, well Mori#5
- ONGC and Reliance sign agreement to share deepwater resources on India's east coast
- Monetisation of Daman Upside Development Project (DUDP), first gas 29 Mar 2026
- Press release: fire incident at SHP platform, Mumbai High (3 Apr 2026)
- ONGC and bp sign Technical Services Contract for Western Offshore fields
- Q1 FY27 earnings call transcript (call 5 Aug 2026)
23Sources and changes
Where every number on this page comes from
Sources (47 documents)
- S1Integrated Annual Report FY26 · Oil and Natural Gas Corporation Ltd (filed with BSE) · Tier 1: company or exchange filing · 7 Aug 2026
- S2Integrated Annual Report FY25 (FY24 restated comparatives) · Oil and Natural Gas Corporation Ltd (filed with BSE) · Tier 1: company or exchange filing · 7 Aug 2025
- S3Integrated Annual Report FY24 (FY23 restated comparatives) · Oil and Natural Gas Corporation Ltd (filed with BSE) · Tier 1: company or exchange filing · 7 Aug 2024
- S4Integrated Annual Report FY23 (FY22 comparatives) · Oil and Natural Gas Corporation Ltd (filed with BSE) · Tier 1: company or exchange filing · 5 Aug 2023
- S5Unaudited financial results Q2 FY27 (quarter and half year ended 30 Sep 2026) · Oil and Natural Gas Corporation Ltd (filed with BSE) · Tier 1: company or exchange filing · 5 Nov 2026
- S6Q2 FY27 consolidated results, XBRL (integrated filing) · Oil and Natural Gas Corporation Ltd (filed with NSE) · Tier 1: company or exchange filing · 5 Nov 2026
- S7Unaudited financial results Q1 FY27 · Oil and Natural Gas Corporation Ltd (filed with BSE) · Tier 1: company or exchange filing · 4 Aug 2026
- S8Audited financial results Q4 FY26 and FY26 · Oil and Natural Gas Corporation Ltd (filed with BSE) · Tier 1: company or exchange filing · 26 May 2026
- S9Unaudited financial results Q3 FY26 · Oil and Natural Gas Corporation Ltd (filed with BSE) · Tier 1: company or exchange filing · 12 Feb 2026
- S10Unaudited financial results Q2 FY26 · Oil and Natural Gas Corporation Ltd (filed with BSE) · Tier 1: company or exchange filing · 10 Nov 2025
- S11Unaudited financial results Q1 FY26 · Oil and Natural Gas Corporation Ltd (filed with BSE) · Tier 1: company or exchange filing · 12 Aug 2025
- S12Audited financial results Q4 FY25 and FY25 (FY24 restated) · Oil and Natural Gas Corporation Ltd (filed with BSE) · Tier 1: company or exchange filing · 21 May 2025
- S13Unaudited financial results Q3 FY25 · Oil and Natural Gas Corporation Ltd (filed with BSE) · Tier 1: company or exchange filing · 31 Jan 2025
- S14Audited financial results Q4 FY24 and FY24 · Oil and Natural Gas Corporation Ltd (filed with BSE) · Tier 1: company or exchange filing · 20 May 2024
- S15Press release: ONGC declares results for Q2 FY'27 · Oil and Natural Gas Corporation Ltd (filed with BSE) · Tier 1: company or exchange filing · 5 Nov 2026
- S16Q1 FY27 earnings call transcript (call 5 Aug 2026) · Oil and Natural Gas Corporation Ltd (company website) · Tier 1: company or exchange filing · 12 Aug 2026
- S17Q4 FY26 earnings call transcript (call 27 May 2026) · Oil and Natural Gas Corporation Ltd (company website) · Tier 1: company or exchange filing · 4 Jun 2026
- S18Q3 FY26 earnings call transcript (call 13 Feb 2026) · Oil and Natural Gas Corporation Ltd (company website) · Tier 1: company or exchange filing · 20 Feb 2026
- S19Q2 FY26 earnings call transcript · Oil and Natural Gas Corporation Ltd (company website) · Tier 1: company or exchange filing · 18 Nov 2025
- S20Corporate presentation, post-AGM media interaction (31 Aug 2026) · Oil and Natural Gas Corporation Ltd (company website) · Tier 1: company or exchange filing · 31 Aug 2026
- S21Business Responsibility and Sustainability Report FY26 · Oil and Natural Gas Corporation Ltd (filed with BSE) · Tier 1: company or exchange filing · 7 Aug 2026
- S22India Ratings affirms ONGC's debt at IND AAA/Stable/IND A1+ (rationale, 29 Oct 2026; enclosed in ONGC's 30 Oct 2026 filing) · India Ratings and Research (via ONGC filing with BSE) · Tier 2: rating agency or regulator · 29 Oct 2026
- S23Intimation of credit rating: CARE reaffirms CARE AAA; Stable / CARE A1+ · Oil and Natural Gas Corporation Ltd (filed with BSE) · Tier 1: company or exchange filing · 9 Oct 2026
- S25Shareholding pattern as on 30 Sep 2026 (XBRL filed with NSE) · Oil and Natural Gas Corporation Ltd (filed with NSE) · Tier 1: company or exchange filing · 16 Oct 2026
- S26Shareholding pattern as on 30 Jun 2026 (XBRL filed with NSE) · Oil and Natural Gas Corporation Ltd (filed with NSE) · Tier 1: company or exchange filing · 20 Jul 2026
- S27Shareholding pattern as on 31 Mar 2026 (XBRL filed with NSE) · Oil and Natural Gas Corporation Ltd (filed with NSE) · Tier 1: company or exchange filing · 20 Apr 2026
- S28Shareholding pattern as on 31 Dec 2025 (XBRL filed with NSE) · Oil and Natural Gas Corporation Ltd (filed with NSE) · Tier 1: company or exchange filing · 20 Jan 2026
- S29Shareholding pattern as on 30 Sep 2025 (XBRL filed with NSE) · Oil and Natural Gas Corporation Ltd (filed with NSE) · Tier 1: company or exchange filing · 21 Oct 2025
- S30Shareholding pattern as on 30 Jun 2025 (XBRL filed with NSE) · Oil and Natural Gas Corporation Ltd (filed with NSE) · Tier 1: company or exchange filing · 18 Jul 2025
- S31Shareholding pattern as on 31 Mar 2025 (XBRL filed with NSE) · Oil and Natural Gas Corporation Ltd (filed with NSE) · Tier 1: company or exchange filing · 18 Apr 2025
- S32Shareholding pattern as on 31 Dec 2024 (XBRL filed with NSE) · Oil and Natural Gas Corporation Ltd (filed with NSE) · Tier 1: company or exchange filing · 17 Jan 2025
- S33Shareholding pattern as on 30 Sep 2024 (XBRL filed with NSE) · Oil and Natural Gas Corporation Ltd (filed with NSE) · Tier 1: company or exchange filing · 18 Oct 2024
- S34Shareholding pattern as on 30 Jun 2024 (XBRL filed with NSE) · Oil and Natural Gas Corporation Ltd (filed with NSE) · Tier 1: company or exchange filing · 19 Jul 2024
- S35Shareholding pattern as on 31 Mar 2024 (XBRL filed with NSE) · Oil and Natural Gas Corporation Ltd (filed with NSE) · Tier 1: company or exchange filing · 18 Apr 2024
- S36Shareholding pattern as on 31 Dec 2023 (XBRL filed with NSE) · Oil and Natural Gas Corporation Ltd (filed with NSE) · Tier 1: company or exchange filing · 19 Jan 2024
- S37NSE equity bhavcopy, 11 Nov 2026 (ONGC EQ close ₹234.80) · NSE · Tier 1: company or exchange filing · 11 Nov 2026
- S38Letter from MoPNG: ACC approves Shri Sunil Kumar as Chairman from on/after 7 Dec 2026 · Oil and Natural Gas Corporation Ltd (filed with BSE) · Tier 1: company or exchange filing · 23 Oct 2026
- S39Board outcome: Anupam Agarwal, Director (Finance), appointed CFO in place of Yogish Nayak S. · Oil and Natural Gas Corporation Ltd (filed with BSE) · Tier 1: company or exchange filing · 25 Jun 2026
- S40Appointment of statutory/joint statutory auditors by C&AG for FY 2026-27 · Oil and Natural Gas Corporation Ltd (filed with BSE) · Tier 1: company or exchange filing · 8 Sep 2026
- S41Reg 30 disclosure: BSE and NSE fines for board/committee composition, quarter ended 30 Jun 2026 · Oil and Natural Gas Corporation Ltd (filed with BSE) · Tier 1: company or exchange filing · 26 Aug 2026
- S42ONGC and Reliance sign agreement to share deepwater resources on India's east coast · Oil and Natural Gas Corporation Ltd (filed with BSE) · Tier 1: company or exchange filing · 28 Jan 2026
- S43ONGC and bp sign Technical Services Contract for Western Offshore fields · Oil and Natural Gas Corporation Ltd (filed with BSE) · Tier 1: company or exchange filing · 25 Jun 2026
- S44Press release: fire incident at SHP platform, Mumbai High (3 Apr 2026) · Oil and Natural Gas Corporation Ltd (filed with BSE) · Tier 1: company or exchange filing · 4 Apr 2026
- S45Update on well Mori-5 (Mori field operated by Deep Industries Ltd) · Oil and Natural Gas Corporation Ltd (filed with BSE) · Tier 1: company or exchange filing · 6 Jan 2026
- S46Reg 30 disclosure: Andhra Pradesh Pollution Control Board stop-production order, well Mori#5 · Oil and Natural Gas Corporation Ltd (filed with BSE) · Tier 1: company or exchange filing · 25 Apr 2026
- S47Monetisation of Daman Upside Development Project (DUDP), first gas 29 Mar 2026 · Oil and Natural Gas Corporation Ltd (filed with BSE) · Tier 1: company or exchange filing · 29 Mar 2026
- S48Direction by Government of India on block CB-OS/2 (PSC extension not accepted; ONGC to take control as Government nominee) · Oil and Natural Gas Corporation Ltd (filed with BSE) · Tier 1: company or exchange filing · 22 Sep 2025
Changes to this page (v1 · 11 Nov 2026)
- v1 · 11 Nov 2026First version. (first version)
Numbers come only from tier 1 and tier 2 sources. Read how we research.
Disclaimer
For learning only. Cityfort is not a SEBI-registered adviser and does not recommend buying or selling any security. Prices shown are dated and may be out of date.
Investing in securities involves risk, including loss of capital. Before making any investment decision, do your own research and consider consulting a SEBI-registered investment adviser.
Cityfort, its owners and contributors may or may not hold securities of companies covered. Content is not an offer or solicitation to buy or sell any security.
Read the full disclaimerHide the full disclaimer
Cityfort publishes educational content that explains how listed companies work. Cityfort is not registered with the Securities and Exchange Board of India (SEBI) as an Investment Adviser or Research Analyst and does not provide investment advice, recommendations, ratings, price targets or any opinion on whether to buy, sell or hold any security.
All information is taken from publicly available sources, mainly company filings on BSE and NSE, which are listed on each page with dates. We work to keep it accurate and correct errors publicly, but we do not guarantee that it is complete, accurate or up to date. Any market price or price-based ratio shown is dated, may be out of date by the time you read it, and is included only to explain concepts.
Statements by company management are reported as statements, with their date and source; they are not our forecasts.