Chemicals · NSE: PIDILITIND · BSE: 500331
Pidilite: how the business works
Pidilite makes Fevicol, Dr. Fixit and other glues, sealants and waterproofing products, sold mostly through shops in India; FY26 revenue was ₹14,601 crore.
Follow Pidilite
Email me when Pidilite's page is updated after results.
We store your email address with Kit, our email provider, which also records when you sign up and whether you open or click our emails. We send a confirmation email first. See our privacy policy.
Pidilite Industries Limited · Mumbai, Maharashtra · Founded 1969
Updated for Q2 FY27 · checked
- Revenue, FY26
- ₹14,601 cr
- Profit to shareholders, FY26
- ₹2,449 cr
- Distributors (Q2 FY27 presentation)
- 5,900+
- Incorporated
- 1969
- Promoter holding, 30 Sep 2026
- 69.18%
The short version
Pidilite in 5 points
1 · What it sells
Pidilite makes glues such as Fevicol, sealants, waterproofing, tile adhesives, art materials and industrial adhesives, and its FY26 consolidated revenue from operations was ₹14,601 crore.
2 · Who pays it
In FY26, Consumer & Bazaar buyers such as carpenters, plumbers, painters and households, reached through shops, gave Pidilite 78.8% of its revenue, factories buying industrial products 20.8% and other sales 0.4%.
3 · What it keeps from ₹100
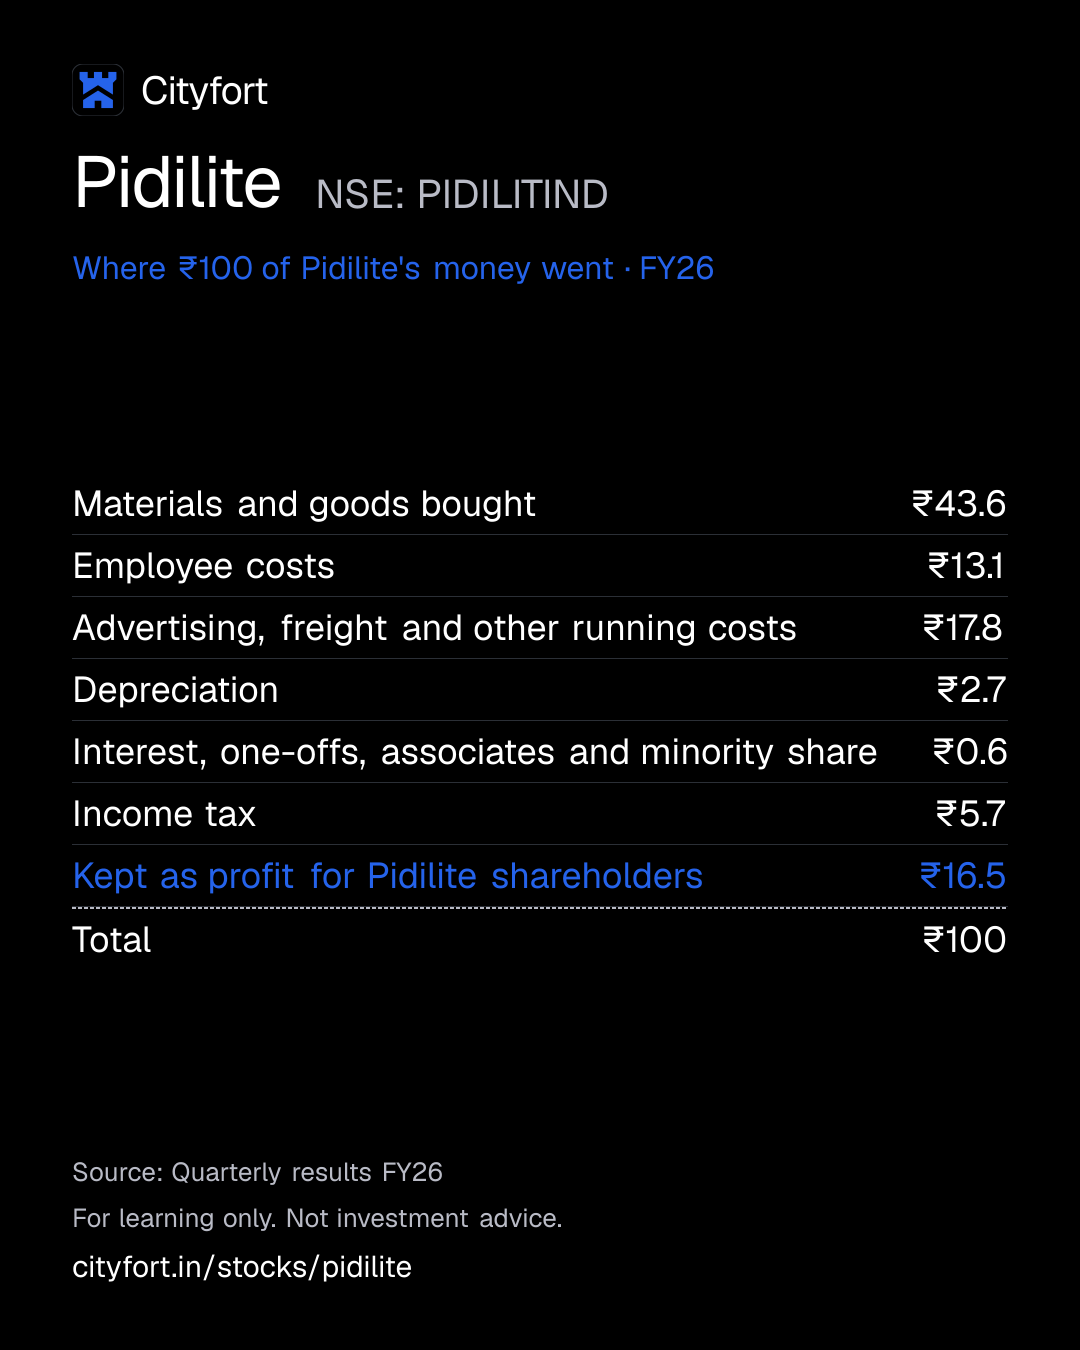
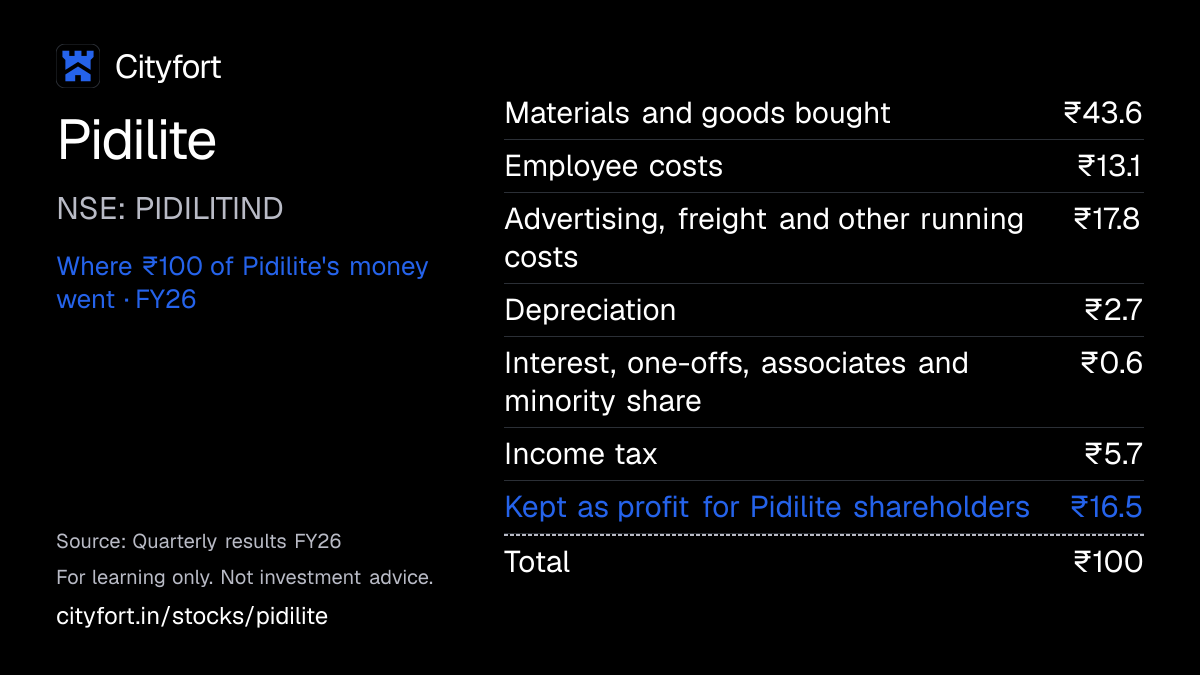
Of every ₹100 that came in during FY26, including ₹1.8 of other income, Pidilite kept ₹16.5 as profit for shareholders after ₹43.6 for materials and ₹17.8 for advertising, freight and other running costs.
4 · Where the operating profit comes from
In FY26 the Consumer & Bazaar segment earned ₹3,546 crore of Pidilite's ₹4,066 crore segment result (87.2%) and Business to Business ₹529 crore (13.0%).
5 · The one thing to watch
In Q2 FY27 Pidilite's revenue rose 20.9% from a year earlier to ₹4,298 crore while EBITDA rose 3.8% to ₹882 crore (Cityfort calculation), and CFO Sandeep Batra said VAM, a key raw material, cost $1,630, nearly twice the year-earlier level.
Sources: From Pidilite's FY26 annual report and its Q2 FY27 results, presentation and earnings call · checked
Sources (5)
01Where the money goes · FY26
Where does ₹100 of Pidilite's money go?
Pidilite · FY26
Receipt for every ₹100
| Materials and goods bought | ₹43.6 |
|---|---|
| Employee costs | ₹13.1 |
| Advertising, freight and other running costs | ₹17.8 |
| Depreciation | ₹2.7 |
| Interest, one-offs, associates and minority share | ₹0.6 |
| Income tax | ₹5.7 |
| Kept as profit for Pidilite shareholders | ₹16.5 |
| Total | ₹100 |
Each line = amount ÷ total money in × 100. Lines may not add to exactly ₹100 because of rounding.
How this is worked out
Cityfort calculation from the FY26 annual report: each line ÷ total money in during FY26 (revenue ₹14,601 crore + other income ₹266 crore = ₹14,867 crore). Other income was ₹1.8 of every ₹100. The small line holds ₹54 crore of interest, ₹14 crore of one-off impairments on investments in and loans to associates, ₹2 crore of associates' losses and ₹22 crore of profit belonging to minority shareholders of subsidiaries.
Save this receipt as an image
Embed this receipt or the key numbers
Paste this code into a blog or website to show the card you choose, with a link back to this page.
Each week: the next company due to report results, explained in 5 points.
We'll email you once a week with what changed on Cityfort. Facts only, no tips. Unsubscribe any time.
We store your email address with Kit, our email provider, which also records when you sign up and whether you open or click our emails. We send a confirmation email first. See our privacy policy.
02The business in one line
What does Pidilite do?
Shops and factories pay Pidilite for glue, sealants and waterproofing used by carpenters, plumbers, painters and households; materials take ₹43.6 of every ₹100 that comes in, and ₹16.5 is profit.
- Consumer & Bazaar products, such as Fevicol and Dr. Fixit sold through shops, were 78.8% of FY26 revenue. Industrial (B2B) customers were 20.8%.
- In Q2 FY27 revenue rose 20.9% and EBITDA 3.8% from a year earlier. CFO Sandeep Batra said the VAM Pidilite used, a key raw material, cost nearly twice as much as a year earlier.
03Who pays it
Who pays Pidilite?
Consumer & Bazaar buyers
78.8%
of revenue
Carpenters, painters, plumbers, mechanics, households, students and offices, reached through wholesalers, distributors, retailers and e-commerce.
Industrial (B2B) customers
20.8%
of revenue
Makers in packaging, joinery, textiles, paints, printing inks, paper and leather, who buy industrial adhesives, resins and pigments.
Others
0.4%
of revenue
Mainly sales of raw materials.
- Consumer & Bazaar buyers78.8%
- Industrial (B2B) customers20.8%
- Others0.4%
How spread out the customers are
Pidilite says no single customer was 10% or more of its FY26 revenue and does not disclose its biggest customers. Shares are of FY26 consolidated segment revenue after sales between segments.
04How it makes money
How does Pidilite make money?
Pidilite turns petrochemical raw materials into branded glue and building chemicals, so its profit depends on the gap between its prices and its input costs.
Materials took ₹43.6 of every ₹100 that came in during FY26. When inputs such as VAM rise, margins fall until Pidilite raises prices; management said Fevicol prices went up about 12% to 15% in Apr–May 2026. EBITDA per ₹100 of revenue (Cityfort calculation) was ₹18.7 in FY22, ₹16.9 in FY23 and ₹24.0 in FY26.
EBITDA per ₹100 of revenue (Cityfort calculation)
₹18.7₹24.0
FY22 to FY26
- Pidilite buys raw materials such as VAM; materials take ₹43.6 of every ₹100.
- 32 plants and 29 co-makers turn them into glue, sealants and waterproofing.
- 5,900+ distributors carry the packs to shops across India.
- Carpenters, plumbers and painters ask for brands such as Fevicol and Dr. Fixit; ad spend was ₹597 crore in FY26.
- When input costs rise, Pidilite raises prices, as it did in Apr–May and Oct 2026.
- Profit pays for new categories, plants and dividends.
↺ Step 6 feeds back into step 1.
05Business segments · FY26
Which businesses make up Pidilite?
Consumer & Bazaar
78.8%Branded glue, sealants, waterproofing, tile adhesives and art materials sold through shops. Its ₹3,546 crore FY26 result (profit before interest and tax) was 87.2% of the ₹4,066 crore segment total.
Revenue ₹11,505 cr · Operating profit ₹3,546 cr
Business to Business
20.8%Industrial adhesives, resins, pigments and project construction chemicals sold to factories and builders. Its ₹529 crore FY26 result was 13.0% of the segment total.
Revenue ₹3,036 cr · Operating profit ₹529 cr
Others
0.4%Mainly sales of raw materials; a ₹9 crore loss in FY26. Revenue is after sales between segments.
Revenue ₹60.6 cr · Operating profit −₹9.3 cr
How the mix changed
- Consumer & Bazaar
- Business to Business
- Others
Revenue by segment, FY22 to FY26.
₹ crore
See the numbers
06The numbers · Consolidated · ₹ crore
How has Pidilite done?
Revenue
₹14,601 crFY26
Revenue rose every year, from ₹9,921 crore in FY22 to ₹14,601 crore in FY26, and Q2 FY27's ₹4,298 crore was 20.9% above Q2 FY26.
₹ crore
See the numbers
Net profit
₹2,449 crFY26
Profit for shareholders rose every year, from ₹1,208 crore in FY22 to ₹2,449 crore in FY26, and Q2 FY27's ₹615 crore was 6.1% above Q2 FY26.
₹ crore
See the numbers
Net profit for every ₹100 of revenue
₹16.8FY26
EBITDA (Cityfort calculation, after one-off items) was ₹24.0 per ₹100 of revenue in FY26, against ₹16.9 in FY23; FY24 is after a ₹72 crore one-off charge, Q1 FY27 includes a ₹14 crore one-off gain on the BuildNext stake, and Q2 FY27's ₹882 crore was 3.8% above Q2 FY26.
Net margin: ₹ of net profit per ₹100 of revenue
See the numbers
Free cash flow
₹2,236 crFY26
Free cash flow rose from ₹581 crore in FY22 to ₹2,236 crore in FY26, after ₹593 crore of capex, and FY26 dividends paid were ₹1,526 crore.
₹ crore · cash from operations minus spending on plants and equipment
See the numbers
See all yearly numbers
EBITDA = profit before interest, tax and wear-and-tear of assets. Financial year runs April to March (March year end). Net profit is the share belonging to the company's owners.
Sources (20)
- Annual Report FY23 (2022-23; NSE ZIP, PDF inside)
- Annual Report FY24 (2023-24)
- Annual Report FY25 (2024-25)
- Annual Report FY26 (57th, 2025-26), with Business Responsibility and Sustainability Report
- Financial results XBRL, consolidated, Q3 FY25
- Press release: Q3 FY25 results
- Integrated filing (financials) XBRL, consolidated, Q4 FY25 and FY25
- Press release: Q4 FY25 and FY25 results
- Audited financial results Q4 FY26 and FY26
- Integrated filing (financials) XBRL, consolidated, Q1 FY26
- Press release: Q1 FY26 results, bonus and special dividend
- Unaudited financial results Q1 FY27 (quarter ended 30 Jun 2026)
- Integrated filing (financials) XBRL, consolidated, Q2 FY26
- Press release: Q2 FY26 results
- Integrated filing (financials) XBRL, consolidated, Q3 FY26
- Press release: Q3 FY26 results
- Integrated filing (financials) XBRL, consolidated, Q4 FY26 and FY26
- Integrated filing (financials) XBRL, consolidated, Q1 FY27
- Integrated filing (financials) XBRL, consolidated, Q2 FY27
- Unaudited financial results Q2 FY27 (quarter ended 30 Sep 2026)
07Who runs it
Who runs Pidilite, and did they deliver?
M B Parekh
Executive Chairman · since 1972
A promoter director; a director of the company since 1972.
Sudhanshu Vats
Managing Director · since 2025
Managing Director from 10 Apr 2025; MD Designate before that.
Kavinder Singh
Joint Managing Director · since 2024
On the board since 20 May 2024.
A N Parekh
Executive Vice Chairman
Sandeep Batra
Executive Director Finance and CFO
Amit Agarwal joined the 29 Oct 2026 earnings call as CFO Designate.
Bharat Puri
Non-executive director
Managing Director until 9 Apr 2025.
What they said, and what happened
1 delivered · 2 too early to tell
Said on 4 Feb 2026
Management said in the Q3 FY26 call that the EBITDA margin corridor Pidilite has shared is 20% to 24%.
DeliveredWhat happened
Consolidated EBITDA margin, as the company reports it, was 23.3% in Q4 FY26, 26.3% in Q1 FY27 (above the range) and 20.5% in Q2 FY27, making 23.5% for H1 FY27.
Said on 7 May 2026
MD Sudhanshu Vats said in the FY26 results release that he expected the momentum in domestic demand to continue in the year ahead.
Too early to tellWhat happened
FY27 ends on 31 Mar 2027. Standalone underlying volume growth (company measure) was 11.3% in Q1 FY27 and 10.7% in Q2 FY27, against 11.8% for FY26.
Said on 29 Oct 2026
Management said in the Q2 FY27 call it expects to "deliver in our EBITDA margin corridor of 20% to 24%, ideally in the slightly higher end of the corridor" in H2 FY27.
Too early to tellWhat happened
H2 FY27 ends on 31 Mar 2027. H1 FY27 consolidated EBITDA margin, as the company reports it, was 23.5%.
Sources (7)
- Annual Report FY26 (57th, 2025-26), with Business Responsibility and Sustainability Report
- Annual Report FY25 (2024-25)
- Q2 FY27 earnings call transcript (call 29 Oct 2026)
- Q3 FY26 earnings call transcript (call 4 Feb 2026)
- Press release: Q4 FY26 and FY26 results
- Press release: Q1 FY27 results
- Press release: Q2 FY27 results
08What could go wrong
What could go wrong for Pidilite?
- Raw-material prices
Raw-material prices
CRISIL notes that VAM and resins come from crude oil and some are imported. CFO Sandeep Batra said VAM cost $1,630 in Q2 FY27, against $1,370 in Q1, and standalone gross margin fell 7.2 percentage points from a year earlier.
Watch The VAM price stated in each earnings call, and the EBITDA margin each quarter.
- Demand
Demand after price increases and weak monsoons
The FY26 annual report says steep input-cost rises were likely to bring substantial price increases, which could hurt overall demand. CRISIL lists erratic monsoons as a weakness that could dampen demand.
Watch Standalone underlying volume growth (company measure): 10.7% in Q2 FY27.
- Competition
Competition in tile adhesives and waterproofing
Joint MD Kavinder Singh said on 5 Aug 2026 that tile adhesives are "facing intense competition"; management said rivals could include cement and tile makers. Astral said its India adhesives sales rose 25.3% in Q2 FY27.
Watch Growth of construction and paint chemicals (+20.3% in FY26, standalone).
- Currency
Overseas business
Revenue outside India was ₹1,467 crore in FY26, 10.0% of the total and close to FY22's ₹1,462 crore. The FY26 annual report says overseas subsidiaries remain exposed to political and economic uncertainty, and tariffs in key markets hit exports.
Watch International subsidiaries' growth: 21.8% in Q2 FY27.
- Pricing
B2B profit
Standalone B2B revenue rose 21.8% in Q2 FY27, but its EBIT fell 3.4% to ₹115 crore. The consolidated B2B segment margin was 12.5% in Q2 FY27, against 15.2% a year earlier (Cityfort calculation).
Watch B2B segment result in each quarterly filing.
- Concentration
A big supplier it part-owns
Pidilite bought ₹561 crore of goods in FY26 from Vinyl Chemicals (India) Ltd, an associate company, and owed it ₹106 crore on 31 Mar 2026.
Watch Purchases from Vinyl Chemicals in the annual report's related-party note.
- Regulation
Counterfeits and plastic-waste rules
The board's report lists counterfeit products, intellectual property infringement and plastic waste rules (extended producer responsibility) among Pidilite's main risks.
Watch Risk updates in the annual report and any new plastic-packaging rules.
Sources (10)
- CRISIL rating rationale: ratings reaffirmed at Crisil AAA/Stable/Crisil A1+
- Q2 FY27 earnings call transcript (call 29 Oct 2026)
- Annual Report FY26 (57th, 2025-26), with Business Responsibility and Sustainability Report
- Press release: Q2 FY27 results
- Q1 FY27 earnings call transcript (call 5 Aug 2026)
- Astral Ltd: press release Q2 FY27 results (Paints and Adhesives segment; competitor filing)
- Annual Report FY23 (2022-23; NSE ZIP, PDF inside)
- Earnings presentation Q2 FY27
- Integrated filing (financials) XBRL, consolidated, Q2 FY27
- Integrated filing (financials) XBRL, consolidated, Q2 FY26
09Supporters and critics
What do supporters and critics point to?
What supporters point to
- Revenue rose every year, from ₹9,921 crore in FY22 to ₹14,601 crore in FY26, and rose 20.9% in Q2 FY27.
- EBITDA per ₹100 of revenue (Cityfort calculation) rose from ₹16.9 in FY23 to ₹24.0 in FY26.
- Standalone underlying volume growth (company measure) was 11.8% in FY26 and 10.7% in Q2 FY27.
- On 30 Sep 2026 cash and investments were ₹3,885 crore against ₹51 crore of borrowings, and CRISIL rates Pidilite AAA.
- Free cash flow was ₹2,236 crore in FY26.
What critics point to
- In Q2 FY27 EBITDA rose 3.8% while revenue rose 20.9%, and standalone gross margin fell 7.2 percentage points from a year earlier.
- Revenue from outside India was ₹1,467 crore in FY26, close to FY22's ₹1,462 crore.
- Standalone B2B EBIT fell 3.4% in Q2 FY27 while B2B revenue rose 21.8%.
- In H1 FY27 dividends paid (₹1,171 crore) were more than free cash flow (₹833 crore).
- Management said in the 5 Aug 2026 call that tile-adhesive rivals could include cement and tile makers.
10What to watch next
What should you watch next at Pidilite?
Next event
Q3 FY27 results (date not announced; Q3 FY26 results came on 3 Feb 2026)
Date not announced yet.
VAM prices and margins
CFO Sandeep Batra said VAM cost $1,630 in Q2 FY27, when EBITDA was ₹882 crore, 3.8% above Q2 FY26. Management expects H2 FY27 EBITDA margin within its 20% to 24% corridor (29 Oct 2026 call).
Price increases and volumes
Pidilite raised Fevicol and Dr. Fixit prices on 1 Oct 2026, and MD Sudhanshu Vats said a further 3% to 5% was planned where inflation is very high. Standalone volume growth was 10.7% in Q2 FY27.
B2B profit
Standalone B2B revenue rose 21.8% in Q2 FY27 while its EBIT fell 3.4% to ₹115 crore.
11Key facts
Key facts about Pidilite
- What does Pidilite do?
- Pidilite Industries Ltd, based in Mumbai, makes adhesives, sealants, waterproofing, tile adhesives and art materials, and industrial adhesives, resins and pigments for factories. Pidilite's brands include Fevicol, Fevikwik, Fevistik, M-Seal, Dr. Fixit, Roff and Araldite.
- How does Pidilite make money?
- Pidilite makes most of its money selling branded products through shops. The Consumer & Bazaar segment was 78.8% of Pidilite's FY26 consolidated revenue of ₹14,601 crore, and the Business to Business segment, which sells to factories, was 20.8%.
- Who are Pidilite's customers?
- Pidilite's Consumer & Bazaar products are used by carpenters, painters, plumbers, mechanics, households, students and offices, and are sold through wholesalers, distributors, retailers and e-commerce. No single customer was 10% or more of Pidilite's FY26 revenue, the company says.
- How big is Pidilite?
- Pidilite's FY26 consolidated revenue from operations was ₹14,601 crore, up 11.1% from ₹13,140 crore in FY25, and its profit for shareholders was ₹2,449 crore, up 17.9% from ₹2,076 crore.
- Who owns Pidilite?
- On 30 Sep 2026 Pidilite's promoters, members of the Parekh family and their entities, owned 69.18% of the shares, with none pledged. Foreign investors held 12.42%, Indian institutions 9.21% and other shareholders 9.19%.
- How did Pidilite do in Q2 FY27?
- In Q2 FY27 (Jul–Sep 2026) Pidilite's consolidated revenue rose 20.9% from a year earlier to ₹4,298 crore, and profit for shareholders rose 6.1% to ₹615 crore. Underlying volume growth, the company's own measure for the standalone company, was 10.7%.
- Does Pidilite have debt?
- On 30 Sep 2026 Pidilite had ₹51 crore of borrowings and ₹3,885 crore of cash, bank balances and short-term investments (Cityfort calculation from the Q2 FY27 results). CRISIL reaffirmed Pidilite's AAA rating with a stable outlook on 2 Sep 2025.
- Where does Pidilite sell?
- Pidilite made 90.0% of its FY26 revenue in India and 10.0% outside India. Pidilite's Q2 FY27 presentation lists international set-ups in Thailand, Dubai, Egypt, Bangladesh, Sri Lanka and Kenya.
- What dividend did Pidilite pay for FY26?
- Pidilite's dividend for FY26 was ₹16.50 a share on the share count after the 1:1 bonus issue of Sep 2025: a ₹5.00 special interim dividend (₹10 a share before the bonus) and an ₹11.50 final dividend.
Sources (7)
- Annual Report FY26 (57th, 2025-26), with Business Responsibility and Sustainability Report
- Earnings presentation Q2 FY27
- Shareholding pattern as of 30 Sep 2026 (XBRL)
- Integrated filing (financials) XBRL, consolidated, Q2 FY27
- Integrated filing (financials) XBRL, consolidated, Q2 FY26
- Press release: Q2 FY27 results
- CRISIL rating rationale: ratings reaffirmed at Crisil AAA/Stable/Crisil A1+
Terms on this page
- Capital expenditure (capex)
- Credit rating
- Dividend payout ratio
- EBITDA
- FII and DII holding
- Free cash flow
- Market capitalisation
- Net debt
- Net profit
- Operating margin
Each explains the term in plain English, with the same number from other companies on Cityfort.
Go deeper
More detail from the same filings. Open any section.
12What it sells
12What it sells
What does Pidilite sell?
Adhesives and sealants
Glues, sealants and tapes used by carpenters, mechanics, households and students, under brands such as Fevicol, Fevikwik, Fevistik, M-Seal and Araldite. 53.4% of FY26 sales, up 9.4%.
Construction and paint chemicals
Waterproofing (Dr. Fixit), tile adhesives (Roff) and other building chemicals used by plumbers, painters and contractors. 22.6% of FY26 sales, up 20.3%.
Art and craft materials
Colours and craft products for students, hobbyists and offices. 5.6% of FY26 sales, up 7.4%.
Industrial products (B2B)
Industrial adhesives for packaging, footwear, joinery and cars (4.9%), industrial resins and project construction chemicals (9.7%), and pigments (3.4%, down 8.1%) for factories.
What it does
- Does: Makes adhesives, sealants, waterproofing and tile adhesives under its own brands
- Does: Sells through wholesalers, distributors, retailers and e-commerce, with 5,900+ distributors
- Does: Sells industrial adhesives, resins and pigments to factories
What it does not do
- Does not: Does not depend on one big buyer: no single customer was 10% or more of FY26 revenue
- Does not: Does not earn most of its money abroad: outside India was 10.0% of FY26 revenue
- Does not: Does not borrow much: borrowings were ₹51 crore on 30 Sep 2026
13How the money flows
13How the money flows · FY26
How does money flow through Pidilite?
Money in
- Revenue from operations₹14,601 cr
- Other income₹266 cr
The company
Pidilite
₹14,867 cr came in
Money out
- Materials and goods bought₹6,489 cr
- Employee costs₹1,941 cr
- Advertising, freight and other running costs₹2,652 cr
- Depreciation₹395 cr
- Interest, one-off charges, associates' losses and minority share₹92 cr
- Income tax₹849 cr
- Net profit for Pidilite shareholders₹2,449 cr
- In FY26 Pidilite's businesses brought in ₹14,601 crore of revenue, plus ₹266 crore of other income.
- Materials and goods bought took ₹6,489 crore, the biggest cost.
- Employees took ₹1,941 crore. Advertising (₹597 crore), freight and other running costs took ₹2,652 crore.
- Depreciation took ₹395 crore. Interest, one-off impairments, associates' losses and minority holders' share took ₹92 crore.
- After ₹849 crore of income tax, ₹2,449 crore was left as profit for Pidilite's shareholders.
14What it needs to run
14What it needs to run
What does Pidilite need to run?
Raw materials
Petrochemicals such as VAM (vinyl acetate monomer), some of them imported. CRISIL puts raw and packing materials at 46% of FY25 sales. CFO Sandeep Batra said in Feb 2026 that VAM may be less than 10% of the raw-material basket.
Plants and contract makers
32 plants and 29 co-makers (outside firms that make products for Pidilite), according to the Q2 FY27 presentation. The FY26 sustainability report lists 33 plants in India.
Distribution
5,900+ distributors carry 850+ products in 6,200+ pack sizes and variants (SKUs) to shops, according to the Q2 FY27 presentation.
Brands and advertising
Pidilite spent ₹597 crore on advertising and publicity in FY26, 4.1% of revenue, up from ₹505 crore in FY25.
People and research
10,387 employees on 31 Mar 2026, 8,614 of them permanent (sustainability report). Six research centres: five in India and one in Singapore.
A supplier it part-owns
Pidilite bought ₹561 crore of goods in FY26 from Vinyl Chemicals (India) Ltd, an associate company (one it part-owns).
Sources (5)
15Where it sells
15Where it sells · FY26
Where does Pidilite sell?
- India90%
- Outside India10%
16Competitors and what protects it
16Competitors and what protects it
Who does Pidilite compete with?
Astral Ltd
NSE: ASTRAL
CPVC pipes maker whose Paints and Adhesives business (Resinova, Seal IT) sells adhesives, epoxy grouts and tile adhesives in India; that business had ₹590 crore of revenue in Q2 FY27.
Indigo Paints Ltd
NSE: INDIGOPNTS
Decorative paints company that also sells waterproofing and construction chemicals through 19,352 active dealers; FY26 consolidated revenue was ₹1,405 crore.
What protects the business
Each strength is scored 1 (weak) to 5 (strong) for the business, with the reason. It is not a rating of the share.
- Brands5 of 5
Pidilite says Fevicol has become synonymous with adhesives to millions in India, and CRISIL ranks it market leader in domestic adhesives and sealants. Pidilite spent ₹597 crore on advertising in FY26.
- Distribution reach4 of 5
5,900+ distributors and 6,200+ pack sizes and variants, according to the Q2 FY27 presentation. CRISIL lists the distribution network among Pidilite's strengths.
- Range across prices and uses4 of 5
CRISIL says presence across price points and categories acts as a barrier against competition. Pidilite sells 850+ products to households, tradespeople and factories.
- Plant network3 of 5
Joint MD Kavinder Singh said in Aug 2026 that the wide plant network is Pidilite's biggest strength in tile adhesives. The Q2 FY27 presentation lists 32 plants and 29 co-makers.
Weak spot
Raw-material prices
CFO Sandeep Batra said VAM cost $1,630 in Q2 FY27, nearly twice the year-earlier level. Standalone gross margin fell 7.2 percentage points from a year earlier and the EBITDA margin was 20.4%.
Sources (8)
- Astral Ltd: press release Q2 FY27 results (Paints and Adhesives segment; competitor filing)
- Indigo Paints Ltd: Annual Report FY26 (competitor filing)
- Press release: Q2 FY27 results
- CRISIL rating rationale: ratings reaffirmed at Crisil AAA/Stable/Crisil A1+
- Annual Report FY26 (57th, 2025-26), with Business Responsibility and Sustainability Report
- Earnings presentation Q2 FY27
- Q1 FY27 earnings call transcript (call 5 Aug 2026)
- Q2 FY27 earnings call transcript (call 29 Oct 2026)
17Where growth could come from
17Where growth could come from
Where could Pidilite's growth come from?
Management said in the Q2 FY27 call on 29 Oct 2026 that it expects H2 FY27 EBITDA margin within its corridor of 20% to 24%, "ideally in the slightly higher end of the corridor". MD Sudhanshu Vats said Pidilite plans a further price increase of 3% to 5% where input inflation is very high.
Waterproofing and tile adhesives
Working+20.3% in FY26 (standalone)
Construction and paint chemicals, including Dr. Fixit and Roff, were 22.6% of standalone FY26 sales. CRISIL calls waterproofing and tile adhesives underpenetrated categories.
Status: Working, on track against what the company said.
Adhesives and sealants
Working+9.4% in FY26 (standalone)
Fevicol, Fevikwik, M-Seal and other adhesives, sealants and tapes were 53.4% of standalone FY26 sales.
Status: Working, on track against what the company said.
Volume growth
Working10.7% in Q2 FY27 (standalone)
Underlying volume growth is the company's own measure: volume growth including the effect of product mix, for the standalone company only. It was 11.8% in FY26 and 11.0% in H1 FY27.
Status: Working, on track against what the company said.
Industrial (B2B) business
MixedRevenue +21.8%, EBIT −3.4% in Q2 FY27 (standalone)
Pigments sales fell 8.1% in FY26. On 28 Sep 2026 Pidilite announced a partnership with Hwaseung Chemical of South Korea to bring footwear adhesives to Indian makers.
Status: Mixed, partly on track.
Sales outside India
Mixed₹1,467 crore in FY26, vs ₹1,462 crore in FY22
International subsidiaries' sales grew 21.8% in Q2 FY27, according to the presentation. Outside India was 10.0% of FY26 revenue.
Status: Mixed, partly on track.
New ('Pioneer') categories
EarlyCompany aim: ₹100 crore revenue in 3 years
The Q2 FY27 presentation groups brands as Core (growth of 1–2 times GDP), Growth (2–4 times GDP) and Pioneer, new categories aiming for ₹100 crore of revenue in 3 years.
Status: Early, too early to judge.
Status compares progress with what the company itself said it would do: Working = on track against what the company said; Mixed = partly on track; Behind = behind the company's own plan; New = recently announced; Early = too early to judge.
Sources (9)
- Q2 FY27 earnings call transcript (call 29 Oct 2026)
- Annual Report FY26 (57th, 2025-26), with Business Responsibility and Sustainability Report
- CRISIL rating rationale: ratings reaffirmed at Crisil AAA/Stable/Crisil A1+
- Press release: Q2 FY27 results
- Press release: Q4 FY26 and FY26 results
- Press release: Q3 FY25 results
- Press release: partnership with Hwaseung Chemical for footwear adhesives
- Annual Report FY23 (2022-23; NSE ZIP, PDF inside)
- Earnings presentation Q2 FY27
18Financial strength and debt
18Financial strength · 30 Sep 2026
How much debt does Pidilite have?
- Total debt₹51 cr
- Cash and investments₹3,885 cr
- Net cash (cash minus debt)₹3,835 cr
- Net worth (shareholders' money)₹11,429 cr
- Debt to equity
- 0×
- ₹ of debt for every ₹1 of shareholders' money
- Borrowings fell from ₹287 crore on 31 Mar 2022 to ₹106 crore on 31 Mar 2026 and ₹51 crore on 30 Sep 2026, all of it short-term on the last date.
- Cash and investments = cash ₹193 crore + other bank balances ₹16 crore + current investments ₹3,676 crore on 30 Sep 2026; net debt = borrowings − that sum (Cityfort calculation from the Q2 FY27 results).
- Lease liabilities (rent owed on leased property) were ₹311 crore on 31 Mar 2026 and are not counted as borrowings; with them, cash and investments exceeded borrowings by ₹3,802 crore on that date (Cityfort calculation from the FY26 annual report).
- In H1 FY27 Pidilite paid ₹1,171 crore of dividends, against free cash flow of ₹833 crore; cash and investments were ₹4,219 crore on 31 Mar 2026.
- Net worth is total equity of ₹11,429 crore, including ₹217 crore that belongs to minority shareholders; equity of Pidilite's own shareholders was ₹11,212 crore. Debt to equity rounds to 0.0 (₹51 crore ÷ ₹11,429 crore).
- CRISIL's 2 Sep 2025 report put gearing, including lease liabilities, at 0.06 times on 31 Mar 2025 and interest coverage at 60.3 times in FY25.
19Who owns it
19Who owns it · Q2 FY27
Who owns Pidilite?
- Promoters (founders or parent company)69.2%
- Foreign institutions (FII)12.4%
- Indian institutions (DII)9.2%
- Public and others9.2%
Promoter pledge
No promoter shares were pledged in Q2 FY27.
How ownership changed
* Pledged = share of the promoters' own holding reported as pledged. In older filings this can include shares “otherwise encumbered”; the governance flags say when.
Sources (12)
- Shareholding pattern as of 30 Sep 2026 (XBRL)
- Shareholding pattern as of 30 Jun 2026 (XBRL)
- Shareholding pattern as of 31 Mar 2026 (XBRL)
- Shareholding pattern as of 31 Dec 2025 (XBRL)
- Shareholding pattern as of 30 Sep 2025 (XBRL)
- Shareholding pattern as of 30 Jun 2025 (XBRL)
- Shareholding pattern as of 31 Mar 2025 (XBRL)
- Shareholding pattern as of 31 Dec 2024 (XBRL)
- Shareholding pattern as of 30 Sep 2024 (XBRL)
- Shareholding pattern as of 30 Jun 2024 (XBRL)
- Shareholding pattern as of 31 Mar 2024 (XBRL)
- Shareholding pattern as of 31 Dec 2023 (XBRL)
20What it does with profit
20What it does with profit
What does Pidilite do with its profit?
Dividend per share
₹16.50FY26
Dividend paid for each share, by financial year.
₹ per share
See the numbers
Buyback · 12 Feb 2018
Bought back 50,00,000 shares (record date 12 Feb 2018).
21Governance signals
21Governance signals
What do Pidilite's governance filings show?
- Auditor
- B S R & Co. LLP, since 2023
- Auditor changes
- 8 May 2023: Deloitte Haskins & Sells LLP → B S R & Co. LLP (Deloitte's five-year term ended at the 54th AGM in 2023; on 8 May 2023 the board proposed B S R & Co. LLP for five years, to the 59th AGM.)
- Audit qualifications
- None reported
- Related-party dealings
- Promoters (53 Parekh family members and entities) held 69.18% on 30 Sep 2026. In FY26 Pidilite bought ₹561 crore of goods from its associate Vinyl Chemicals (India) Ltd, 3.8% of revenue (Cityfort calculation), and paid ₹356 crore of dividends to key managers and directors. The board's report says all related-party deals were in the ordinary course and at arm's length.
- Credit rating
- CRISIL CRISIL AAA (long term), CRISIL A1+ (short term) (outlook Stable), 2 Sep 2025
A credit rating describes the company's ability to repay debt. It is not a rating of the share.
Flags to know about
regulatory · 1 Sep 2026
GST penalty orders
Between 2 Jul and 1 Sep 2026 Pidilite disclosed five GST penalty orders from Maharashtra, Bihar and Madhya Pradesh authorities for years from FY2017-18 to FY2022-23. Three appeal orders confirmed earlier penalties and two orders imposed new ones, of ₹0.10 crore to ₹0.47 crore each and ₹1.53 crore in total (Cityfort calculation). The company said each order is appealable, it is evaluating an appeal, and there is no material impact.
disclosure · 24 Sep 2025
Bonus issue and standalone-only volume figures
The 1:1 bonus of Sep 2025 doubled the share count to 1,017,714,032, so per-share figures before it are not comparable. Underlying volume growth, the company's main volume measure, is reported for the standalone company only.
Sources (11)
- Annual Report FY26 (57th, 2025-26), with Business Responsibility and Sustainability Report
- Annual Report FY23 (2022-23; NSE ZIP, PDF inside)
- Shareholding pattern as of 30 Sep 2026 (XBRL)
- CRISIL rating rationale: ratings reaffirmed at Crisil AAA/Stable/Crisil A1+
- GST penalty order-in-appeal, Maharashtra, FY2018-19 (Rs 39,98,741)
- GST penalty order-in-appeal, Maharashtra, FY2022-23 (Rs 21,44,192)
- GST penalty order-in-appeal, Bihar, FY2017-18 (Rs 34,65,813)
- GST penalty order, Madhya Pradesh, FY2020-21 to 2022-23 (Rs 46,98,047)
- GST penalty order, Bihar, FY2020-21 (Rs 10,42,207)
- Allotment of 50,88,57,016 bonus shares (1:1) on 24 Sep 2025
- Press release: Q2 FY27 results
22What the market paid
22What the market paid · price as of 11 Nov 2026
What did the market pay for Pidilite on 11 Nov 2026?
Price as of 11 Nov 2026 (shown for education; prices change daily).
Price as of 11 Nov 2026: ₹1,574.40, the NSE closing price. Market value = that price × 1,018,540,168 shares, or about ₹160,359 crore (Cityfort calculation from NSE price data and the Sep 2026 shareholding pattern). P/E (price ÷ earnings per share) was 59.7 on the four quarters to Q2 FY27 (₹26.37 a share) and 65.4 on FY26 earnings of ₹24.07 a share. P/B divides the market value by shareholders' equity on 30 Sep 2026 (₹11,212 crore).
- Share price
- ₹1,574.40
- Market value (market cap)
- ₹160,359 cr
- P/E
- 59.7×
- P/B
- 14.3×
Source: NSE CM bhavcopy 11 Nov 2026 (closing prices); Shareholding pattern as of 30 Sep 2026 (XBRL); Integrated filing (financials) XBRL, consolidated, Q3 FY26 and 4 more
Sources (7)
- NSE CM bhavcopy 11 Nov 2026 (closing prices)
- Shareholding pattern as of 30 Sep 2026 (XBRL)
- Integrated filing (financials) XBRL, consolidated, Q3 FY26
- Integrated filing (financials) XBRL, consolidated, Q4 FY26 and FY26
- Integrated filing (financials) XBRL, consolidated, Q1 FY27
- Integrated filing (financials) XBRL, consolidated, Q2 FY27
- Annual Report FY26 (57th, 2025-26), with Business Responsibility and Sustainability Report
23How it got here
23How it got here
How did Pidilite get here?
1959
Milestone
Brand established
Pidilite's Q2 FY27 presentation says its brand was established in 1959.
1969
Milestone
Company incorporated
Pidilite Industries Ltd was incorporated in 1969, according to its FY26 annual report. CRISIL says it began with two divisions: pigment emulsions and adhesives.
2010
Milestone
1:1 bonus issue
Shareholders got one free share for each share held (record date 17 Mar 2010). NSE's records for Pidilite start in 2005.
2018
Milestone
Share buyback
Pidilite bought back 50,00,000 shares (record date 12 Feb 2018).
2021
Crisis
FY21 sales dip
Standalone sales and other income fell to ₹6,290 crore in FY21 from ₹6,484 crore in FY20, the only fall in the ten years the FY26 annual report shows.
2025
Business-model change
New managing director
Sudhanshu Vats became Managing Director on 10 Apr 2025. Bharat Puri, MD until 9 Apr 2025, stayed on the board as a non-executive director.
2025
Milestone
Another 1:1 bonus and a special dividend
To mark founder B K Parekh's 101st birth anniversary, the board approved a 1:1 bonus and a ₹10 special dividend (before the bonus) on 6 Aug 2025. 508,857,016 bonus shares were allotted on 24 Sep 2025.
2026
Crisis
Input costs jump
The FY26 annual report says the West Asia conflict raised prices of all major inputs steeply. Management said Fevicol prices went up about 12% to 15% in Apr–May 2026.
2026
Milestone
BuildNext stake swapped
Pidilite said on 1 Jul 2026 that it had completed the swap of its BuildNext stake for JSW One Platforms shares; a ₹14 crore one-off gain was booked in the quarter to 30 Jun 2026.
Sources (12)
- Earnings presentation Q2 FY27
- Annual Report FY26 (57th, 2025-26), with Business Responsibility and Sustainability Report
- CRISIL rating rationale: ratings reaffirmed at Crisil AAA/Stable/Crisil A1+
- NSE corporate actions: PIDILITIND (bonus, dividend and buyback history)
- Annual Report FY23 (2022-23; NSE ZIP, PDF inside)
- Annual Report FY25 (2024-25)
- Board outcome 6 Aug 2025: special interim dividend and 1:1 bonus issue
- Allotment of 50,88,57,016 bonus shares (1:1) on 24 Sep 2025
- Press release: Q1 FY26 results, bonus and special dividend
- Q4 FY26 earnings call transcript (call 8 May 2026)
- Transfer of Buildnext stake to JSW One Platforms (share swap) completed
- Unaudited financial results Q1 FY27 (quarter ended 30 Jun 2026)
24Sources and changes
Where every number on this page comes from
Sources (55 documents)
- S1Annual Report FY26 (57th, 2025-26), with Business Responsibility and Sustainability Report · Pidilite Industries Ltd (filed with NSE) · Tier 1: company or exchange filing · 6 Jul 2026
- S2Annual Report FY25 (2024-25) · Pidilite Industries Ltd (filed with NSE) · Tier 1: company or exchange filing · 11 Jul 2025
- S3Annual Report FY24 (2023-24) · Pidilite Industries Ltd (filed with NSE) · Tier 1: company or exchange filing · 12 Jul 2024
- S4Annual Report FY23 (2022-23; NSE ZIP, PDF inside) · Pidilite Industries Ltd (filed with NSE) · Tier 1: company or exchange filing · 14 Jul 2023
- S5Business Responsibility and Sustainability Report FY26 · Pidilite Industries Ltd (filed with NSE) · Tier 1: company or exchange filing · 6 Jul 2026
- S6Unaudited financial results Q2 FY27 (quarter ended 30 Sep 2026) · Pidilite Industries Ltd (filed with NSE) · Tier 1: company or exchange filing · 28 Oct 2026
- S7Integrated filing (financials) XBRL, consolidated, Q2 FY27 · Pidilite Industries Ltd (filed with NSE) · Tier 1: company or exchange filing · 28 Oct 2026
- S8Press release: Q2 FY27 results · Pidilite Industries Ltd (filed with NSE) · Tier 1: company or exchange filing · 28 Oct 2026
- S9Earnings presentation Q2 FY27 · Pidilite Industries Ltd (filed with NSE) · Tier 1: company or exchange filing · 28 Oct 2026
- S10Q2 FY27 earnings call transcript (call 29 Oct 2026) · Pidilite Industries Ltd (filed with NSE) · Tier 1: company or exchange filing · 5 Nov 2026
- S11Unaudited financial results Q1 FY27 (quarter ended 30 Jun 2026) · Pidilite Industries Ltd (filed with NSE) · Tier 1: company or exchange filing · 4 Aug 2026
- S12Integrated filing (financials) XBRL, consolidated, Q1 FY27 · Pidilite Industries Ltd (filed with NSE) · Tier 1: company or exchange filing · 4 Aug 2026
- S13Press release: Q1 FY27 results · Pidilite Industries Ltd (filed with NSE) · Tier 1: company or exchange filing · 4 Aug 2026
- S15Q1 FY27 earnings call transcript (call 5 Aug 2026) · Pidilite Industries Ltd (filed with NSE) · Tier 1: company or exchange filing · 12 Aug 2026
- S16Audited financial results Q4 FY26 and FY26 · Pidilite Industries Ltd (filed with NSE) · Tier 1: company or exchange filing · 7 May 2026
- S17Integrated filing (financials) XBRL, consolidated, Q4 FY26 and FY26 · Pidilite Industries Ltd (filed with NSE) · Tier 1: company or exchange filing · 7 May 2026
- S18Press release: Q4 FY26 and FY26 results · Pidilite Industries Ltd (filed with NSE) · Tier 1: company or exchange filing · 7 May 2026
- S19Q4 FY26 earnings call transcript (call 8 May 2026) · Pidilite Industries Ltd (filed with NSE) · Tier 1: company or exchange filing · 15 May 2026
- S20Integrated filing (financials) XBRL, consolidated, Q3 FY26 · Pidilite Industries Ltd (filed with NSE) · Tier 1: company or exchange filing · 3 Feb 2026
- S21Press release: Q3 FY26 results · Pidilite Industries Ltd (filed with NSE) · Tier 1: company or exchange filing · 3 Feb 2026
- S22Q3 FY26 earnings call transcript (call 4 Feb 2026) · Pidilite Industries Ltd (filed with NSE) · Tier 1: company or exchange filing · 11 Feb 2026
- S23Integrated filing (financials) XBRL, consolidated, Q2 FY26 · Pidilite Industries Ltd (filed with NSE) · Tier 1: company or exchange filing · 30 Oct 2025
- S24Press release: Q2 FY26 results · Pidilite Industries Ltd (filed with NSE) · Tier 1: company or exchange filing · 30 Oct 2025
- S25Integrated filing (financials) XBRL, consolidated, Q1 FY26 · Pidilite Industries Ltd (filed with NSE) · Tier 1: company or exchange filing · 6 Aug 2025
- S26Press release: Q1 FY26 results, bonus and special dividend · Pidilite Industries Ltd (filed with NSE) · Tier 1: company or exchange filing · 6 Aug 2025
- S27Integrated filing (financials) XBRL, consolidated, Q4 FY25 and FY25 · Pidilite Industries Ltd (filed with NSE) · Tier 1: company or exchange filing · 8 May 2025
- S28Press release: Q4 FY25 and FY25 results · Pidilite Industries Ltd (filed with NSE) · Tier 1: company or exchange filing · 8 May 2025
- S29Financial results XBRL, consolidated, Q3 FY25 · Pidilite Industries Ltd (filed with NSE) · Tier 1: company or exchange filing · 23 Jan 2025
- S30Press release: Q3 FY25 results · Pidilite Industries Ltd (filed with NSE) · Tier 1: company or exchange filing · 22 Jan 2025
- S31Shareholding pattern as of 30 Sep 2026 (XBRL) · Pidilite Industries Ltd (filed with NSE) · Tier 1: company or exchange filing · 16 Oct 2026
- S32Shareholding pattern as of 30 Jun 2026 (XBRL) · Pidilite Industries Ltd (filed with NSE) · Tier 1: company or exchange filing · 20 Jul 2026
- S33Shareholding pattern as of 31 Mar 2026 (XBRL) · Pidilite Industries Ltd (filed with NSE) · Tier 1: company or exchange filing · 17 Apr 2026
- S34Shareholding pattern as of 31 Dec 2025 (XBRL) · Pidilite Industries Ltd (filed with NSE) · Tier 1: company or exchange filing · 20 Jan 2026
- S35Shareholding pattern as of 30 Sep 2025 (XBRL) · Pidilite Industries Ltd (filed with NSE) · Tier 1: company or exchange filing · 17 Oct 2025
- S36Shareholding pattern as of 30 Jun 2025 (XBRL) · Pidilite Industries Ltd (filed with NSE) · Tier 1: company or exchange filing · 18 Jul 2025
- S37Shareholding pattern as of 31 Mar 2025 (XBRL) · Pidilite Industries Ltd (filed with NSE) · Tier 1: company or exchange filing · 17 Apr 2025
- S38Shareholding pattern as of 31 Dec 2024 (XBRL) · Pidilite Industries Ltd (filed with NSE) · Tier 1: company or exchange filing · 17 Jan 2025
- S39Shareholding pattern as of 30 Sep 2024 (XBRL) · Pidilite Industries Ltd (filed with NSE) · Tier 1: company or exchange filing · 16 Oct 2024
- S40Shareholding pattern as of 30 Jun 2024 (XBRL) · Pidilite Industries Ltd (filed with NSE) · Tier 1: company or exchange filing · 18 Jul 2024
- S41Shareholding pattern as of 31 Mar 2024 (XBRL) · Pidilite Industries Ltd (filed with NSE) · Tier 1: company or exchange filing · 15 Apr 2024
- S42Shareholding pattern as of 31 Dec 2023 (XBRL) · Pidilite Industries Ltd (filed with NSE) · Tier 1: company or exchange filing · 15 Jan 2024
- S43CRISIL rating rationale: ratings reaffirmed at Crisil AAA/Stable/Crisil A1+ · CRISIL Ratings · Tier 2: rating agency or regulator · 2 Sep 2025
- S44Board outcome 6 Aug 2025: special interim dividend and 1:1 bonus issue · Pidilite Industries Ltd (filed with NSE) · Tier 1: company or exchange filing · 6 Aug 2025
- S45Allotment of 50,88,57,016 bonus shares (1:1) on 24 Sep 2025 · Pidilite Industries Ltd (filed with NSE) · Tier 1: company or exchange filing · 24 Sep 2025
- S46NSE corporate actions: PIDILITIND (bonus, dividend and buyback history) · National Stock Exchange of India · Tier 1: company or exchange filing · 12 Nov 2026
- S47NSE CM bhavcopy 11 Nov 2026 (closing prices) · National Stock Exchange of India · Tier 1: company or exchange filing · 11 Nov 2026
- S48Transfer of Buildnext stake to JSW One Platforms (share swap) completed · Pidilite Industries Ltd (filed with NSE) · Tier 1: company or exchange filing · 1 Jul 2026
- S50Press release: partnership with Hwaseung Chemical for footwear adhesives · Pidilite Industries Ltd (filed with NSE) · Tier 1: company or exchange filing · 28 Sep 2026
- S52GST penalty order-in-appeal, Maharashtra, FY2018-19 (Rs 39,98,741) · Pidilite Industries Ltd (filed with NSE) · Tier 1: company or exchange filing · 2 Jul 2026
- S53GST penalty order-in-appeal, Maharashtra, FY2022-23 (Rs 21,44,192) · Pidilite Industries Ltd (filed with NSE) · Tier 1: company or exchange filing · 2 Jul 2026
- S54GST penalty order-in-appeal, Bihar, FY2017-18 (Rs 34,65,813) · Pidilite Industries Ltd (filed with NSE) · Tier 1: company or exchange filing · 10 Jul 2026
- S55GST penalty order, Madhya Pradesh, FY2020-21 to 2022-23 (Rs 46,98,047) · Pidilite Industries Ltd (filed with NSE) · Tier 1: company or exchange filing · 22 Jul 2026
- S56GST penalty order, Bihar, FY2020-21 (Rs 10,42,207) · Pidilite Industries Ltd (filed with NSE) · Tier 1: company or exchange filing · 1 Sep 2026
- S57Astral Ltd: press release Q2 FY27 results (Paints and Adhesives segment; competitor filing) · Astral Ltd (filed with NSE) · Tier 1: company or exchange filing · 5 Nov 2026
- S58Indigo Paints Ltd: Annual Report FY26 (competitor filing) · Indigo Paints Ltd (filed with NSE) · Tier 1: company or exchange filing · 21 Aug 2026
Changes to this page (v1 · 12 Nov 2026)
- v1 · 12 Nov 2026First version. (first version)
Numbers come only from tier 1 and tier 2 sources. Read how we research.
Disclaimer
For learning only. Cityfort is not a SEBI-registered adviser and does not recommend buying or selling any security. Prices shown are dated and may be out of date.
Investing in securities involves risk, including loss of capital. Before making any investment decision, do your own research and consider consulting a SEBI-registered investment adviser.
Cityfort, its owners and contributors may or may not hold securities of companies covered. Content is not an offer or solicitation to buy or sell any security.
Read the full disclaimerHide the full disclaimer
Cityfort publishes educational content that explains how listed companies work. Cityfort is not registered with the Securities and Exchange Board of India (SEBI) as an Investment Adviser or Research Analyst and does not provide investment advice, recommendations, ratings, price targets or any opinion on whether to buy, sell or hold any security.
All information is taken from publicly available sources, mainly company filings on BSE and NSE, which are listed on each page with dates. We work to keep it accurate and correct errors publicly, but we do not guarantee that it is complete, accurate or up to date. Any market price or price-based ratio shown is dated, may be out of date by the time you read it, and is included only to explain concepts.
Statements by company management are reported as statements, with their date and source; they are not our forecasts.