Chemicals · NSE: SOLARINDS · BSE: 532725
Solar Industries: how the business works
Solar Industries makes explosives for mines and builders in India and abroad, and rockets and ammunition for defence buyers; FY26 revenue was ₹9,838 crore.
Follow Solar Industries
Email me when Solar Industries's page is updated after results.
We store your email address with Kit, our email provider, which also records when you sign up and whether you open or click our emails. We send a confirmation email first. See our privacy policy.
Solar Industries India Limited · Nagpur, Maharashtra · Founded 1995
Updated for Q2 FY27 · checked
- Revenue, FY26
- ₹9,838 cr
- Profit to shareholders, FY26
- ₹1,678 cr
- Defence orders in hand, 30 Sep 2026 (company presentation)
- ₹17,568 cr
- Manufacturing facilities, Nov 2026
- 40, in 11 countries
- Promoter holding, Sep 2026 (2.95% of it pledged)
- 73.15%
The short version
Solar Industries in 5 points
1 · What it sells
Solar Industries makes industrial explosives and detonators for mines and builders, plus rockets, ammunition and drones for defence buyers, and its Q2 FY27 revenue was ₹3,519 crore, up 69% from a year earlier.
2 · Who pays it
In H1 FY27, according to Solar's presentation rather than its audited accounts, international explosives buyers gave 40% of sales, domestic explosives buyers such as Coal India 32%, defence buyers 27% and others 1%.
3 · What it keeps from ₹100
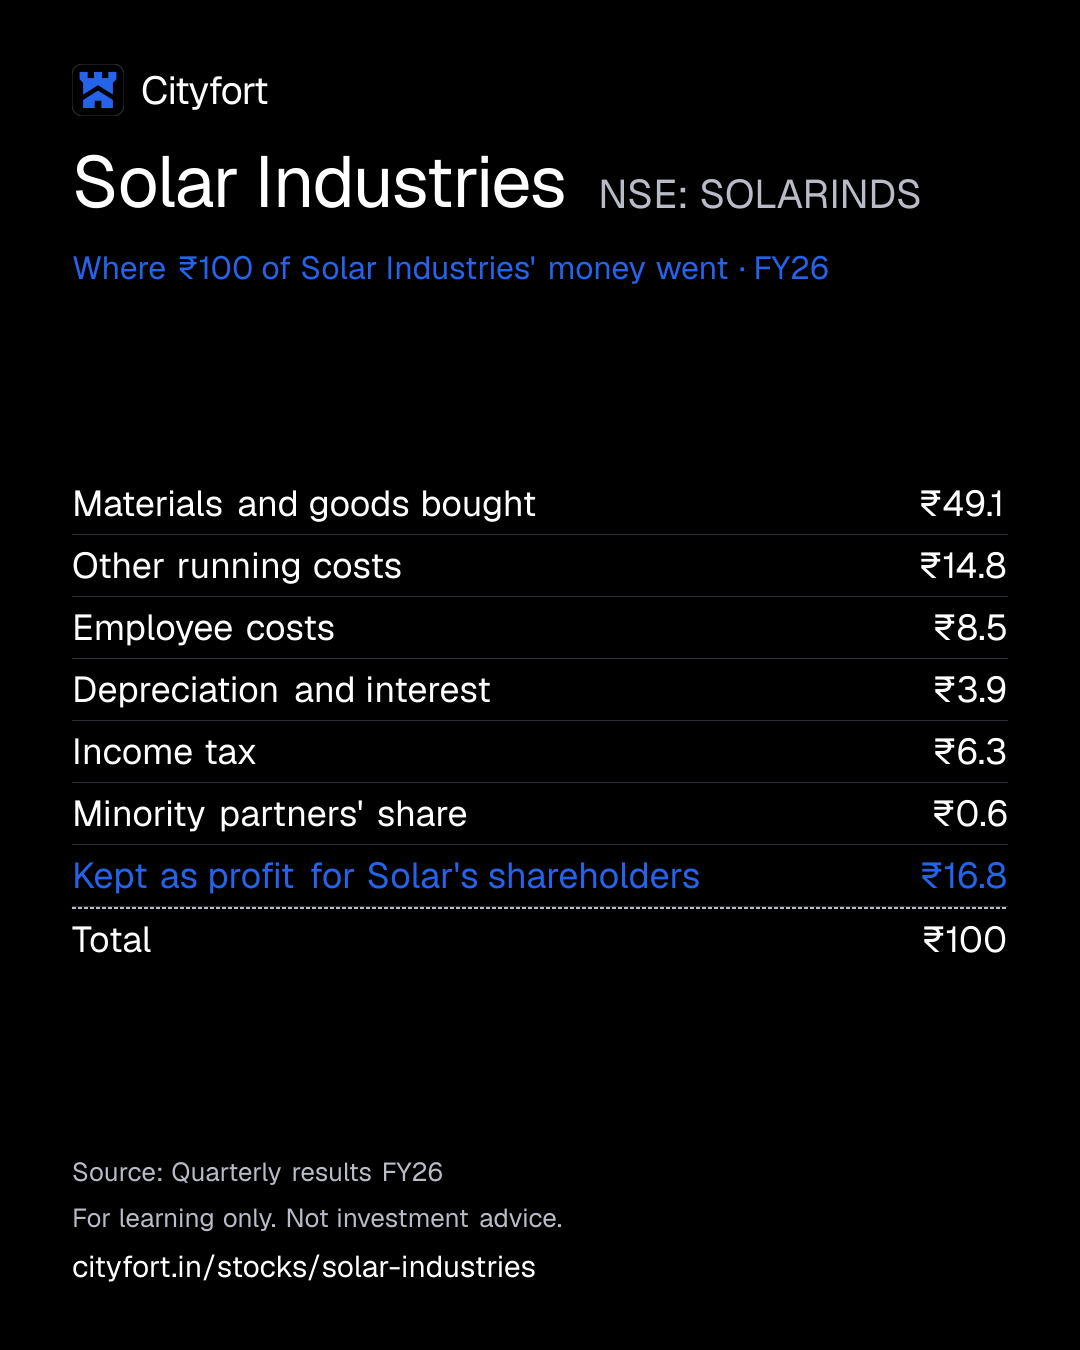
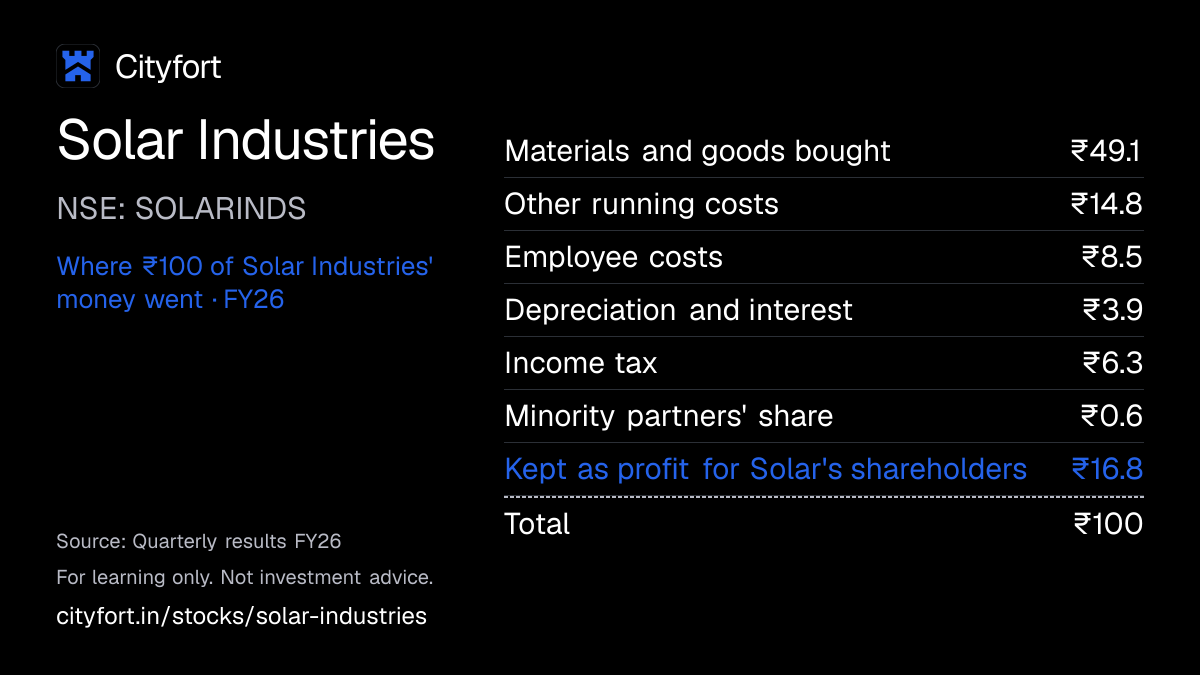
Of every ₹100 that came in during FY26, including ₹128 crore of other income, Solar spent ₹49.1 on materials, ₹14.8 on other running costs and ₹8.5 on employees, and kept ₹16.8 as profit for its shareholders.
4 · Where the operating profit comes from
Solar's accounts report one segment, so its FY26 EBITDA of ₹2,622 crore (Cityfort calculation) is not split by business, but Crisil says the rising share of higher-margin defence and export sales was the main driver of its margin gains.
5 · The one thing to watch
Solar agreed on 14 Sep 2026 to buy South Africa's Omnia Holdings for about ₹12,951 crore in cash, pending approvals, while its own net debt was ₹1,177 crore on 30 Sep 2026.
Sources: From Solar Industries' FY26 annual report, its Q2 FY27 results and presentation, a Crisil rating report and its 14 Sep 2026 Omnia filings · checked
Sources (7)
- Integrated Annual Report 2025-26 (FY26)
- Crisil Ratings rationale: Crisil AA+ placed on Rating Watch with Developing Implications
- Consolidated financial results XBRL, Q2 FY27 (quarter and half year to 30 Sep 2026)
- Board presentation Q2 FY27 and H1 FY27
- Consolidated financial results XBRL, Q4 FY26 and FY26 (audited, to 31 Mar 2026)
- Reg 30 disclosure: definitive agreement to acquire 100% of Omnia Holdings Limited (South Africa)
- Press release: proposed acquisition of Omnia Holdings Limited
01Where the money goes · FY26
Where does ₹100 of Solar Industries' money go?
Solar Industries · FY26
Receipt for every ₹100
| Materials and goods bought | ₹49.1 |
|---|---|
| Other running costs | ₹14.8 |
| Employee costs | ₹8.5 |
| Depreciation and interest | ₹3.9 |
| Income tax | ₹6.3 |
| Minority partners' share | ₹0.6 |
| Kept as profit for Solar's shareholders | ₹16.8 |
| Total | ₹100 |
Each line = amount ÷ total money in × 100. Lines may not add to exactly ₹100 because of rounding.
How this is worked out
Of every ₹100 that came in during FY26: revenue (₹9,838 crore) plus other income (₹128 crore). Cityfort calculation from the FY26 annual report; profit is after the ₹59 crore share of minority partners in subsidiaries.
Save this receipt as an image
Embed this receipt or the key numbers
Paste this code into a blog or website to show the card you choose, with a link back to this page.
Each week: the next company due to report results, explained in 5 points.
We'll email you once a week with what changed on Cityfort. Facts only, no tips. Unsubscribe any time.
We store your email address with Kit, our email provider, which also records when you sign up and whether you open or click our emails. We send a confirmation email first. See our privacy policy.
02The business in one line
What does Solar Industries do?
In FY26, miners, builders and defence buyers paid Solar Industries for explosives and defence products; materials took ₹49 of every ₹100 that came in, and ₹17 was profit.
- Defence sales were ₹2,634 crore in FY26, up 94% from FY25, and ₹1,002 crore in Q2 FY27, according to the company's annual report and presentation.
- Customers outside India gave 60.2% of Solar's FY26 revenue from external customers, up from 37.6% in FY22.
03Who pays it
Who pays Solar Industries?
International explosives buyers
40%
of revenue
Mines and quarries abroad, served from Solar's overseas plants and by exports. Share of H1 FY27 sales as printed in the company's presentation, not its audited accounts.
Domestic explosives buyers
32%
of revenue
Coal India, other miners and institutions, and housing and infrastructure builders in India. Share of H1 FY27 sales as printed in the company's presentation, not its audited accounts.
Defence buyers
27%
of revenue
India's Ministry of Defence and buyers abroad. The presentation does not split defence sales between India and exports. Share of H1 FY27 sales as printed in the company's presentation, not its audited accounts.
Others
1%
of revenue
Other sales. Share of H1 FY27 sales as printed in the company's presentation, not its audited accounts.
- International explosives buyers40%
- Domestic explosives buyers32%
- Defence buyers27%
- Others1%
How spread out the customers are
One customer, not named in the annual report, gave ₹964 crore of FY26 revenue: 9.8% of revenue from operations and 10.0% of revenue from external customers. Crisil says Coal India gave 9–10% of FY26 revenue.
- Largest customer
- 10%
Sources (5)
- Board presentation Q2 FY27 and H1 FY27
- Integrated Annual Report 2025-26 (FY26)
- Reg 30 disclosure: Ministry of Defence contracts worth INR 6,084 crore for Pinaka rockets
- Reg 30 disclosure: export orders of INR 1,400 crore for defence products
- Crisil Ratings rationale: Crisil AA+ placed on Rating Watch with Developing Implications
04The numbers · Consolidated · ₹ crore
How has Solar Industries done?
Revenue
₹9,838 crFY26
Revenue rose every year except FY24, when it fell 12% to ₹6,070 crore, and reached ₹9,838 crore in FY26; Q2 FY27 revenue was ₹3,519 crore, up 69% from Q2 FY26.
₹ crore
See the numbers
Net profit
₹1,678 crFY26
Profit for Solar's shareholders rose every year, from ₹441 crore in FY22 to ₹1,678 crore in FY26, and was ₹617 crore in Q2 FY27 against ₹345 crore a year earlier.
₹ crore
See the numbers
Net profit for every ₹100 of revenue
₹17.1FY26
Profit for shareholders per ₹100 of revenue rose from ₹11.2 in FY22 to ₹17.1 in FY26, and EBITDA from ₹18.9 to ₹26.7 (Cityfort calculation without other income; the company's own FY26 EBITDA of ₹2,750 crore includes it).
Net margin: ₹ of net profit per ₹100 of revenue
See the numbers
Free cash flow
−₹1,118 crFY26
Operating cash flow was ₹621 crore in FY26, down from ₹2,468 crore in FY25, while receivables took ₹634 crore and inventories ₹701 crore; capex of ₹1,739 crore left free cash flow at −₹1,118 crore.
₹ crore · cash from operations minus spending on plants and equipment
See the numbers
See all yearly numbers
EBITDA = profit before interest, tax and wear-and-tear of assets. Financial year runs April to March (March year end). Net profit is the share belonging to the company's owners. Total net income differs from net profit to the company's owners: Total profit, including the share of minority partners in part-owned subsidiaries.
Sources (21)
- Consolidated financial results XBRL, Q4 FY22 and FY22 (audited, to 31 Mar 2022)
- Annual Report 2021-22 (FY22)
- Consolidated financial results XBRL, Q4 FY23 and FY23 (audited, to 31 Mar 2023)
- Annual Report 2022-23 (FY23)
- Consolidated financial results XBRL, Q4 FY24 and FY24 (audited, to 31 Mar 2024)
- Annual Report 2023-24 (FY24)
- Consolidated financial results XBRL, Q4 FY25 and FY25 (audited, to 31 Mar 2025)
- Annual Report 2024-25 (FY25)
- Consolidated financial results XBRL, Q4 FY26 and FY26 (audited, to 31 Mar 2026)
- Integrated Annual Report 2025-26 (FY26)
- Consolidated financial results XBRL, Q1 FY25 (quarter to 30 Jun 2024)
- Consolidated financial results XBRL, Q2 FY25 (quarter to 30 Sep 2024)
- Outcome of board meeting: unaudited results Q2 FY26 (quarter and half year to 30 Sep 2025)
- Consolidated financial results XBRL, Q3 FY25 (quarter to 31 Dec 2024)
- Unaudited results Q3 FY25 (quarter to 31 Dec 2024)
- Consolidated financial results XBRL, Q1 FY26 (quarter to 30 Jun 2025)
- Consolidated financial results XBRL, Q2 FY26 (quarter and half year to 30 Sep 2025)
- Consolidated financial results XBRL, Q3 FY26 (quarter to 31 Dec 2025)
- Consolidated financial results XBRL, Q1 FY27 (quarter to 30 Jun 2026)
- Consolidated financial results XBRL, Q2 FY27 (quarter and half year to 30 Sep 2026)
- Outcome of board meeting: unaudited results Q2 FY27 (quarter and half year to 30 Sep 2026), with auditor appointment
05Who runs it
Who runs Solar Industries, and did they deliver?
Satyanarayan Nuwal
Chairman (non-executive)
Promoter; father of Manish Nuwal.
Manish Nuwal
Managing Director and CEO
Promoter. Held 35,232,069 shares on 30 Sep 2026, of which 1,844,006 were pledged.
Suresh Menon
Executive Director
Milind Deshmukh
Executive Director
Moneesh Agrawal
Joint Chief Financial Officer
Shalinee Mandhana
Joint Chief Financial Officer
What they said, and what happened
1 missed · 1 delivered · 1 too early to tell
Said on 8 Aug 2025
Management said on the Q1 FY26 call (8 Aug 2025) that Solar would "definitely cross INR10,000 crores" of revenue in FY26, with about ₹3,000 crore from defence.
MissedWhat happened
FY26 revenue was ₹9,838 crore and defence revenue ₹2,634 crore. On 11 Nov 2025 management had still said defence should reach around ₹3,000 crore.
Said on 4 Feb 2026
Management said on the Q3 FY26 call (4 Feb 2026) that it was confident of keeping the EBITDA margin around 27–28% as the company moves forward.
DeliveredWhat happened
On the company's EBITDA definition, which includes other income, the margin was 28.5% in Q4 FY26, 27.9% in Q1 FY27 (Cityfort calculation) and 29.0% in Q2 FY27.
Said on 15 May 2026
MD and CEO Manish Nuwal said on the Q4 FY26 call (15 May 2026) that Solar targets ₹14,000 crore of revenue in FY27 "while maintaining current margins", and that defence revenue should cross ₹4,500 crore.
Too early to tellWhat happened
H1 FY27 revenue was ₹7,187 crore and defence sales ₹1,935 crore (company presentation). On 4 Nov 2026 Manish Nuwal said Solar expects to surpass the FY27 guidance.
Sources (12)
- Integrated Annual Report 2025-26 (FY26)
- Shareholding pattern as of 30 Sep 2026 (XBRL, with pledge data)
- Q2 FY27 earnings call transcript (call 4 Nov 2026)
- Q1 FY26 earnings call transcript, revised (call 8 Aug 2025)
- Consolidated financial results XBRL, Q4 FY26 and FY26 (audited, to 31 Mar 2026)
- Q2 FY26 earnings call transcript (call 11 Nov 2025)
- Q3 FY26 earnings call transcript (call 4 Feb 2026)
- Consolidated financial results XBRL, Q1 FY27 (quarter to 30 Jun 2026)
- Consolidated financial results XBRL, Q2 FY27 (quarter and half year to 30 Sep 2026)
- Press release: Q2 and H1 FY27 results
- Q4 FY26 earnings call transcript (call 15 May 2026)
- Board presentation Q2 FY27 and H1 FY27
06What could go wrong
What could go wrong for Solar Industries?
- Debt
A large debt-funded purchase
Solar agreed on 14 Sep 2026 to buy Omnia Holdings for about ₹12,951 crore in cash, more than its FY26 revenue of ₹9,838 crore. Management said on 15 Sep 2026 that total debt should be about ₹10,000–11,000 crore by FY28, against ₹1,705 crore on 30 Sep 2026. Crisil placed its AA+ rating on watch with developing implications on 22 Sep 2026.
Watch Approvals, the final funding structure, and how Crisil resolves its rating watch.
- Governance
Promoter shares pledged
2.95% of the promoter group's shares were pledged as loan collateral on 30 Sep 2026, up from none in Dec 2023, 1.52% in Mar 2025 and 2.27% in Jun 2026. Most are Manish Nuwal's. The filings used for this page do not give the reason for the pledges.
Watch The pledge level in each quarterly shareholding filing.
- Other
Explosions at its own plant
An explosion at the Chakdoh plant near Nagpur on 17 Dec 2023 killed 9 workers. Another there on 4 Sep 2025 killed one person and injured eight; Solar said the loss was limited to one building and insured. The FY26 sustainability report lists 2 fatalities.
Watch Incident disclosures to the exchanges and fatalities in each year's sustainability report.
- Regulation
Tight regulation
Making, selling and storing explosives and ammonium nitrate needs licences, and sales are regulated by the Petroleum and Explosives Safety Organisation. Crisil lists exposure to regulatory risks among Solar's weaknesses.
Watch Changes to explosives or ammonium nitrate rules, and licence actions disclosed by Solar.
- Raw-material prices
Ammonium nitrate prices
Ammonium nitrate is about 65% of raw-material cost and is bought in. Materials took ₹49.1 of every ₹100 that came in during FY26. Crisil says contracts let Solar pass on raw-material price changes through price escalation clauses.
Watch Materials as a share of revenue in each quarter's results.
- Cash and liquidity
Cash tied up as it grows
Free cash flow was −₹1,118 crore in FY26, after operating cash flow fell to ₹621 crore and capex reached ₹1,739 crore. In H1 FY27 operating cash flow was ₹908 crore and capex ₹888 crore.
Watch Operating cash flow and receivables in the half-year and annual results.
- Concentration
Few large buyers
Defence orders, ₹17,568 crore on 30 Sep 2026, come from governments in India and abroad. One customer gave 9.8% of FY26 revenue, and Crisil says Coal India gave 9–10%.
Watch New defence order announcements and the order book in each presentation.
- Currency
Currency swings
Customers outside India gave 60.2% of FY26 revenue from external customers. Crisil says Solar hedges all imports but keeps exports unhedged, so forex risk persists.
Watch Currency effects mentioned in results and calls.
Sources (14)
- Reg 30 disclosure: definitive agreement to acquire 100% of Omnia Holdings Limited (South Africa)
- Press release: proposed acquisition of Omnia Holdings Limited
- Conference call on the proposed acquisition of Omnia Holdings (call 15 Sep 2026)
- Consolidated financial results XBRL, Q2 FY27 (quarter and half year to 30 Sep 2026)
- Crisil Ratings rationale: Crisil AA+ placed on Rating Watch with Developing Implications
- Shareholding pattern as of 30 Sep 2026 (XBRL, with pledge data)
- Shareholding pattern as of 30 Jun 2026 (XBRL, with pledge data)
- Shareholding pattern as of 31 Mar 2025 (XBRL, with pledge data)
- Shareholding pattern as of 31 Dec 2023 (XBRL, with pledge data)
- Annual Report 2023-24 (FY24)
- Reg 30 disclosure: explosion incident at the Chakdoh, Nagpur factory (4 Sep 2025)
- Integrated Annual Report 2025-26 (FY26)
- Outcome of board meeting: unaudited results Q2 FY27 (quarter and half year to 30 Sep 2026), with auditor appointment
- Board presentation Q2 FY27 and H1 FY27
07Supporters and critics
What do supporters and critics point to?
What supporters point to
- Revenue rose from ₹3,948 crore in FY22 to ₹9,838 crore in FY26, and Q2 FY27 revenue was ₹3,519 crore, up 69% from a year earlier.
- Defence sales rose 94% to ₹2,634 crore in FY26, and defence orders in hand were ₹17,568 crore on 30 Sep 2026 (company presentation).
- EBITDA was ₹26.7 of every ₹100 of revenue in FY26, against ₹18.9 in FY22 (Cityfort calculation).
- Crisil puts Solar's share of India's explosives industry at about 24% and says it makes most inputs other than ammonium nitrate in-house.
- Net debt was ₹1,177 crore on 30 Sep 2026, against shareholders' equity of ₹7,673 crore.
What critics point to
- Free cash flow was −₹1,118 crore in FY26, and receivables rose to ₹2,340 crore on 30 Sep 2026 from ₹1,858 crore six months earlier.
- The pending Omnia purchase, about ₹12,951 crore, is larger than Solar's FY26 revenue, and Crisil placed its rating on watch on 22 Sep 2026.
- The share of promoter holdings pledged rose from none in Dec 2023 to 2.95% in Sep 2026.
- Two explosions at the Chakdoh plant killed 9 workers in Dec 2023 and one person in Sep 2025.
- The order book was ₹20,178 crore on 30 Sep 2026, below ₹21,350 crore on 30 Jun 2026 (company presentations).
08What to watch next
What should you watch next at Solar Industries?
Next event
Q3 FY27 results
Date not announced yet.
Omnia approvals
The deal needs regulatory, competition and Omnia shareholder approvals; the filing expects completion in early to mid 2027. Crisil said its rating watch will be resolved on completion and clarity on the deal.
Guided Pinaka order
Management said on 4 Nov 2026 that talks on an order of about ₹3,000 crore were in the final stage. Defence orders in hand were ₹17,568 crore on 30 Sep 2026.
Promoter pledge
2.95% of promoter shares were pledged on 30 Sep 2026, up from 2.27% on 30 Jun 2026.
Cash flow
H1 FY27 operating cash flow was ₹908 crore against capex of ₹888 crore, after a negative free cash flow in FY26.
09Key facts
Key facts about Solar Industries
- What does Solar Industries do?
- Solar Industries India, founded in Nagpur in 1995, makes industrial explosives and detonators for mining and construction, and defence products such as rockets, ammunition, propellants and drones.
- How does Solar Industries make money?
- Solar Industries sells explosives to miners and builders in India and abroad, and defence products to the Ministry of Defence and buyers overseas. In FY26 it earned revenue of ₹9,838 crore and kept ₹1,678 crore as profit for its shareholders.
- Who are Solar Industries' customers?
- In H1 FY27, Solar Industries' presentation put 40% of its sales from international explosives, 32% from domestic explosives and 27% from defence. Crisil says Coal India gave 9–10% of Solar's FY26 revenue.
- How big is Solar Industries?
- Solar Industries' FY26 revenue was ₹9,838 crore and its profit for shareholders ₹1,678 crore. In Q2 FY27 (Jul–Sep 2026) revenue was ₹3,519 crore, up 69% from a year earlier.
- Who owns Solar Industries?
- On 30 Sep 2026 the Nuwal family promoter group held 73.15% of Solar Industries, with 2.95% of its shares pledged. Mutual funds held 12.11%, foreign portfolio investors 6.13% and other public shareholders 7.16%.
- Where does Solar Industries sell?
- Customers outside India gave 60.2% of Solar Industries' FY26 revenue from external customers, against 37.6% in FY22, according to its annual reports. Solar has plants in 11 countries.
- How large is Solar Industries' order book?
- Solar Industries' order book was ₹20,178 crore on 30 Sep 2026, according to its Q2 FY27 presentation: ₹17,568 crore of defence orders and ₹2,610 crore from Coal India and Singareni Collieries.
- How much debt does Solar Industries have?
- On 30 Sep 2026 Solar Industries had borrowings of ₹1,705 crore and cash and short-term investments of ₹528 crore, so net debt was ₹1,177 crore against shareholders' equity of ₹7,673 crore.
Sources (8)
- Integrated Annual Report 2025-26 (FY26)
- Crisil Ratings rationale: Crisil AA+ placed on Rating Watch with Developing Implications
- Consolidated financial results XBRL, Q4 FY26 and FY26 (audited, to 31 Mar 2026)
- Board presentation Q2 FY27 and H1 FY27
- Consolidated financial results XBRL, Q2 FY27 (quarter and half year to 30 Sep 2026)
- Shareholding pattern as of 30 Sep 2026 (XBRL, with pledge data)
- Annual Report 2021-22 (FY22)
- Press release: Q2 and H1 FY27 results
Terms on this page
- Capital expenditure (capex)
- Credit rating
- Customer concentration
- EBITDA
- FII and DII holding
- Free cash flow
- Market capitalisation
- Net debt
- Net profit
- Operating margin
Each explains the term in plain English, with the same number from other companies on Cityfort.
Go deeper
More detail from the same filings. Open any section.
10What it sells
10What it sells
What does Solar Industries sell?
Bulk and packaged explosives
Explosives for coal and metal mines, quarries and building work. Bulk explosives go to mines in large quantities; packaged ones come as cartridges. Crisil says Solar's bulk plants sit 50–60 km from major mining regions.
Initiating systems
Detonators, detonating cord and electronic initiating systems, which set off the explosive charge.
Defence products
High-energy materials, propellants, ammunition, Pinaka rockets, loitering munitions, drones and counter-drone systems, for India's Ministry of Defence and buyers abroad.
What it does
- Does: Makes explosives and detonators in India and at plants abroad
- Does: Supplies Coal India and other miners under multi-year orders
- Does: Makes rockets and ammunition for India's Ministry of Defence and for export
What it does not do
- Does not: Does not make ammonium nitrate, its main raw material, itself (Crisil)
- Does not: Does not report defence, domestic and international explosives as separate segments in its accounts
- Does not: Does not yet own Omnia Holdings: that purchase was pending approvals on 12 Nov 2026
11How the money flows
11How the money flows · FY26
How does money flow through Solar Industries?
Money in
- Revenue from operations₹9,838 cr
- Other income₹128 cr
The company
Solar Industries
₹9,966 cr came in
Money out
- Materials and goods bought₹4,894 cr
- Other running costs₹1,477 cr
- Employee costs₹845 cr
- Depreciation and interest₹385 cr
- Income tax₹629 cr
- Minority partners' share of profit₹59 cr
- Net profit for Solar's shareholders₹1,678 cr
- In FY26 Solar's sales brought in ₹9,838 crore of revenue, plus ₹128 crore of other income.
- Materials took ₹4,894 crore. Crisil says ammonium nitrate is about 65% of raw-material cost.
- Other running costs took ₹1,477 crore and employees ₹845 crore.
- Depreciation and interest took ₹385 crore, income tax ₹629 crore, and minority partners in subsidiaries ₹59 crore.
- What was left for Solar's shareholders was ₹1,678 crore of profit.
12What it needs to run
12What it needs to run
What does Solar Industries need to run?
Factories near mines
Solar has 40 manufacturing facilities, with plants in 11 countries. Crisil counts 32 locations in India and plants in South Africa, Turkiye, Zambia, Nigeria, Tanzania, Ghana, Indonesia, Thailand, Australia and Kazakhstan.
Ammonium nitrate
About 65% of raw-material cost, according to Crisil. It is classed as an explosive under the Ammonium Nitrate Rules, 2012, so making, selling and storing it needs a licence. Solar makes most other inputs itself.
Licences and safety approvals
Crisil says explosives makers need industrial licences and clearances from the government, the Chief Controller of Explosives and the Directorate General of Mines Safety.
People
On 31 Mar 2026 the Indian parent company had 1,410 permanent employees, 941 permanent workers and 5,095 other workers.
Capital spending
Solar spent ₹1,739 crore on plants and equipment in FY26 and ₹888 crore in H1 FY27. MD Manish Nuwal said on 15 May 2026 that it planned ₹2,050 crore for FY27.
Sources (5)
- Press release: Q2 and H1 FY27 results
- Crisil Ratings rationale: Crisil AA+ placed on Rating Watch with Developing Implications
- Integrated Annual Report 2025-26 (FY26)
- Outcome of board meeting: unaudited results Q2 FY27 (quarter and half year to 30 Sep 2026), with auditor appointment
- Q4 FY26 earnings call transcript (call 15 May 2026)
13Where it sells
13Where it sells · FY26
Where does Solar Industries sell?
- Outside India60.2%
- India39.8%
Sources (1)
14Where growth could come from
14Where growth could come from
Where could Solar Industries' growth come from?
MD and CEO Manish Nuwal said on the Q4 FY26 call (15 May 2026) that Solar is "targeting to achieve a revenue of INR14,000 crores in FY '27, while maintaining current margins", with defence revenue above ₹4,500 crore. In his opening remarks on the Q2 FY27 call (4 Nov 2026) he said Solar expects to surpass that FY27 guidance.
Defence
Working₹1,002 crore of sales, +98%, Q2 FY27 (company presentation)
Defence orders in hand were ₹17,568 crore on 30 Sep 2026; management said on 4 Nov 2026 that most are from the international market. Since Nov 2025 Solar has announced export defence orders of ₹1,400 crore, ₹830 crore, ₹589 crore and ₹1,076 crore.
Status: Working, on track against what the company said.
Guided Pinaka rockets
EarlyAbout ₹3,000 crore order in final negotiation, Nov 2026
Solar signed ₹6,084 crore of Pinaka rocket contracts with the Ministry of Defence on 6 Feb 2025. On 4 Nov 2026 management said talks on a Guided Pinaka order of about ₹3,000 crore were in the final stage, and "we hope that this will get concluded very soon".
Status: Early, too early to judge.
International explosives
Working₹1,515 crore of sales, +57%, Q2 FY27 (company presentation)
Solar has plants in 11 countries and customers in more than 90. Its FY26 annual report says international revenue grew 32% in FY26. A new subsidiary was set up in Botswana on 29 Sep 2026.
Status: Working, on track against what the company said.
Domestic explosives
Working₹963 crore of sales, +61%, Q2 FY27 (company presentation)
Coal India gave Solar an additional ₹1,746 crore bulk-explosives order over 2 years on 31 Dec 2025, and SECL a ₹483 crore order on 8 Oct 2025. Orders in hand from Coal India and Singareni Collieries were ₹2,610 crore on 30 Sep 2026.
Status: Working, on track against what the company said.
Omnia Holdings (pending)
NewAbout ₹12,951 crore in cash; approvals pending
Omnia, listed in Johannesburg, serves mining through its BME business (explosives and blasting systems) and also has agriculture and chemicals businesses. Its FY26 revenue was about ₹13,307 crore, by Solar's conversion. The filing expects completion in early to mid 2027, subject to approvals.
Status: New, recently announced.
Sivasakthi Industrial Explosives (pending)
New₹115.02 crore in cash; FY26 turnover nil
On 15 Oct 2026 subsidiary Solar Explochem signed an agreement to buy all of Sivasakthi, an Indian explosives maker, within 12 months, subject to terms the parties may agree. Sivasakthi's turnover was nil in FY26.
Status: New, recently announced.
Status compares progress with what the company itself said it would do: Working = on track against what the company said; Mixed = partly on track; Behind = behind the company's own plan; New = recently announced; Early = too early to judge.
Sources (16)
- Q4 FY26 earnings call transcript (call 15 May 2026)
- Q2 FY27 earnings call transcript (call 4 Nov 2026)
- Board presentation Q2 FY27 and H1 FY27
- Reg 30 disclosure: export orders of INR 1,400 crore for defence products
- Reg 30 disclosure: export orders of INR 830 crore for defence products
- Reg 30 disclosure: export orders of INR 589 crore for defence products
- Reg 30 disclosure: export orders of INR 1,076 crore for defence products
- Reg 30 disclosure: Ministry of Defence contracts worth INR 6,084 crore for Pinaka rockets
- Press release: Q2 and H1 FY27 results
- Integrated Annual Report 2025-26 (FY26)
- Reg 30 disclosure: incorporation of Solar Explochem Proprietary Limited, Botswana
- Reg 30 disclosure: additional Coal India order of INR 1,746 crore for bulk explosives
- Reg 30 disclosure: SECL order of INR 483 crore for bulk explosives
- Reg 30 disclosure: definitive agreement to acquire 100% of Omnia Holdings Limited (South Africa)
- Press release: proposed acquisition of Omnia Holdings Limited
- Reg 30 disclosure: share purchase agreement for Sivasakthi Industrial Explosives Pvt Ltd
15Financial strength and debt
15Financial strength · 30 Sep 2026
How much debt does Solar Industries have?
- Total debt₹1,705 cr
- Cash and investments₹528 cr
- Net debt (debt minus cash)₹1,177 cr
- Net worth (shareholders' money)₹7,673 cr
- Debt to equity
- 0.22×
- ₹ of debt for every ₹1 of shareholders' money
- Borrowings were ₹940 crore on 31 Mar 2025, ₹1,468 crore on 31 Mar 2026 and ₹1,705 crore on 30 Sep 2026. On 31 Mar 2025 (as restated in the FY26 annual report) cash exceeded borrowings by ₹315 crore.
- Cash and short-term investments = cash, other bank balances and current investments. Lease liabilities (rent owed under leases), not counted in borrowings, were ₹56 crore on 31 Mar 2026.
- Trade receivables rose to ₹2,340 crore and inventories to ₹2,259 crore on 30 Sep 2026, from ₹1,858 crore and ₹1,742 crore on 31 Mar 2026.
- The company's presentation puts net debt at 0.29 times EBITDA for H1 FY27, on its own EBITDA definition.
- The pending Omnia purchase is not in these figures. Management said on 15 Sep 2026 that total debt including acquisition debt should be about ₹10,000–11,000 crore by FY28, staying below two times EBITDA.
16Who owns it
16Who owns it · Q2 FY27
Who owns Solar Industries?
- Promoters (founders or parent company)73.2%, of which pledged 2.2%
- Foreign institutions (FII)6.1%
- Indian institutions (DII)13.6%
- Public and others7.2%
- Pledged: 3.0% of promoter shares (2.2% of all shares)2.2%
Promoter shares pledged
3.0% of promoter shares
A pledge means promoters gave shares as security for a loan. If the loan isn't repaid, the lender can sell them.
How ownership changed
* Pledged = share of the promoters' own holding reported as pledged. In older filings this can include shares “otherwise encumbered”; the governance flags say when.
Sources (12)
- Shareholding pattern as of 31 Dec 2023 (XBRL, with pledge data)
- Shareholding pattern as of 31 Mar 2024 (XBRL, with pledge data)
- Shareholding pattern as of 30 Jun 2024 (XBRL, with pledge data)
- Shareholding pattern as of 30 Sep 2024 (XBRL, with pledge data)
- Shareholding pattern as of 31 Dec 2024 (XBRL, with pledge data)
- Shareholding pattern as of 31 Mar 2025 (XBRL, with pledge data)
- Shareholding pattern as of 30 Jun 2025 (XBRL, with pledge data)
- Shareholding pattern as of 30 Sep 2025 (XBRL, with pledge data)
- Shareholding pattern as of 31 Dec 2025 (XBRL, with pledge data)
- Shareholding pattern as of 31 Mar 2026 (XBRL, with pledge data)
- Shareholding pattern as of 30 Jun 2026 (XBRL, with pledge data)
- Shareholding pattern as of 30 Sep 2026 (XBRL, with pledge data)
17What it does with profit
17What it does with profit
What does Solar Industries do with its profit?
Dividend per share
₹11.00FY26
Dividend paid for each share, by financial year.
₹ per share
See the numbers
No buybacks or fund raises in the period covered.
18Governance signals
18Governance signals
What do Solar Industries' governance filings show?
- Auditor
- S R B C & Co LLP and Gandhi Rathi & Co (joint auditors)
- Auditor changes
- None in the period covered
- Audit qualifications
- None reported
- Related-party dealings
- Solar's FY26 annual report says all related-party transactions were in the ordinary course of business and at arm's length, and approved by the audit committee. Its sustainability report shows related parties took 18% of the Indian parent company's FY26 sales and supplied 11% of its purchases.
- Credit rating
- Crisil (long term); ICRA (commercial paper) Crisil AA+ on bank loans and debentures; [ICRA]A1+ on ₹500 crore of commercial paper (outlook Crisil: placed on 'Rating Watch with Developing Implications' on 22 Sep 2026, after the Omnia deal (earlier AA+/Positive)), 22 Sep 2026
A credit rating describes the company's ability to repay debt. It is not a rating of the share.
Flags to know about
pledge · 30 Sep 2026
Promoter shares pledged
1,953,956 promoter shares, 2.95% of the promoter group's holding and 2.16% of all shares, were pledged on 30 Sep 2026, up from 2.27% of promoter holding in Jun 2026 and none in Dec 2023. Manish Nuwal had pledged 1,844,006 shares and Seema Nuwal 109,950.
auditor · 3 Nov 2026
Auditor change proposed for 2027
S R B C & Co LLP completes its second five-year term at the 32nd annual meeting in 2027. On 3 Nov 2026 the board approved Price Waterhouse Chartered Accountants LLP to replace it, with Gandhi Rathi & Co reappointed, as joint auditors for 2027–2032, subject to shareholder approval.
disclosure
Business split only in presentations
The audited accounts report one segment, "Explosives and its accessories". Sales by defence, domestic and international explosives appear only in investor presentations and press releases, with no profit split.
other · 26 Aug 2025
Dispute with a former director
Solar says former director Kailashchandra Nuwal vacated office from 7 Nov 2019. On his petition, NCLT Mumbai on 9 Feb 2021 restrained Solar from acting on its notice of his vacation of office. NCLAT dismissed Solar's appeal on 14 Dec 2021. The Supreme Court stayed both orders on 10 Jan 2022 and on 26 Aug 2025 disposed of Solar's appeal, noting his term (1 Apr 2016 to 31 Mar 2021) had expired.
other
Promoter family runs the company
Chairman Satyanarayan Nuwal and his son, MD and CEO Manish Nuwal, are both promoters. The promoter group held 73.15% of Solar on 30 Sep 2026.
Sources (9)
- Integrated Annual Report 2025-26 (FY26)
- Reg 30 disclosure: change in statutory auditors (Price Waterhouse Chartered Accountants LLP to replace S R B C & Co LLP)
- Crisil Ratings rationale: Crisil AA+ placed on Rating Watch with Developing Implications
- ICRA rationale: commercial paper [ICRA]A1+ outstanding
- Shareholding pattern as of 30 Sep 2026 (XBRL, with pledge data)
- Shareholding pattern as of 30 Jun 2026 (XBRL, with pledge data)
- Shareholding pattern as of 31 Dec 2023 (XBRL, with pledge data)
- Outcome of board meeting: unaudited results Q2 FY27 (quarter and half year to 30 Sep 2026), with auditor appointment
- Board presentation Q2 FY27 and H1 FY27
19What the market paid
19What the market paid · price as of 11 Nov 2026
What did the market pay for Solar Industries on 11 Nov 2026?
Price as of 11 Nov 2026 (shown for education; prices change daily).
Price as of 11 Nov 2026: ₹18,971.00, the NSE closing price. Market value = price × 90,490,055 shares = ₹171,669 crore. P/E (price ÷ earnings per share) = ₹18,971 ÷ ₹250.13, the sum of earnings per share for Q3 FY26 to Q2 FY27, = 75.8; on FY26 earnings per share of ₹185.39 it is 102.3. P/B (market value ÷ shareholders' equity of ₹7,673 crore on 30 Sep 2026) = 22.4. All are Cityfort calculations from NSE prices and Solar's filings.
- Share price
- ₹18,971.00
- Market value (market cap)
- ₹171,669 cr
- P/E
- 75.8×
- P/B
- 22.4×
Source: NSE security-wise historical price data, SOLARINDS EQ, 27 Oct to 11 Nov 2026; Shareholding pattern as of 30 Sep 2026 (XBRL, with pledge data); Consolidated financial results XBRL, Q2 FY27 (quarter and half year to 30 Sep 2026) and 3 more
Sources (6)
- NSE security-wise historical price data, SOLARINDS EQ, 27 Oct to 11 Nov 2026
- Shareholding pattern as of 30 Sep 2026 (XBRL, with pledge data)
- Consolidated financial results XBRL, Q2 FY27 (quarter and half year to 30 Sep 2026)
- Consolidated financial results XBRL, Q1 FY27 (quarter to 30 Jun 2026)
- Consolidated financial results XBRL, Q4 FY26 and FY26 (audited, to 31 Mar 2026)
- Consolidated financial results XBRL, Q3 FY26 (quarter to 31 Dec 2025)
20How it got here
20How it got here
How did Solar Industries get here?
1995
Milestone
Founded in Nagpur
Solar Industries was founded in Nagpur in 1995, according to its FY26 annual report.
2009
Business-model change
Moves into defence
In fiscal 2010 (April 2009 to March 2010) the group began making high-energy explosives, ammunition filling and fuses for defence, according to Crisil.
2023
Crisis
Fatal explosion at Chakdoh
An explosion on 17 Dec 2023 in a casting building at the Chakdoh plant killed 9 workers.
2024
Milestone
Buys Problast in South Africa
Solar acquired the Problast group on 1 Jul 2024 and held 73.99% of Problast BS on 31 Mar 2026.
2025
Business-model change
₹6,084 crore Pinaka contracts
On 6 Feb 2025 the Ministry of Defence signed ₹6,084 crore of contracts for Pinaka rockets with Solar's subsidiary.
2025
Crisis
Second fatal explosion
An explosion at Chakdoh on 4 Sep 2025 killed one person and injured eight.
2026
Milestone
Defence passes a quarter of revenue
Defence revenue reached ₹2,634 crore in FY26. Crisil puts defence at about 27% of FY26 revenue, against about 5% in FY21.
2026
Business-model change
Agrees to buy Omnia
On 14 Sep 2026 Solar agreed to buy South Africa's Omnia Holdings for about ₹12,951 crore in cash, subject to approvals.
Sources (8)
- Integrated Annual Report 2025-26 (FY26)
- Crisil Ratings rationale: Crisil AA+ placed on Rating Watch with Developing Implications
- Annual Report 2023-24 (FY24)
- Annual Report 2024-25 (FY25)
- Reg 30 disclosure: Ministry of Defence contracts worth INR 6,084 crore for Pinaka rockets
- Reg 30 disclosure: explosion incident at the Chakdoh, Nagpur factory (4 Sep 2025)
- Reg 30 disclosure: definitive agreement to acquire 100% of Omnia Holdings Limited (South Africa)
- Press release: proposed acquisition of Omnia Holdings Limited
21Sources and changes
Where every number on this page comes from
Sources (57 documents)
- S1Integrated Annual Report 2025-26 (FY26) · Solar Industries India Ltd (company IR site; filed with NSE/BSE) · Tier 1: company or exchange filing · 20 Jul 2026
- S2Annual Report 2024-25 (FY25) · Solar Industries India Ltd (company IR site; filed with NSE/BSE) · Tier 1: company or exchange filing · 27 Jun 2025
- S3Annual Report 2023-24 (FY24) · Solar Industries India Ltd (company IR site; filed with NSE/BSE) · Tier 1: company or exchange filing · 26 Jun 2024
- S4Annual Report 2022-23 (FY23) · Solar Industries India Ltd (company IR site; filed with NSE/BSE) · Tier 1: company or exchange filing · 29 May 2023
- S5Annual Report 2021-22 (FY22) · Solar Industries India Ltd (company IR site; filed with NSE/BSE) · Tier 1: company or exchange filing · 16 May 2022
- S6Outcome of board meeting: unaudited results Q2 FY27 (quarter and half year to 30 Sep 2026), with auditor appointment · Solar Industries India Ltd (company IR site; filed with NSE/BSE) · Tier 1: company or exchange filing · 3 Nov 2026
- S7Consolidated financial results XBRL, Q2 FY27 (quarter and half year to 30 Sep 2026) · Solar Industries India Ltd via NSE (XBRL filing) · Tier 1: company or exchange filing · 3 Nov 2026
- S8Consolidated financial results XBRL, Q1 FY27 (quarter to 30 Jun 2026) · Solar Industries India Ltd via NSE (XBRL filing) · Tier 1: company or exchange filing · 13 Aug 2026
- S9Consolidated financial results XBRL, Q4 FY26 and FY26 (audited, to 31 Mar 2026) · Solar Industries India Ltd via NSE (XBRL filing) · Tier 1: company or exchange filing · 15 May 2026
- S10Consolidated financial results XBRL, Q3 FY26 (quarter to 31 Dec 2025) · Solar Industries India Ltd via NSE (XBRL filing) · Tier 1: company or exchange filing · 3 Feb 2026
- S11Consolidated financial results XBRL, Q2 FY26 (quarter and half year to 30 Sep 2025) · Solar Industries India Ltd via NSE (XBRL filing) · Tier 1: company or exchange filing · 10 Nov 2025
- S12Consolidated financial results XBRL, Q1 FY26 (quarter to 30 Jun 2025) · Solar Industries India Ltd via NSE (XBRL filing) · Tier 1: company or exchange filing · 7 Aug 2025
- S13Consolidated financial results XBRL, Q4 FY25 and FY25 (audited, to 31 Mar 2025) · Solar Industries India Ltd via NSE (XBRL filing) · Tier 1: company or exchange filing · 20 May 2025
- S14Consolidated financial results XBRL, Q3 FY25 (quarter to 31 Dec 2024) · Solar Industries India Ltd via NSE (XBRL filing) · Tier 1: company or exchange filing · 6 Feb 2025
- S15Consolidated financial results XBRL, Q2 FY25 (quarter to 30 Sep 2024) · Solar Industries India Ltd via NSE (XBRL filing) · Tier 1: company or exchange filing · 14 Nov 2024
- S16Consolidated financial results XBRL, Q1 FY25 (quarter to 30 Jun 2024) · Solar Industries India Ltd via NSE (XBRL filing) · Tier 1: company or exchange filing · 7 Aug 2024
- S17Consolidated financial results XBRL, Q4 FY24 and FY24 (audited, to 31 Mar 2024) · Solar Industries India Ltd via NSE (XBRL filing) · Tier 1: company or exchange filing · 17 May 2024
- S19Consolidated financial results XBRL, Q4 FY23 and FY23 (audited, to 31 Mar 2023) · Solar Industries India Ltd via NSE (XBRL filing) · Tier 1: company or exchange filing · 4 May 2023
- S20Consolidated financial results XBRL, Q4 FY22 and FY22 (audited, to 31 Mar 2022) · Solar Industries India Ltd via NSE (XBRL filing) · Tier 1: company or exchange filing · 4 May 2022
- S21Outcome of board meeting: unaudited results Q2 FY26 (quarter and half year to 30 Sep 2025) · Solar Industries India Ltd (company IR site; filed with NSE/BSE) · Tier 1: company or exchange filing · 10 Nov 2025
- S22Unaudited results Q3 FY25 (quarter to 31 Dec 2024) · Solar Industries India Ltd (company IR site; filed with NSE/BSE) · Tier 1: company or exchange filing · 5 Feb 2025
- S23Board presentation Q2 FY27 and H1 FY27 · Solar Industries India Ltd (company IR site; filed with NSE/BSE) · Tier 1: company or exchange filing · 3 Nov 2026
- S27Q2 FY27 earnings call transcript (call 4 Nov 2026) · Solar Industries India Ltd (company IR site; filed with NSE/BSE) · Tier 1: company or exchange filing · 6 Nov 2026
- S28Q4 FY26 earnings call transcript (call 15 May 2026) · Solar Industries India Ltd via NSE · Tier 1: company or exchange filing · 18 May 2026
- S29Q3 FY26 earnings call transcript (call 4 Feb 2026) · Solar Industries India Ltd (company IR site; filed with NSE/BSE) · Tier 1: company or exchange filing · 9 Feb 2026
- S30Q2 FY26 earnings call transcript (call 11 Nov 2025) · Solar Industries India Ltd via NSE · Tier 1: company or exchange filing · 14 Nov 2025
- S31Q1 FY26 earnings call transcript, revised (call 8 Aug 2025) · Solar Industries India Ltd (company IR site; filed with NSE/BSE) · Tier 1: company or exchange filing · 5 Sep 2025
- S32Conference call on the proposed acquisition of Omnia Holdings (call 15 Sep 2026) · Solar Industries India Ltd (company IR site; filed with NSE/BSE) · Tier 1: company or exchange filing · 17 Sep 2026
- S33Press release: Q2 and H1 FY27 results · Solar Industries India Ltd (company IR site; filed with NSE/BSE) · Tier 1: company or exchange filing · 3 Nov 2026
- S36Press release: proposed acquisition of Omnia Holdings Limited · Solar Industries India Ltd (company IR site; filed with NSE/BSE) · Tier 1: company or exchange filing · 14 Sep 2026
- S37Crisil Ratings rationale: Crisil AA+ placed on Rating Watch with Developing Implications · Crisil Ratings Ltd (rationale filed by the company with NSE/BSE) · Tier 2: rating agency or regulator · 22 Sep 2026
- S38ICRA rationale: commercial paper [ICRA]A1+ outstanding · ICRA Ltd (rationale filed by the company with NSE/BSE) · Tier 2: rating agency or regulator · 23 Sep 2026
- S39Reg 30 disclosure: definitive agreement to acquire 100% of Omnia Holdings Limited (South Africa) · Solar Industries India Ltd (company IR site; filed with NSE/BSE) · Tier 1: company or exchange filing · 14 Sep 2026
- S40Reg 30 disclosure: share purchase agreement for Sivasakthi Industrial Explosives Pvt Ltd · Solar Industries India Ltd via NSE · Tier 1: company or exchange filing · 15 Oct 2026
- S41Reg 30 disclosure: incorporation of Solar Explochem Proprietary Limited, Botswana · Solar Industries India Ltd (company IR site; filed with NSE/BSE) · Tier 1: company or exchange filing · 29 Sep 2026
- S42Reg 30 disclosure: change in statutory auditors (Price Waterhouse Chartered Accountants LLP to replace S R B C & Co LLP) · Solar Industries India Ltd (company IR site; filed with NSE/BSE) · Tier 1: company or exchange filing · 3 Nov 2026
- S43Reg 30 disclosure: explosion incident at the Chakdoh, Nagpur factory (4 Sep 2025) · Solar Industries India Ltd (company IR site; filed with NSE/BSE) · Tier 1: company or exchange filing · 4 Sep 2025
- S44Reg 30 disclosure: Ministry of Defence contracts worth INR 6,084 crore for Pinaka rockets · Solar Industries India Ltd (company IR site; filed with NSE/BSE) · Tier 1: company or exchange filing · 6 Feb 2025
- S45Reg 30 disclosure: additional Coal India order of INR 1,746 crore for bulk explosives · Solar Industries India Ltd (company IR site; filed with NSE/BSE) · Tier 1: company or exchange filing · 31 Dec 2025
- S46Reg 30 disclosure: SECL order of INR 483 crore for bulk explosives · Solar Industries India Ltd (company IR site; filed with NSE/BSE) · Tier 1: company or exchange filing · 8 Oct 2025
- S47Reg 30 disclosure: export orders of INR 1,400 crore for defence products · Solar Industries India Ltd (company IR site; filed with NSE/BSE) · Tier 1: company or exchange filing · 18 Nov 2025
- S48Reg 30 disclosure: export orders of INR 830 crore for defence products · Solar Industries India Ltd via NSE · Tier 1: company or exchange filing · 30 Jan 2026
- S49Reg 30 disclosure: export orders of INR 589 crore for defence products · Solar Industries India Ltd via NSE · Tier 1: company or exchange filing · 30 Jan 2026
- S50Reg 30 disclosure: export orders of INR 1,076 crore for defence products · Solar Industries India Ltd (company IR site; filed with NSE/BSE) · Tier 1: company or exchange filing · 29 May 2026
- S51Shareholding pattern as of 31 Dec 2023 (XBRL, with pledge data) · Solar Industries India Ltd via NSE · Tier 1: company or exchange filing · 12 Jan 2024
- S52Shareholding pattern as of 31 Mar 2024 (XBRL, with pledge data) · Solar Industries India Ltd via NSE · Tier 1: company or exchange filing · 11 Apr 2024
- S53Shareholding pattern as of 30 Jun 2024 (XBRL, with pledge data) · Solar Industries India Ltd via NSE · Tier 1: company or exchange filing · 12 Jul 2024
- S54Shareholding pattern as of 30 Sep 2024 (XBRL, with pledge data) · Solar Industries India Ltd via NSE · Tier 1: company or exchange filing · 11 Oct 2024
- S55Shareholding pattern as of 31 Dec 2024 (XBRL, with pledge data) · Solar Industries India Ltd via NSE · Tier 1: company or exchange filing · 8 Jan 2025
- S56Shareholding pattern as of 31 Mar 2025 (XBRL, with pledge data) · Solar Industries India Ltd via NSE · Tier 1: company or exchange filing · 17 Apr 2025
- S57Shareholding pattern as of 30 Jun 2025 (XBRL, with pledge data) · Solar Industries India Ltd via NSE · Tier 1: company or exchange filing · 11 Jul 2025
- S58Shareholding pattern as of 30 Sep 2025 (XBRL, with pledge data) · Solar Industries India Ltd via NSE · Tier 1: company or exchange filing · 13 Oct 2025
- S59Shareholding pattern as of 31 Dec 2025 (XBRL, with pledge data) · Solar Industries India Ltd via NSE · Tier 1: company or exchange filing · 9 Jan 2026
- S60Shareholding pattern as of 31 Mar 2026 (XBRL, with pledge data) · Solar Industries India Ltd via NSE · Tier 1: company or exchange filing · 10 Apr 2026
- S61Shareholding pattern as of 30 Jun 2026 (XBRL, with pledge data) · Solar Industries India Ltd via NSE · Tier 1: company or exchange filing · 16 Jul 2026
- S62Shareholding pattern as of 30 Sep 2026 (XBRL, with pledge data) · Solar Industries India Ltd via NSE · Tier 1: company or exchange filing · 19 Oct 2026
- S63NSE security-wise historical price data, SOLARINDS EQ, 27 Oct to 11 Nov 2026 · National Stock Exchange of India · Tier 1: company or exchange filing · 12 Nov 2026
Changes to this page (v1 · 12 Nov 2026)
- v1 · 12 Nov 2026First version. (first version)
Numbers come only from tier 1 and tier 2 sources. Read how we research.
Disclaimer
For learning only. Cityfort is not a SEBI-registered adviser and does not recommend buying or selling any security. Prices shown are dated and may be out of date.
Investing in securities involves risk, including loss of capital. Before making any investment decision, do your own research and consider consulting a SEBI-registered investment adviser.
Cityfort, its owners and contributors may or may not hold securities of companies covered. Content is not an offer or solicitation to buy or sell any security.
Read the full disclaimerHide the full disclaimer
Cityfort publishes educational content that explains how listed companies work. Cityfort is not registered with the Securities and Exchange Board of India (SEBI) as an Investment Adviser or Research Analyst and does not provide investment advice, recommendations, ratings, price targets or any opinion on whether to buy, sell or hold any security.
All information is taken from publicly available sources, mainly company filings on BSE and NSE, which are listed on each page with dates. We work to keep it accurate and correct errors publicly, but we do not guarantee that it is complete, accurate or up to date. Any market price or price-based ratio shown is dated, may be out of date by the time you read it, and is included only to explain concepts.
Statements by company management are reported as statements, with their date and source; they are not our forecasts.