Financial Services · NSE: PNB · BSE: 532461
PNB: how the business works
Punjab National Bank, a government-controlled bank, takes deposits and lends across India, earning ₹16,904 crore of bank-only profit in FY26.
Follow PNB
Email me when PNB's page is updated after results.
We store your email address with Kit, our email provider, which also records when you sign up and whether you open or click our emails. We send a confirmation email first. See our privacy policy.
Punjab National Bank · New Delhi, Delhi · Founded 1895
Updated for Q2 FY27 · checked
- Deposits, 30 Sep 2026
- ₹1,777,240 cr
- Loans (net advances), 30 Sep 2026
- ₹1,310,451 cr
- Bank-only net profit, FY26
- ₹16,904 cr
- Branches in India, 30 Sep 2026
- 10,481
- Promoter (Government of India), Sep 2026
- 70.08%
The short version
PNB in 5 points
1 · What it sells
Punjab National Bank lends to companies, farmers, small businesses and households, with net loans of ₹1,310,451 crore at 30 Sep 2026, funded mostly by deposits of ₹1,777,240 crore.
2 · Who pays it
Borrowers pay PNB interest, and at 30 Sep 2026 companies and other borrowers had 42.6% of its domestic loans, retail borrowers 23.6%, small businesses 17.1% and agriculture 16.7%.
3 · What it keeps from ₹100
Of every ₹100 that came in to PNB alone in FY26 it kept ₹11.5 as profit, in a year with a one-time ₹3,324 crore tax charge and a ₹2,121 crore actuarial gain on staff costs cited by the MD & CEO (the CFO put the AS-15 reversal at ₹736 crore); profit before provisions and tax was ₹29,290 crore.
4 · Where the operating profit comes from
Corporate and wholesale banking made ₹12,131 crore of PNB's FY26 segment result before unallocated costs and tax, treasury ₹11,128 crore, retail banking ₹9,561 crore and other banking ₹1,000 crore.
5 · The one thing to watch
PNB's reported global net interest margin fell from 3.09% in FY24 to 2.57% in FY26 and was 2.58% in Q2 FY27, while its domestic CASA share fell from 41.44% at 31 Mar 2024 to 36.6% at 30 Sep 2026.
Sources: From PNB's FY22–FY26 annual reports and results filings, its Q2 FY27 results, press release and presentation, and its Q3 FY26 to Q2 FY27 call transcripts · checked
Sources (7)
- XBRL financial results Q2 FY27, standalone
- Press release: results for the quarter ended 30 Sep 2026
- Analyst presentation Q2 FY27 (quarter ended 30 Sep 2026)
- XBRL financial results Q4 FY26 and FY26 (audited), standalone
- Annual Report FY26 (2025-26), incl. standalone and consolidated financial statements
- Earnings call transcript Q4 FY26 (call 5 May 2026)
- Annual Report FY24 (2023-24)
01Where the money goes · FY26
Where does ₹100 of PNB's money go?
PNB · FY26
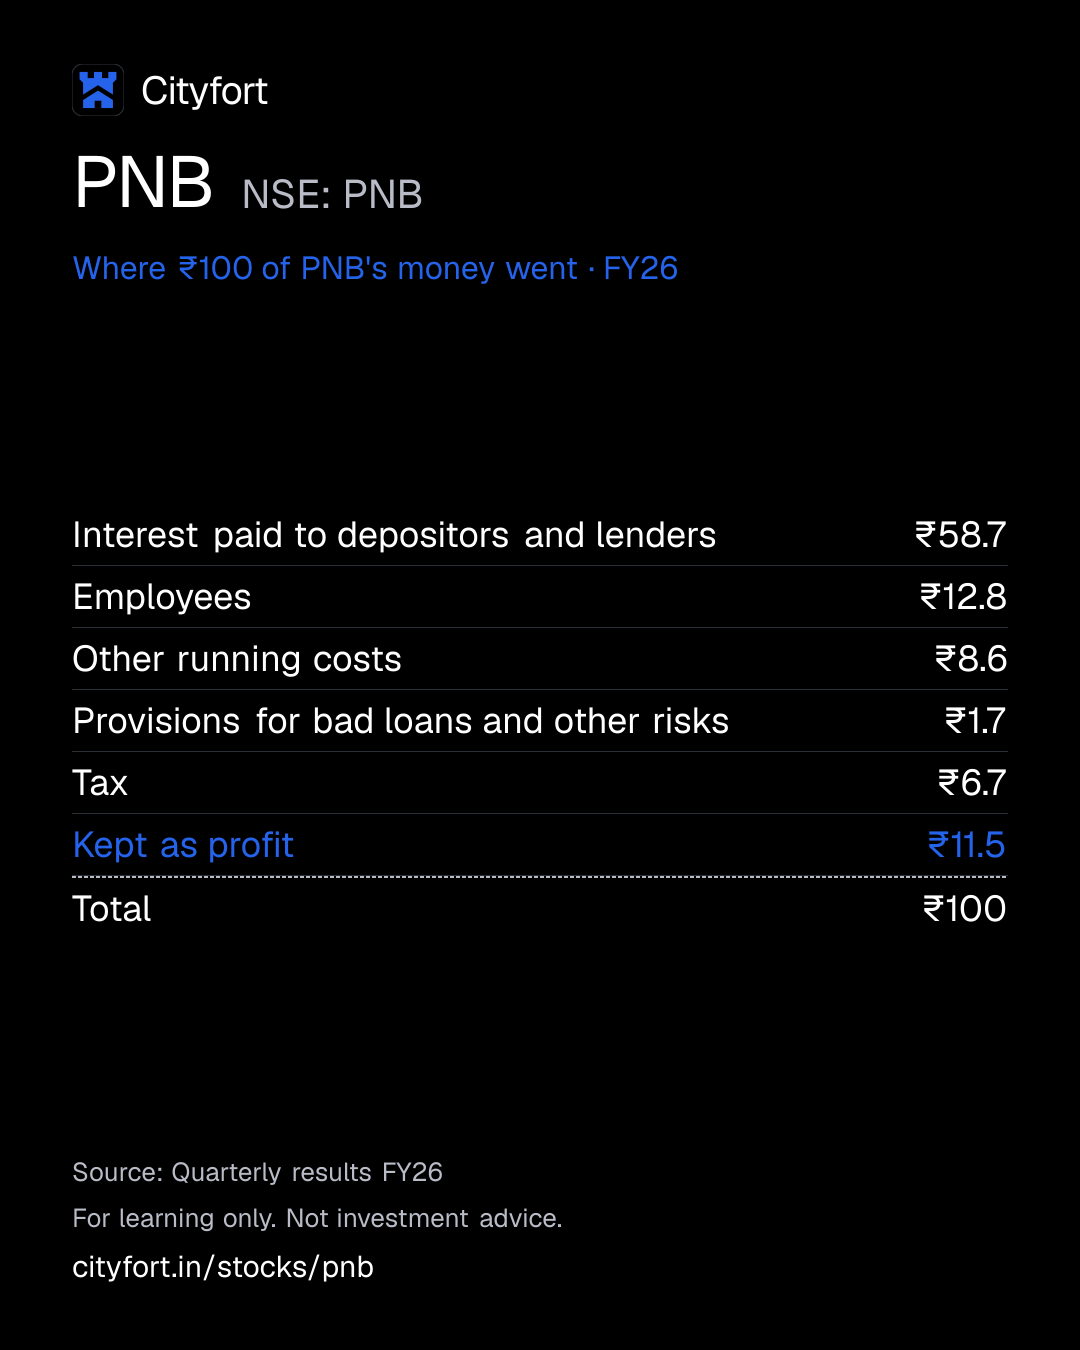
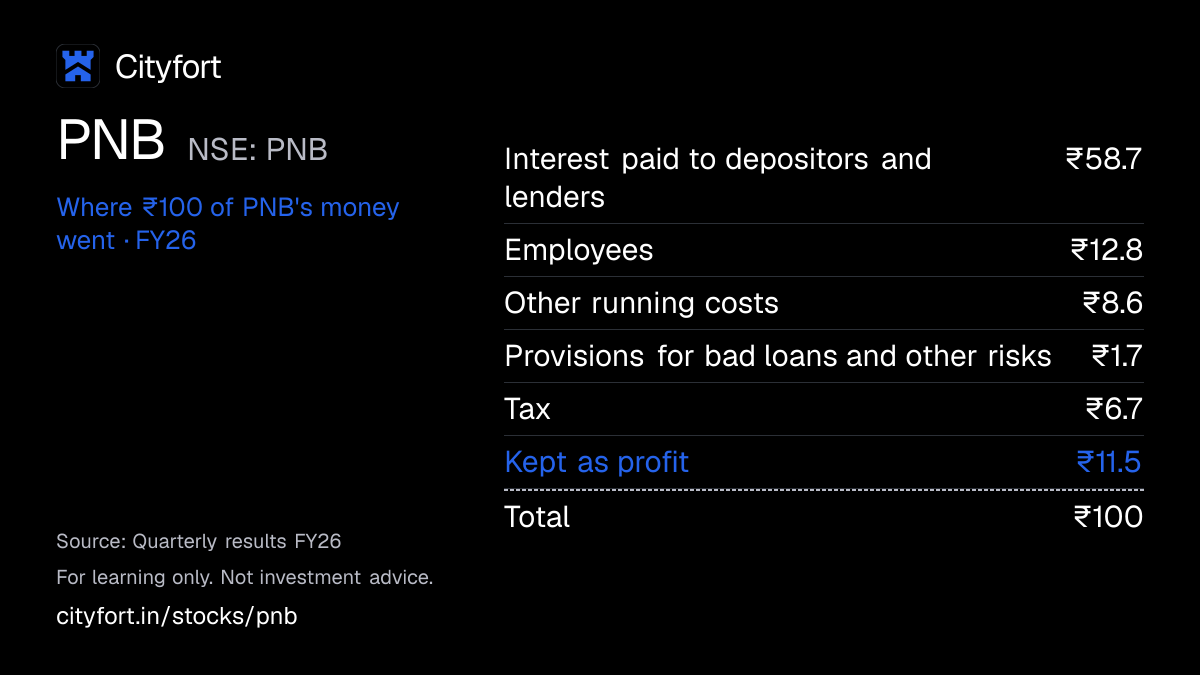
Receipt for every ₹100
| Interest paid to depositors and lenders | ₹58.7 |
|---|---|
| Employees | ₹12.8 |
| Other running costs | ₹8.6 |
| Provisions for bad loans and other risks | ₹1.7 |
| Tax | ₹6.7 |
| Kept as profit | ₹11.5 |
| Total | ₹100 |
Each line = amount ÷ total money in × 100. Lines may not add to exactly ₹100 because of rounding.
How this is worked out
Of every ₹100 that came in to PNB alone (standalone) in FY26. Money in = interest earned ₹128,223 crore + other income ₹18,794 crore. Cityfort calculation from the FY26 results filing; other running costs (8.65) rounded down so the lines add to 100.
Save this receipt as an image
Embed this receipt or the key numbers
Paste this code into a blog or website to show the card you choose, with a link back to this page.
Each week: the next company due to report results, explained in 5 points.
We'll email you once a week with what changed on Cityfort. Facts only, no tips. Unsubscribe any time.
We store your email address with Kit, our email provider, which also records when you sign up and whether you open or click our emails. We send a confirmation email first. See our privacy policy.
02The business in one line
What does PNB do?
Borrowers pay Punjab National Bank interest; in FY26, ₹58.7 of every ₹100 that came in went to depositors and lenders, and ₹11.5 was profit.
- Interest on loans and investments was ₹82.9 of every ₹100 that came in during FY26, and all interest earned ₹87.2. Fees, recoveries on written-off loans, treasury gains and other income made up the other ₹12.8.
- The promoter is the Government of India (shares held by the President of India), with 70.08% at 30 Sep 2026. None of those shares are pledged.
03Who pays it
Who pays PNB?
PNB does not disclose how much each type of customer pays.
Companies and other large borrowers
Pay interest on corporate loans: ₹535,088 crore, 42.6% of domestic loans at 30 Sep 2026.
Retail borrowers
Pay interest on home, vehicle and other personal loans: ₹296,925 crore, 23.6% of domestic loans at 30 Sep 2026.
Small businesses (MSME)
Pay interest on MSME loans: ₹214,619 crore, 17.1% of domestic loans at 30 Sep 2026.
Farmers
Pay interest on agriculture loans: ₹210,451 crore, 16.7% of domestic loans at 30 Sep 2026.
Customers paying fees
Pay fees on loans, accounts and other services: ₹1,954 crore of fee income in Q2 FY27, up 16.0% from Q2 FY26.
How spread out the customers are
PNB does not disclose income by customer. The shares above are the bank's split of domestic gross loans, not of income. ICRA says the top 20 depositors held 3.41% of deposits at 31 Mar 2025.
04How it makes money
How does PNB make money?
A bank earns the gap between the interest it charges and the interest it pays
PNB takes deposits, lends at higher rates and keeps the gap, called net interest income (NII). More than half its loans are linked to RBI's repo rate, management said in Jan 2026. So when RBI cut that rate by 125 basis points, loan rates fell faster than deposit costs.
Interest kept per ₹100 of interest earned, after paying interest (bank only)
₹38.3₹32.7
FY22 to FY26
- Savers and firms deposit money, part of it in low-interest current and savings accounts
- The bank lends to companies, farmers, small businesses and households at higher rates
- The gap is net interest income: ₹41,960 crore in FY26
- Fees, recoveries on old bad loans and treasury gains add income
- Staff, branches and provisions for bad loans are paid out of it
- Profit adds to capital, which lets the bank lend more
↺ Step 6 feeds back into step 1.
05Business segments · FY26
Which businesses make up PNB?
Corporate and wholesale banking
38.2%Loans and services for companies. Result is before unallocated costs and tax.
Revenue ₹56,157 cr · Operating profit ₹12,131 cr
Retail banking
29.7%Loans and deposits for individuals and small businesses. Result is before unallocated costs and tax.
Revenue ₹43,707 cr · Operating profit ₹9,561 cr
Treasury
29.4%The bank's own investments, mostly bonds, and trading.
Revenue ₹43,229 cr · Operating profit ₹11,128 cr
Other banking
2.7%Other banking business the bank reports as a separate segment.
Revenue ₹3,924 cr · Operating profit ₹1,000 cr
How the mix changed
- Corporate and wholesale banking
- Retail banking
- Treasury
- Other banking
Revenue by segment, FY22 to FY26.
₹ crore
See the numbers
Sources (5)
- XBRL financial results Q4 FY22 and FY22 (audited), standalone
- XBRL financial results Q4 FY23 and FY23 (audited), standalone
- XBRL financial results Q4 FY24 and FY24 (audited), standalone (refiled 3 Sep 2024, same values)
- XBRL financial results Q4 FY25 and FY25 (audited), standalone
- XBRL financial results Q4 FY26 and FY26 (audited), standalone
06The numbers · bank only (standalone) · ₹ crore
How has PNB done?
Net interest income
₹41,960 crFY26
Bank-only net interest income (NII: interest earned minus interest paid) rose from ₹28,694 crore in FY22 to ₹42,782 crore in FY25, then fell 1.9% to ₹41,960 crore in FY26.
₹ crore · bank only (standalone) · interest earned minus interest paid
See the yearly numbers
See the quarterly numbers
Net profit
₹16,904 crFY26
Bank-only net profit rose from ₹3,457 crore in FY22 to ₹16,904 crore in FY26; Q1 FY26 (₹1,675 crore) carried a ₹3,324 crore one-time tax charge.
₹ crore · bank only (standalone)
See the yearly numbers
See the quarterly numbers
Net interest margin
2.57%FY26
Global net interest margin, as reported, rose from 2.71% in FY22 to 3.09% in FY24, fell to 2.57% in FY26 and was 2.58% in Q2 FY27.
% · as reported by the company
See the numbers
Bad loans (gross NPA)
2.95%FY26
Gross NPA (loans not being repaid) fell from 11.78% of loans in FY22 to 2.95% in FY26 and 2.55% at 30 Sep 2026.
% of loans · gross and net (after provisions) non-performing assets
See the yearly numbers
See the quarterly numbers
See all yearly numbers
EPS is group (consolidated) EPS, as filed. Q1 FY26 and FY26 are after the ₹3,324 crore one-time tax charge.
Net interest income = interest earned on loans and investments minus interest paid on deposits and borrowings. Provisions = money set aside for loans that may not be repaid. Financial year runs April to March.
- Lending numbers and ratios here are PNB alone (standalone), as the bank reports them. Total income, net profit and EPS under "The numbers" are group (consolidated) figures, which add subsidiaries such as PNB Gilts and associates such as PNB Housing Finance.
- All five years (FY22–FY26) are after Oriental Bank of Commerce and United Bank of India merged into PNB on 1 Apr 2020, so no year needs restating.
- Staff cost fell 12% in FY26. The MD & CEO said on the 5 May 2026 call that staff cost included a ₹2,121 crore actuarial gain (AS-15), plus release of extra provisions made earlier in the year; the CFO put the AS-15 reversal at ₹736 crore.
- Provisions: Q3 FY25 was a net write-back (₹285 crore). In Q2 FY27, total provisions of ₹97 crore are net of other lines; management said the bank also made a ₹1,150 crore extra standard-asset provision that quarter.
- NIM is the bank's global NIM, as reported (domestic NIM was 2.74% in Q2 FY27). CASA is the domestic CASA share (CASA ÷ deposits in India), as the bank reports it, not a share of global deposits. Cost-to-income is as reported (operating expenses ÷ (NII + other income)).
- Provision cover (PCR) includes technical write-offs, as the bank headlines it; excluding them it was 90.28% at 31 Mar 2026 and 90.31% at 30 Sep 2026. FY23 PCR is 86.90% as in the FY24 and FY26 annual reports; the FY25 annual report shows 85.90%.
- Loans are net advances from the balance sheet. Global gross advances were ₹1,258,559 crore at 31 Mar 2026 and ₹1,341,194 crore at 30 Sep 2026.
Sources (20)
- XBRL financial results Q4 FY22 and FY22 (audited), standalone
- Annual Report FY25 (2024-25)
- Annual Report FY22 (2021-22) (zip on NSE)
- XBRL financial results Q4 FY23 and FY23 (audited), standalone
- Annual Report FY26 (2025-26), incl. standalone and consolidated financial statements
- Annual Report FY23 (2022-23) (zip on NSE)
- XBRL financial results Q4 FY24 and FY24 (audited), standalone (refiled 3 Sep 2024, same values)
- Annual Report FY24 (2023-24)
- XBRL financial results Q4 FY25 and FY25 (audited), standalone
- XBRL financial results Q4 FY26 and FY26 (audited), standalone
- XBRL financial results Q3 FY25, standalone
- Analyst presentation Q3 FY26 (revised filing)
- Analyst presentation Q4 FY26 and FY26
- XBRL financial results Q1 FY26, standalone
- Analyst presentation Q1 FY27 (quarter ended 30 Jun 2026)
- XBRL financial results Q2 FY26 (revised filing), standalone
- Analyst presentation Q2 FY27 (quarter ended 30 Sep 2026)
- XBRL financial results Q3 FY26, standalone
- XBRL financial results Q1 FY27, standalone
- XBRL financial results Q2 FY27, standalone
07Who runs it
Who runs PNB, and did they deliver?
Ashok Chandra
Managing Director & CEO · since 2025
Took office on 16 Jan 2025 under a Government of India notification.
M Paramasivam, Bibhu Prasad Mahapatra, D Surendran, Amit Kumar Srivastava
Executive Directors
The four executive directors on the Q4 FY26 earnings call (5 May 2026).
Non-Executive Chairman
Vacant
The post was vacant at 31 Mar 2026; K G Ananthakrishnan's tenure ended in Nov 2025, the annual report says.
Sushil Katara
Part-time non-official director · since 2026
Nominated by the government on 9 Oct 2026 for three years.
What they said, and what happened
4 too early to tell
Said on 16 Oct 2026
FY27 guidance, in the bank's Q2 FY27 presentation: credit growth of 12%–13%.
Too early to tellWhat happened
Global gross advances grew 14.7% in the year to 30 Sep 2026. The full year ends on 31 Mar 2027.
Said on 16 Oct 2026
FY27 guidance, in the bank's Q2 FY27 presentation: a global net interest margin of 2.60%–2.70%.
Too early to tellWhat happened
Global NIM was 2.50% in Q1 FY27, 2.58% in Q2 FY27 and 2.54% for H1 FY27, as reported.
Said on 16 Oct 2026
FY27 guidance, in the bank's Q2 FY27 presentation: gross NPA below 2.50% and credit cost below 0.4%.
Too early to tellWhat happened
Gross NPA was 2.55% at 30 Sep 2026. Credit cost was 0.25% (annualised) in H1 FY27, the bank says.
Said on 16 Oct 2026
FY27 guidance, in the bank's Q2 FY27 presentation: a domestic CASA share of 38%.
Too early to tellWhat happened
The domestic CASA share was 36.6% at 30 Sep 2026, against 37.3% a year earlier.
Sources (5)
- Ashok Chandra assumes office as MD & CEO from 16 Jan 2025
- Earnings call transcript Q4 FY26 (call 5 May 2026)
- Annual Report FY26 (2025-26), incl. standalone and consolidated financial statements
- Government nominates Sushil Katara as part-time non-official director (9 Oct 2026)
- Analyst presentation Q2 FY27 (quarter ended 30 Sep 2026)
08What could go wrong
What could go wrong for PNB?
- Pricing
Thinner lending margin
Global NIM, as reported, fell from 3.09% in FY24 to 2.57% in FY26, and NII fell 1.9% in FY26. Management said more than half of loans are linked to the repo rate and reprice the next working day after a cut.
Watch Quarterly global NIM against the bank's 2.60%–2.70% FY27 guidance.
- Competition
Costlier deposits
The domestic CASA share fell from 47.43% in FY22 to 36.6% at 30 Sep 2026. Global cost of deposits was 4.96% in Q2 FY27, against 5.18% a year earlier.
Watch Domestic CASA share and cost of deposits each quarter.
- Regulation
New expected-credit-loss rules from 1 Apr 2027
Banks move to expected credit loss (ECL) provisioning from 1 Apr 2027. Management said on 16 Oct 2026 the impact on PNB's loan book is "around INR 8,000 crores now". ICRA says management estimated a 75–80 basis-point hit to capital ratios, which can be spread to 31 Mar 2031.
Watch ECL estimates in each results call and the CET1 ratio (14.44% at 30 Sep 2026).
- Debt
Bad loans and frauds
Fresh slippages (loans newly turning bad) were ₹2,395 crore in Q2 FY27, against ₹1,955 crore in Q2 FY26. In Dec 2025 the bank reported borrowal fraud of ₹2,434 crore on two SREI companies to RBI, fully provided for.
Watch Slippages, gross NPA and credit cost each quarter.
- Other
One-off items in profit
Q1 FY26 profit carried a ₹3,324 crore one-time tax charge, so H1 FY27 profit rose 63.9% on a low base. FY26 staff cost included a ₹2,121 crore actuarial gain, the MD & CEO said on 5 May 2026; on the same call the CFO put the AS-15 reversal at ₹736 crore. Q2 FY27 provisions were only ₹97 crore after other lines netted off.
Watch One-time items in each quarter's results notes and presentation.
- Governance
Government control and board vacancies
The Government of India holds 70.08% and the MD & CEO took office under a government notification. The Non-Executive Chairman post was vacant at 31 Mar 2026.
Watch Government notifications on board appointments filed with the exchanges.
- Regulation
Regulatory actions
SEBI sent a warning letter (30 Sep 2026) that the bank says concerns insider-trading violations by designated persons and their relatives; the bank says it imposes no financial penalty. RBI imposed a ₹124,913.01 penalty on 10 Nov 2026 over currency chest guidelines.
Watch RBI and SEBI intimations filed with the exchanges.
- Other
Wage revision due in 2027
Staff cost was ₹18,747 crore in FY26, 12.8 of every ₹100 that came in. Management said on 5 May 2026 the next wage revision is due from 1 Nov 2027.
Watch Employee cost and any wage-settlement provisions each quarter.
Sources (14)
- Annual Report FY26 (2025-26), incl. standalone and consolidated financial statements
- XBRL financial results Q4 FY26 and FY26 (audited), standalone
- Earnings call transcript Q3 FY26 (call 19 Jan 2026)
- Annual Report FY22 (2021-22) (zip on NSE)
- Analyst presentation Q2 FY27 (quarter ended 30 Sep 2026)
- Earnings call transcript Q2 FY27 (call 16 Oct 2026)
- Earnings call transcript Q4 FY26 (call 5 May 2026)
- ICRA rationale: Punjab National Bank, ratings reaffirmed, two redeemed bonds withdrawn (5 Dec 2025), as filed with the exchange
- Borrowal fraud reported to RBI against erstwhile promoters of SREI Equipment Finance and SREI Infrastructure Finance (100% provided)
- XBRL financial results Q2 FY27, standalone
- Shareholding pattern (XBRL), 30 Sep 2026
- Ashok Chandra assumes office as MD & CEO from 16 Jan 2025
- SEBI administrative warning letter on insider-trading violations by three designated persons and relatives; no financial penalty
- RBI monetary penalty of Rs 1,24,913.01 (currency chest operational guidelines)
09Supporters and critics
What do supporters and critics point to?
What supporters point to
- Gross NPA fell from 11.78% of loans in FY22 to 2.55% at 30 Sep 2026; net NPA was 0.25%.
- Provision cover, including written-off loans, was 97.32% at 30 Sep 2026, as the bank reports it.
- CET1 capital (the core part of the bank's own money) rose from 10.56% of risk-weighted assets in FY22 to 14.44% at 30 Sep 2026.
- Global gross advances grew 14.7% in the year to 30 Sep 2026, above the bank's 12%–13% FY27 guidance.
- On 5 Dec 2025 ICRA rated the bank's infrastructure bonds (₹1,200 crore) and fixed deposits AAA (Stable), and its Basel III Tier I bonds AA+ (Stable). The ratings cover debt, not the shares.
What critics point to
- Global NIM, as reported, fell from 3.09% in FY24 to 2.57% in FY26, and NII fell 1.9% in FY26.
- The domestic CASA share fell from 47.43% in FY22 to 36.6% at 30 Sep 2026, below the bank's 38% FY27 guidance.
- Operating profit grew 4.2% in Q2 FY27, against the bank's 9%–10% FY27 guidance.
- Management said the new loss-provisioning rules from 1 Apr 2027 would hit the loan book by "around INR 8,000 crores".
- SEBI sent a warning letter (Sep 2026) that the bank says concerns insider-trading violations by designated persons and their relatives, and RBI imposed a ₹124,913.01 penalty (Nov 2026).
10What to watch next
What should you watch next at PNB?
Next event
Q3 FY27 results (date not announced yet)
Date not announced yet.
Net interest margin
Global NIM was 2.58% in Q2 FY27, up from 2.50% in Q1 FY27. The bank's FY27 guidance is 2.60%–2.70%.
Deposit mix
The domestic CASA share was 36.6% at 30 Sep 2026, against 37.3% a year earlier. The bank's FY27 guidance is 38%.
Provisions before the ECL rules
Q2 FY27 provisions were ₹97 crore. Management put the ECL impact on the loan book at around ₹8,000 crore from 1 Apr 2027.
11Key facts
Key facts about PNB
- What does Punjab National Bank do?
- Punjab National Bank (PNB) is a government-controlled bank in India. Punjab National Bank takes deposits and lends to companies, farmers, small businesses and households. At 30 Sep 2026 Punjab National Bank held deposits of ₹1,777,240 crore and net loans of ₹1,310,451 crore.
- How does Punjab National Bank make money?
- Punjab National Bank earns mainly the gap between the interest it charges borrowers and the interest it pays depositors and lenders. In FY26, Punjab National Bank's own net interest income was ₹41,960 crore. Its other income, including fees, recoveries and treasury gains, was ₹18,794 crore.
- Who are Punjab National Bank's customers?
- Punjab National Bank has more than 18 crore customers, its MD & CEO said on 19 Jan 2026. Of Punjab National Bank's domestic loans at 30 Sep 2026, companies and other borrowers had 42.6%, retail borrowers 23.6%, small businesses (MSME) 17.1% and agriculture 16.7%.
- How big is Punjab National Bank?
- Punjab National Bank's bank-only net profit was ₹16,904 crore in FY26, up from ₹16,630 crore in FY25. Group profit for Punjab National Bank shareholders, including subsidiaries and associates, was ₹18,393 crore in FY26. ICRA called Punjab National Bank the fifth-largest bank in India by net advances at 30 Sep 2025.
- Who owns Punjab National Bank?
- The Government of India (shares held by the President of India) is Punjab National Bank's promoter, with 70.08% of shares at 30 Sep 2026; none are pledged. Indian institutions held 16.13% of Punjab National Bank shares, foreign investors 6.66%, and individuals and others 7.13%.
- What is Punjab National Bank's net interest margin?
- Net interest margin (NIM) is net interest income as a share of the money a bank has lent and invested. Punjab National Bank reported a global NIM of 2.57% for FY26, down from 3.09% in FY24. Punjab National Bank reported 2.58% for Q2 FY27 (Jul–Sep 2026).
- How many of Punjab National Bank's loans have gone bad?
- Punjab National Bank's gross NPA (loans not being repaid) was 2.55% of its loans at 30 Sep 2026, down from 11.78% at 31 Mar 2022. After money already set aside, Punjab National Bank's net NPA was 0.25% at 30 Sep 2026.
- Which banks merged into Punjab National Bank?
- Oriental Bank of Commerce and United Bank of India merged into Punjab National Bank on 1 Apr 2020. Every Punjab National Bank year from FY22 to FY26 shown on this page is after that merger.
- Why was Punjab National Bank's profit low in Q1 FY26?
- Punjab National Bank's bank-only profit in Q1 FY26 (Apr–Jun 2025) was ₹1,675 crore, after ₹3,324.24 crore of extra tax on moving to the new income-tax regime. Punjab National Bank's profit in the other three FY26 quarters was between ₹4,904 crore and ₹5,225 crore.
- Who runs Punjab National Bank?
- Ashok Chandra has been Punjab National Bank's MD & CEO since 16 Jan 2025, appointed by a Government of India notification. The post of Non-Executive Chairman of Punjab National Bank was vacant at 31 Mar 2026, the FY26 annual report says.
Sources (15)
- Press release: results for the quarter ended 30 Sep 2026
- XBRL financial results Q2 FY27, standalone
- XBRL financial results Q4 FY26 and FY26 (audited), standalone
- Earnings call transcript Q3 FY26 (call 19 Jan 2026)
- Analyst presentation Q2 FY27 (quarter ended 30 Sep 2026)
- XBRL financial results Q4 FY25 and FY25 (audited), standalone
- XBRL financial results Q4 FY26 and FY26 (audited), consolidated
- ICRA rationale: Punjab National Bank, ratings reaffirmed, two redeemed bonds withdrawn (5 Dec 2025), as filed with the exchange
- Shareholding pattern (XBRL), 30 Sep 2026
- Annual Report FY26 (2025-26), incl. standalone and consolidated financial statements
- Annual Report FY25 (2024-25)
- Annual Report FY22 (2021-22) (zip on NSE)
- XBRL financial results Q1 FY26, standalone
- XBRL financial results Q2 FY26 (revised filing), standalone
- Ashok Chandra assumes office as MD & CEO from 16 Jan 2025
Terms on this page
- CASA ratio
- Credit rating
- FII and DII holding
- Gross and net NPA
- Market capitalisation
- Net interest margin (NIM)
- Net profit
- Promoter holding
- Provision coverage ratio (PCR)
- Public shareholding
Each explains the term in plain English, with the same number from other companies on Cityfort.
Go deeper
More detail from the same filings. Open any section.
12What it sells
12What it sells
What does PNB sell?
Deposits: savings, current and fixed
Deposits were ₹1,777,240 crore at 30 Sep 2026. Of the ₹1,711,840 crore held in India, 36.6% sat in current and savings accounts (CASA), which pay little or no interest.
Loans to companies
Corporate and other loans in India were ₹535,088 crore at 30 Sep 2026, 42.6% of domestic loans, up 10.9% in a year.
Retail loans
Loans to individuals were ₹296,925 crore (23.6% of domestic loans). Home loans were ₹141,836 crore and vehicle loans ₹38,234 crore.
Loans to farmers
Agriculture loans were ₹210,451 crore at 30 Sep 2026, 16.7% of domestic loans, up 14.4% in a year.
Loans to small businesses (MSME)
Loans to micro, small and medium enterprises were ₹214,619 crore at 30 Sep 2026, 17.1% of domestic loans, up 19.8% in a year.
Fees, recoveries and treasury
Fee income was ₹1,954 crore in Q2 FY27. The bank also recovered ₹808 crore from loans written off earlier, and made ₹753 crore of treasury income.
What it does
- Does: Takes savings, current and fixed deposits
- Does: Lends to companies, farmers, small businesses, home buyers and car buyers
- Does: Runs 10,481 branches in India and 2 international branches (Dubai and GIFT City) at 30 Sep 2026
- Does: Owns 74.07% of PNB Gilts and 51% of Druk PNB Bank in Bhutan
What it does not do
- Does not: Belong to a business family: the Government of India held 70.08% of shares at 30 Sep 2026
- Does not: Own PNB Housing Finance or PNB MetLife outright: it held 28.01% and 30% at 30 Sep 2026
- Does not: Still hold 23% of Canara HSBC Life: it sold down to 13% in Oct 2025
13How the money flows
13How the money flows · FY26
How does money flow through PNB?
Money in
- Interest earned (loans, investments and other)₹128,223 cr
- Fees, recoveries, treasury gains and other income₹18,794 cr
The company
PNB
₹147,017 cr came in
Money out
- Interest paid to depositors and lenders₹86,263 cr
- Employees₹18,747 cr
- Other running costs₹12,717 cr
- Provisions for bad loans and other risks₹2,540 cr
- Tax₹9,846 cr
- Net profit (bank only)₹16,904 cr
- These are PNB's own FY26 accounts (standalone), without its subsidiaries and associates.
- Savers, companies and other lenders provide the money. In FY26 the bank paid them ₹86,263 crore of interest.
- It lends and invests that money. Interest earned was ₹128,223 crore, and fees and other income added ₹18,794 crore.
- Staff cost ₹18,747 crore and other running costs ₹12,717 crore. The MD & CEO said on the 5 May 2026 call that staff cost included a ₹2,121 crore actuarial gain; the CFO put the AS-15 reversal at ₹736 crore.
- After ₹2,540 crore of provisions and ₹9,846 crore of tax, ₹16,904 crore was profit.
14What it needs to run
14What it needs to run
What does PNB need to run?
A banking licence and capital
RBI requires each bank to hold its own money (capital) against its loans, weighted by risk. That share is called CRAR. PNB's was 17.95% at 30 Sep 2026; its core part (CET1) was 14.44%.
Deposits
Deposits of ₹1,777,240 crore at 30 Sep 2026 fund most of its lending. Fixed (term) deposits were ₹1,085,895 crore of the money held in India.
Borrowings
Bank-only borrowings were ₹82,314 crore at 31 Mar 2026, against ₹83,777 crore a year earlier.
Branches, ATMs and agents
10,481 branches in India, 10,915 ATMs and 32,276 business correspondents (local agents who offer basic banking) at 30 Sep 2026. Of the branches, 38.0% were rural and 25.2% semi-urban.
People
103,184 permanent employees at 31 Mar 2026, the BRSR report says. Management said the next wage revision is due from 1 Nov 2027.
Sources (6)
- Analyst presentation Q2 FY27 (quarter ended 30 Sep 2026)
- Press release: results for the quarter ended 30 Sep 2026
- XBRL financial results Q4 FY26 and FY26 (audited), standalone
- XBRL financial results Q4 FY25 and FY25 (audited), standalone
- Business Responsibility and Sustainability Report FY26
- Earnings call transcript Q4 FY26 (call 5 May 2026)
15Where growth could come from
15Where growth could come from
Where could PNB's growth come from?
The bank's FY27 guidance, in its Q2 FY27 presentation (16 Oct 2026), includes 12%–13% credit growth, 9%–10% deposit growth, a 2.60%–2.70% NIM and ROA above 1%. On the 16 Oct 2026 call, management said it was "very comfortable to get into the guidance of 2.6 to 2.7" on NIM.
Loan growth against the bank's guidance
WorkingGlobal gross advances +14.7% in the year to 30 Sep 2026, to ₹1,341,194 crore
The bank's FY27 guidance is 12%–13% credit growth. Deposits grew 9.9% over the same year, against 9%–10% guidance.
Status: Working, on track against what the company said.
Margin back into the guided range
BehindGlobal NIM 2.58% in Q2 FY27, up from 2.50% in Q1 FY27; 2.54% for H1 FY27
FY27 guidance is 2.60%–2.70%. Management said on 16 Oct 2026 it expects the margin's "positive trajectory to strengthen further in the coming quarters".
Status: Behind, behind the company's own plan.
Small-business and farm lending
WorkingMSME loans +19.8% and agriculture loans +14.4% in the year to 30 Sep 2026
Retail, agriculture and MSME loans together were 57.4% of domestic loans at 30 Sep 2026, against 56.8% a year earlier, the bank says.
Status: Working, on track against what the company said.
Overseas lending and foreign-currency bonds
NewOverseas advances ₹84,110 crore at 30 Sep 2026, up 62.7% in a year
PNB set up a Euro Medium Term Note (foreign-currency bond) programme on 16 Sep 2026, through its GIFT City banking unit. Moody's rated it Baa3 and Fitch BBB-.
Status: New, recently announced.
Low-cost deposits to 38%
BehindDomestic CASA share 36.6% at 30 Sep 2026, against 37.3% a year earlier
The FY27 guidance is a 38% CASA share. Savings deposits in India were ₹542,893 crore and current deposits ₹83,053 crore.
Status: Behind, behind the company's own plan.
Status compares progress with what the company itself said it would do: Working = on track against what the company said; Mixed = partly on track; Behind = behind the company's own plan; New = recently announced; Early = too early to judge.
Sources (6)
- Analyst presentation Q2 FY27 (quarter ended 30 Sep 2026)
- Earnings call transcript Q2 FY27 (call 16 Oct 2026)
- Board approves Medium-Term Note programme up to USD 1.5 billion through PNB IFSC Banking Unit, GIFT City
- Euro Medium Term Note programme of USD 1.50 billion established
- Ratings assigned to the MTN programme by Moody’s (Baa3), Fitch (BBB-) and CareEdge
- Press release: results for the quarter ended 30 Sep 2026
16Financial strength: capital, bad loans, deposits
16Financial strength · FY26
How strong is PNB's balance sheet?
- Loans given (advances)₹12.25 lakh cr
- Deposits taken₹17.11 lakh cr
Loans were 72% of deposits (credit–deposit ratio) at the end of FY26.
- Capital adequacy (CRAR)
- 17.74%
- capital as a share of risk-weighted loans; regulators set a minimum
- Core equity (CET1)
- 13.62%
- the highest-quality part of that capital
- Gross NPA
- 2.95%
- loans not being repaid, as % of all loans
- Net NPA
- 0.29%
- the same, after money already set aside
- Provision cover
- 97.14%
- share of bad loans already provided for
- CASA ratio
- 37.0%
- deposits in current and savings accounts, which usually pay low interest
- Cost to income
- 51.79%
- ₹ of running costs per ₹100 of income after interest paid
- Return on assets
- 0.89%
- profit as % of everything the lender owns
- Return on equity
- 15.67%
- profit as % of shareholders' money
Figures as on FY26 year end (standalone, as banks report these ratios). Reported by the company; see the dates on each source.
17Who owns it
17Who owns it · Q2 FY27
Who owns PNB?
- Promoters (founders or parent company)70.1%
- Foreign institutions (FII)6.7%
- Indian institutions (DII)16.1%
- Public and others7.1%
Promoter pledge
No promoter shares were pledged in Q2 FY27.
How ownership changed
* Pledged = share of the promoters' own holding reported as pledged. In older filings this can include shares “otherwise encumbered”; the governance flags say when.
Sources (12)
- Shareholding pattern (XBRL), 31 Dec 2023
- Shareholding pattern (XBRL), 31 Mar 2024
- Shareholding pattern (XBRL), 30 Jun 2024
- Shareholding pattern (XBRL), 30 Sep 2024
- Shareholding pattern (XBRL), 31 Dec 2024
- Shareholding pattern (XBRL), 31 Mar 2025
- Shareholding pattern (XBRL), 30 Jun 2025
- Shareholding pattern (XBRL), 30 Sep 2025
- Shareholding pattern (XBRL), 31 Dec 2025
- Shareholding pattern (XBRL), 31 Mar 2026
- Shareholding pattern (XBRL), 30 Jun 2026
- Shareholding pattern (XBRL), 30 Sep 2026
18What it does with profit
18What it does with profit
What does PNB do with its profit?
Dividend per share
₹3.00FY26
Dividend paid for each share, by financial year.
₹ per share
See the numbers
No buybacks or fund raises in the period covered.
19Governance signals
19Governance signals
What do PNB's governance filings show?
- Auditor
- Ummed Jain & Co., N K Bhargava & Co., Prem Gupta & Co. and P A & Associates (statutory central auditors, FY26)
- Auditor changes
- 25 Mar 2026: Five statutory central auditors, including P S D & Associates → Ummed Jain & Co., N K Bhargava & Co., Prem Gupta & Co. and P A & Associates (Under an RBI letter of 25 Mar 2026, P S D & Associates ceased to be part of the auditor team with immediate effect; the filing gives no other reason.)
- Audit qualifications
- None reported
- Related-party dealings
- PNB's main related parties are its subsidiaries and associates. At 30 Sep 2026 it held 74.07% of PNB Gilts and 51% of Druk PNB Bank. It owned PNB Cards & Services, PNB Investment Services and PNB (International) in London outright. Associates include PNB Housing Finance (28.01%), PNB MetLife India Insurance (30%), Everest Bank in Nepal (20.02%) and 35% of each of 8 regional rural banks. The half-yearly related-party filings were not reviewed for this page.
- Credit rating
- ICRA AAA (infrastructure bonds and fixed deposits) (outlook Stable), 5 Dec 2025
A credit rating describes the company's ability to repay debt. It is not a rating of the share.
Flags to know about
regulatory · 1 Oct 2026
SEBI warning letter on insider-trading rules
On 1 Oct 2026 PNB disclosed an administrative warning letter (dated 30 Sep 2026) from SEBI's Investigations Department under SEBI's insider-trading regulations. The bank's cover letter says it concerns "three Designated Persons and their immediate relatives (total six individuals)" trading in its shares from 24 Jun 2024 to 6 Aug 2024, and beyond where deemed necessary. Its Annexure I says "six Designated Persons and their immediate relatives". The bank said the letter is cautionary and imposes no financial penalty on the bank.
regulatory · 10 Nov 2026
RBI penalty on currency chest operations
RBI imposed a monetary penalty of ₹124,913.01 on 10 Nov 2026 for "non-compliance with operational guidelines of Currency Chests" under its master directions, the bank disclosed. The bank put the impact at the amount of the penalty only.
other · 26 Dec 2025
Borrowal fraud reported on two SREI companies
On 26 Dec 2025 PNB said it had reported borrowal fraud to RBI against the erstwhile promoters of SREI Equipment Finance (₹1,240.94 crore) and SREI Infrastructure Finance (₹1,193.06 crore). Provisions made were 100% of the entire outstanding amount in each account, the bank said. Both companies were resolved under insolvency proceedings (CIRP) by the NCLT.
other · 30 Sep 2026
Government of India is the promoter
The President of India held 70.08% of shares at 30 Sep 2026, none pledged. The stake was 73.15% until a share sale to institutions (QIP) in Jul–Sep 2024. The MD & CEO took office under a government notification, and the government nominated a part-time director on 9 Oct 2026.
other · 31 Mar 2026
Chairman post vacant
The Non-Executive Chairman post was vacant at 31 Mar 2026, after K G Ananthakrishnan's tenure ended in Nov 2025, the FY26 annual report says.
Sources (12)
- RBI letter: P S D & Associates ceases to be a statutory central auditor; four firms continue for FY26
- Annual Report FY26 (2025-26), incl. standalone and consolidated financial statements
- Analyst presentation Q2 FY27 (quarter ended 30 Sep 2026)
- Government notification amalgamating regional rural banks into one RRB per state (PNB-sponsored RRBs)
- ICRA rationale: Punjab National Bank, ratings reaffirmed, two redeemed bonds withdrawn (5 Dec 2025), as filed with the exchange
- SEBI administrative warning letter on insider-trading violations by three designated persons and relatives; no financial penalty
- RBI monetary penalty of Rs 1,24,913.01 (currency chest operational guidelines)
- Borrowal fraud reported to RBI against erstwhile promoters of SREI Equipment Finance and SREI Infrastructure Finance (100% provided)
- Shareholding pattern (XBRL), 30 Sep 2026
- Shareholding pattern (XBRL), 30 Sep 2024
- Ashok Chandra assumes office as MD & CEO from 16 Jan 2025
- Government nominates Sushil Katara as part-time non-official director (9 Oct 2026)
20What the market paid
20What the market paid · price as of 11 Nov 2026
What did the market pay for PNB on 11 Nov 2026?
Price as of 11 Nov 2026 (shown for education; prices change daily).
Price as of 11 Nov 2026: ₹138.48, the NSE closing price. Market value: ₹159,154 crore, a Cityfort calculation from that price and the 11,492,943,268 shares in the 30 Sep 2026 shareholding pattern. P/E is market value divided by one year's profit: here group profit of ₹22,861 crore for Q3 FY26 to Q2 FY27 (Cityfort calculation from the four quarterly results), giving 7.0. P/B divides the price by book value (shareholders' money) per share: bank-only ₹123.64 at 30 Sep 2026, giving 1.12. The FY26 dividend of ₹3 a share is 2.2% of that price (Cityfort calculation). EV/EBITDA is not shown, because interest is a bank's main running cost.
- Share price
- ₹138.48
- Market value (market cap)
- ₹159,154 cr
- P/E
- 7×
- P/B
- 1.1×
Source: NSE capital-market bhavcopy, 11 Nov 2026; Shareholding pattern (XBRL), 30 Sep 2026; XBRL financial results Q3 FY26, consolidated and 5 more
Sources (8)
- NSE capital-market bhavcopy, 11 Nov 2026
- Shareholding pattern (XBRL), 30 Sep 2026
- XBRL financial results Q3 FY26, consolidated
- XBRL financial results Q4 FY26 and FY26 (audited), consolidated
- XBRL financial results Q1 FY27, consolidated
- XBRL financial results Q2 FY27, consolidated
- Analyst presentation Q2 FY27 (quarter ended 30 Sep 2026)
- Outcome of board meeting 5 May 2026: FY26 audited results, dividend Rs 3 per share recommended
21How it got here
21How it got here
How did PNB get here?
1895
Milestone
Founded
Punjab National Bank was set up in 1895.
1970
Business-model change
Nationalised
The government took over the bank in 1970 under the Banking Companies (Acquisition and Transfer of Undertakings) Act.
2018
Milestone
Government capital
In FY18–FY20 the government put ₹55,274 crore of capital into PNB and the banks that later merged into it, ICRA says.
2020
Business-model change
Two banks merged in
Oriental Bank of Commerce and United Bank of India merged into PNB on 1 Apr 2020.
2022
Crisis
Bad loans at 11.78%
Gross NPA was 11.78% of loans at 31 Mar 2022. FY22 provisions were ₹16,445 crore, against ₹3,457 crore of bank-only profit.
2024
Milestone
₹5,000 crore share sale
A share sale to institutions (QIP) raised ₹5,000 crore in Jul–Sep 2024. The government's stake fell from 73.15% to 70.08%.
2025
Milestone
New MD & CEO
Ashok Chandra became MD & CEO on 16 Jan 2025.
2025
Milestone
One-time tax charge
Moving to the new income-tax regime added ₹3,324.24 crore of tax in Apr–Jun 2025. Bank-only profit that quarter was ₹1,675 crore.
2025
Milestone
Canara HSBC Life stake cut
PNB sold shares in Canara HSBC Life Insurance's IPO for ₹1,007 crore, cutting its stake from 23% to 13%. It stopped being an associate on 17 Oct 2025.
2026
Milestone
Foreign-currency bond programme
PNB set up a Euro Medium Term Note (foreign-currency bond) programme on 16 Sep 2026. Moody's rated it Baa3 and Fitch BBB-.
Sources (13)
- Business Responsibility and Sustainability Report FY26
- ICRA rationale: Punjab National Bank, ratings reaffirmed, two redeemed bonds withdrawn (5 Dec 2025), as filed with the exchange
- Annual Report FY22 (2021-22) (zip on NSE)
- Annual Report FY25 (2024-25)
- XBRL financial results Q4 FY22 and FY22 (audited), standalone
- Shareholding pattern (XBRL), 30 Sep 2024
- Ashok Chandra assumes office as MD & CEO from 16 Jan 2025
- Annual Report FY26 (2025-26), incl. standalone and consolidated financial statements
- XBRL financial results Q1 FY26, standalone
- Stake in Canara HSBC Life Insurance cut from 23% to 13% through the IPO offer for sale (Rs 1,007 crore)
- Reviewed financial results Q2 FY27 / H1 FY27 with notes (outcome of board meeting, PDF)
- Euro Medium Term Note programme of USD 1.50 billion established
- Ratings assigned to the MTN programme by Moody’s (Baa3), Fitch (BBB-) and CareEdge
22Sources and changes
Where every number on this page comes from
Sources (63 documents)
- S1Annual Report FY26 (2025-26), incl. standalone and consolidated financial statements · NSE (company filing, nsearchives.nseindia.com) · Tier 1: company or exchange filing · 27 May 2026
- S2Annual Report FY25 (2024-25) · NSE (company filing, nsearchives.nseindia.com) · Tier 1: company or exchange filing · 11 Jul 2025
- S3Annual Report FY24 (2023-24) · NSE (company filing, nsearchives.nseindia.com) · Tier 1: company or exchange filing · 6 Jun 2024
- S4Annual Report FY23 (2022-23) (zip on NSE) · NSE (company filing, nsearchives.nseindia.com) · Tier 1: company or exchange filing · 8 Jun 2023
- S5Annual Report FY22 (2021-22) (zip on NSE) · NSE (company filing, nsearchives.nseindia.com) · Tier 1: company or exchange filing · 7 Jun 2022
- S6Analyst presentation Q2 FY27 (quarter ended 30 Sep 2026) · NSE (company filing, nsearchives.nseindia.com) · Tier 1: company or exchange filing · 16 Oct 2026
- S7Analyst presentation Q1 FY27 (quarter ended 30 Jun 2026) · NSE (company filing, nsearchives.nseindia.com) · Tier 1: company or exchange filing · 18 Jul 2026
- S8Analyst presentation Q4 FY26 and FY26 · NSE (company filing, nsearchives.nseindia.com) · Tier 1: company or exchange filing · 5 May 2026
- S9Analyst presentation Q3 FY26 (revised filing) · NSE (company filing, nsearchives.nseindia.com) · Tier 1: company or exchange filing · 19 Jan 2026
- S10Press release: results for the quarter ended 30 Sep 2026 · NSE (company filing, nsearchives.nseindia.com) · Tier 1: company or exchange filing · 16 Oct 2026
- S11Reviewed financial results Q2 FY27 / H1 FY27 with notes (outcome of board meeting, PDF) · NSE (company filing, nsearchives.nseindia.com) · Tier 1: company or exchange filing · 16 Oct 2026
- S12Earnings call transcript Q2 FY27 (call 16 Oct 2026) · NSE (company filing, nsearchives.nseindia.com) · Tier 1: company or exchange filing · 23 Oct 2026
- S14Earnings call transcript Q4 FY26 (call 5 May 2026) · NSE (company filing, nsearchives.nseindia.com) · Tier 1: company or exchange filing · 12 May 2026
- S15Earnings call transcript Q3 FY26 (call 19 Jan 2026) · NSE (company filing, nsearchives.nseindia.com) · Tier 1: company or exchange filing · 27 Jan 2026
- S16ICRA rationale: Punjab National Bank, ratings reaffirmed, two redeemed bonds withdrawn (5 Dec 2025), as filed with the exchange · ICRA Limited (via NSE filing) · Tier 2: rating agency or regulator · 5 Dec 2025
- S17Business Responsibility and Sustainability Report FY26 · NSE (company filing, nsearchives.nseindia.com) · Tier 1: company or exchange filing · 27 May 2026
- S18XBRL financial results Q2 FY27, standalone · NSE (company filing, nsearchives.nseindia.com) · Tier 1: company or exchange filing · 16 Oct 2026
- S19XBRL financial results Q2 FY27, consolidated · NSE (company filing, nsearchives.nseindia.com) · Tier 1: company or exchange filing · 16 Oct 2026
- S20XBRL financial results Q1 FY27, standalone · NSE (company filing, nsearchives.nseindia.com) · Tier 1: company or exchange filing · 18 Jul 2026
- S21XBRL financial results Q1 FY27, consolidated · NSE (company filing, nsearchives.nseindia.com) · Tier 1: company or exchange filing · 18 Jul 2026
- S22XBRL financial results Q4 FY26 and FY26 (audited), standalone · NSE (company filing, nsearchives.nseindia.com) · Tier 1: company or exchange filing · 5 May 2026
- S23XBRL financial results Q4 FY26 and FY26 (audited), consolidated · NSE (company filing, nsearchives.nseindia.com) · Tier 1: company or exchange filing · 5 May 2026
- S24XBRL financial results Q3 FY26, standalone · NSE (company filing, nsearchives.nseindia.com) · Tier 1: company or exchange filing · 19 Jan 2026
- S25XBRL financial results Q3 FY26, consolidated · NSE (company filing, nsearchives.nseindia.com) · Tier 1: company or exchange filing · 19 Jan 2026
- S26XBRL financial results Q2 FY26 (revised filing), standalone · NSE (company filing, nsearchives.nseindia.com) · Tier 1: company or exchange filing · 24 Oct 2025
- S27XBRL financial results Q2 FY26 (revised filing), consolidated · NSE (company filing, nsearchives.nseindia.com) · Tier 1: company or exchange filing · 24 Oct 2025
- S28XBRL financial results Q1 FY26, standalone · NSE (company filing, nsearchives.nseindia.com) · Tier 1: company or exchange filing · 30 Jul 2025
- S29XBRL financial results Q1 FY26, consolidated · NSE (company filing, nsearchives.nseindia.com) · Tier 1: company or exchange filing · 30 Jul 2025
- S30XBRL financial results Q4 FY25 and FY25 (audited), standalone · NSE (company filing, nsearchives.nseindia.com) · Tier 1: company or exchange filing · 7 May 2025
- S31XBRL financial results Q4 FY25 and FY25 (audited), consolidated · NSE (company filing, nsearchives.nseindia.com) · Tier 1: company or exchange filing · 7 May 2025
- S32XBRL financial results Q3 FY25, standalone · NSE (company filing, nsearchives.nseindia.com) · Tier 1: company or exchange filing · 31 Jan 2025
- S33XBRL financial results Q3 FY25, consolidated · NSE (company filing, nsearchives.nseindia.com) · Tier 1: company or exchange filing · 31 Jan 2025
- S34XBRL financial results Q4 FY24 and FY24 (audited), standalone (refiled 3 Sep 2024, same values) · NSE (company filing, nsearchives.nseindia.com) · Tier 1: company or exchange filing · 3 Sep 2024
- S35XBRL financial results Q4 FY24 and FY24 (audited), consolidated · NSE (company filing, nsearchives.nseindia.com) · Tier 1: company or exchange filing · 10 May 2024
- S36XBRL financial results Q4 FY23 and FY23 (audited), standalone · NSE (company filing, nsearchives.nseindia.com) · Tier 1: company or exchange filing · 20 May 2023
- S37XBRL financial results Q4 FY23 and FY23 (audited), consolidated · NSE (company filing, nsearchives.nseindia.com) · Tier 1: company or exchange filing · 20 May 2023
- S38XBRL financial results Q4 FY22 and FY22 (audited), standalone · NSE (company filing, nsearchives.nseindia.com) · Tier 1: company or exchange filing · 12 May 2022
- S39XBRL financial results Q4 FY22 and FY22 (audited), consolidated · NSE (company filing, nsearchives.nseindia.com) · Tier 1: company or exchange filing · 12 May 2022
- S42Shareholding pattern (XBRL), 30 Sep 2026 · NSE (company filing, nsearchives.nseindia.com) · Tier 1: company or exchange filing · 15 Oct 2026
- S43Shareholding pattern (XBRL), 30 Jun 2026 · NSE (company filing, nsearchives.nseindia.com) · Tier 1: company or exchange filing · 18 Jul 2026
- S44Shareholding pattern (XBRL), 31 Mar 2026 · NSE (company filing, nsearchives.nseindia.com) · Tier 1: company or exchange filing · 17 Apr 2026
- S45Shareholding pattern (XBRL), 31 Dec 2025 · NSE (company filing, nsearchives.nseindia.com) · Tier 1: company or exchange filing · 16 Jan 2026
- S46Shareholding pattern (XBRL), 30 Sep 2025 · NSE (company filing, nsearchives.nseindia.com) · Tier 1: company or exchange filing · 16 Oct 2025
- S47Shareholding pattern (XBRL), 30 Jun 2025 · NSE (company filing, nsearchives.nseindia.com) · Tier 1: company or exchange filing · 14 Jul 2025
- S48Shareholding pattern (XBRL), 31 Mar 2025 · NSE (company filing, nsearchives.nseindia.com) · Tier 1: company or exchange filing · 8 Apr 2025
- S49Shareholding pattern (XBRL), 31 Dec 2024 · NSE (company filing, nsearchives.nseindia.com) · Tier 1: company or exchange filing · 8 Jan 2025
- S50Shareholding pattern (XBRL), 30 Sep 2024 · NSE (company filing, nsearchives.nseindia.com) · Tier 1: company or exchange filing · 8 Oct 2024
- S51Shareholding pattern (XBRL), 30 Jun 2024 · NSE (company filing, nsearchives.nseindia.com) · Tier 1: company or exchange filing · 9 Jul 2024
- S52Shareholding pattern (XBRL), 31 Mar 2024 · NSE (company filing, nsearchives.nseindia.com) · Tier 1: company or exchange filing · 12 Apr 2024
- S53Shareholding pattern (XBRL), 31 Dec 2023 · NSE (company filing, nsearchives.nseindia.com) · Tier 1: company or exchange filing · 8 Jan 2024
- S54NSE capital-market bhavcopy, 11 Nov 2026 · NSE (nsearchives.nseindia.com) · Tier 1: company or exchange filing · 11 Nov 2026
- S55Outcome of board meeting 5 May 2026: FY26 audited results, dividend Rs 3 per share recommended · NSE (company filing, nsearchives.nseindia.com) · Tier 1: company or exchange filing · 5 May 2026
- S57Board approves Medium-Term Note programme up to USD 1.5 billion through PNB IFSC Banking Unit, GIFT City · NSE (company filing, nsearchives.nseindia.com) · Tier 1: company or exchange filing · 29 Jul 2026
- S58Euro Medium Term Note programme of USD 1.50 billion established · NSE (company filing, nsearchives.nseindia.com) · Tier 1: company or exchange filing · 16 Sep 2026
- S59Ratings assigned to the MTN programme by Moody’s (Baa3), Fitch (BBB-) and CareEdge · NSE (company filing, nsearchives.nseindia.com) · Tier 1: company or exchange filing · 18 Sep 2026
- S60SEBI administrative warning letter on insider-trading violations by three designated persons and relatives; no financial penalty · NSE (company filing, nsearchives.nseindia.com) · Tier 1: company or exchange filing · 1 Oct 2026
- S61RBI monetary penalty of Rs 1,24,913.01 (currency chest operational guidelines) · NSE (company filing, nsearchives.nseindia.com) · Tier 1: company or exchange filing · 10 Nov 2026
- S62Stake in Canara HSBC Life Insurance cut from 23% to 13% through the IPO offer for sale (Rs 1,007 crore) · NSE (company filing, nsearchives.nseindia.com) · Tier 1: company or exchange filing · 22 Oct 2025
- S63Borrowal fraud reported to RBI against erstwhile promoters of SREI Equipment Finance and SREI Infrastructure Finance (100% provided) · NSE (company filing, nsearchives.nseindia.com) · Tier 1: company or exchange filing · 26 Dec 2025
- S64Government notification amalgamating regional rural banks into one RRB per state (PNB-sponsored RRBs) · NSE (company filing, nsearchives.nseindia.com) · Tier 1: company or exchange filing · 8 Apr 2025
- S65Ashok Chandra assumes office as MD & CEO from 16 Jan 2025 · NSE (company filing, nsearchives.nseindia.com) · Tier 1: company or exchange filing · 16 Jan 2025
- S66RBI letter: P S D & Associates ceases to be a statutory central auditor; four firms continue for FY26 · NSE (company filing, nsearchives.nseindia.com) · Tier 1: company or exchange filing · 25 Mar 2026
- S67Government nominates Sushil Katara as part-time non-official director (9 Oct 2026) · NSE (company filing, nsearchives.nseindia.com) · Tier 1: company or exchange filing · 9 Oct 2026
Changes to this page (v1 · 12 Nov 2026)
- v1 · 12 Nov 2026First version. (first version)
Numbers come only from tier 1 and tier 2 sources. Read how we research.
Disclaimer
For learning only. Cityfort is not a SEBI-registered adviser and does not recommend buying or selling any security. Prices shown are dated and may be out of date.
Investing in securities involves risk, including loss of capital. Before making any investment decision, do your own research and consider consulting a SEBI-registered investment adviser.
Cityfort, its owners and contributors may or may not hold securities of companies covered. Content is not an offer or solicitation to buy or sell any security.
Read the full disclaimerHide the full disclaimer
Cityfort publishes educational content that explains how listed companies work. Cityfort is not registered with the Securities and Exchange Board of India (SEBI) as an Investment Adviser or Research Analyst and does not provide investment advice, recommendations, ratings, price targets or any opinion on whether to buy, sell or hold any security.
All information is taken from publicly available sources, mainly company filings on BSE and NSE, which are listed on each page with dates. We work to keep it accurate and correct errors publicly, but we do not guarantee that it is complete, accurate or up to date. Any market price or price-based ratio shown is dated, may be out of date by the time you read it, and is included only to explain concepts.
Statements by company management are reported as statements, with their date and source; they are not our forecasts.