Financial Services · NSE: SBILIFE · BSE: 540719
SBI Life: how the business works
SBI Life sells life insurance, savings and pension policies through State Bank of India branches and its own agents, collecting ₹101,286 crore of gross premiums in FY26.
Follow SBI Life
Email me when SBI Life's page is updated after results.
We store your email address with Kit, our email provider, which also records when you sign up and whether you open or click our emails. We send a confirmation email first. See our privacy policy.
SBI Life Insurance Company Limited · Mumbai, Maharashtra · Founded 2000
Updated for Q2 FY27 · checked
- Net premium income, FY26
- ₹99,956 cr
- Net profit, FY26
- ₹2,470 cr
- Share of private insurers' individual premium (IRP), FY26
- 22.9%
- Incorporated
- 2000
- State Bank of India (promoter) holding, Sep 2026
- 55.31%
The short version
SBI Life in 5 points
1 · What it sells
SBI Life sells life insurance, savings, pension and annuity policies in India, and it collected ₹101,286 crore of gross premiums in FY26.
2 · Who pays it
In FY26, renewal premiums on policies sold in earlier years were 58.0% of SBI Life's gross premium, first-year premiums on new regular-premium policies 21.6%, and one-time single premiums 20.4%.
3 · What it keeps from ₹100
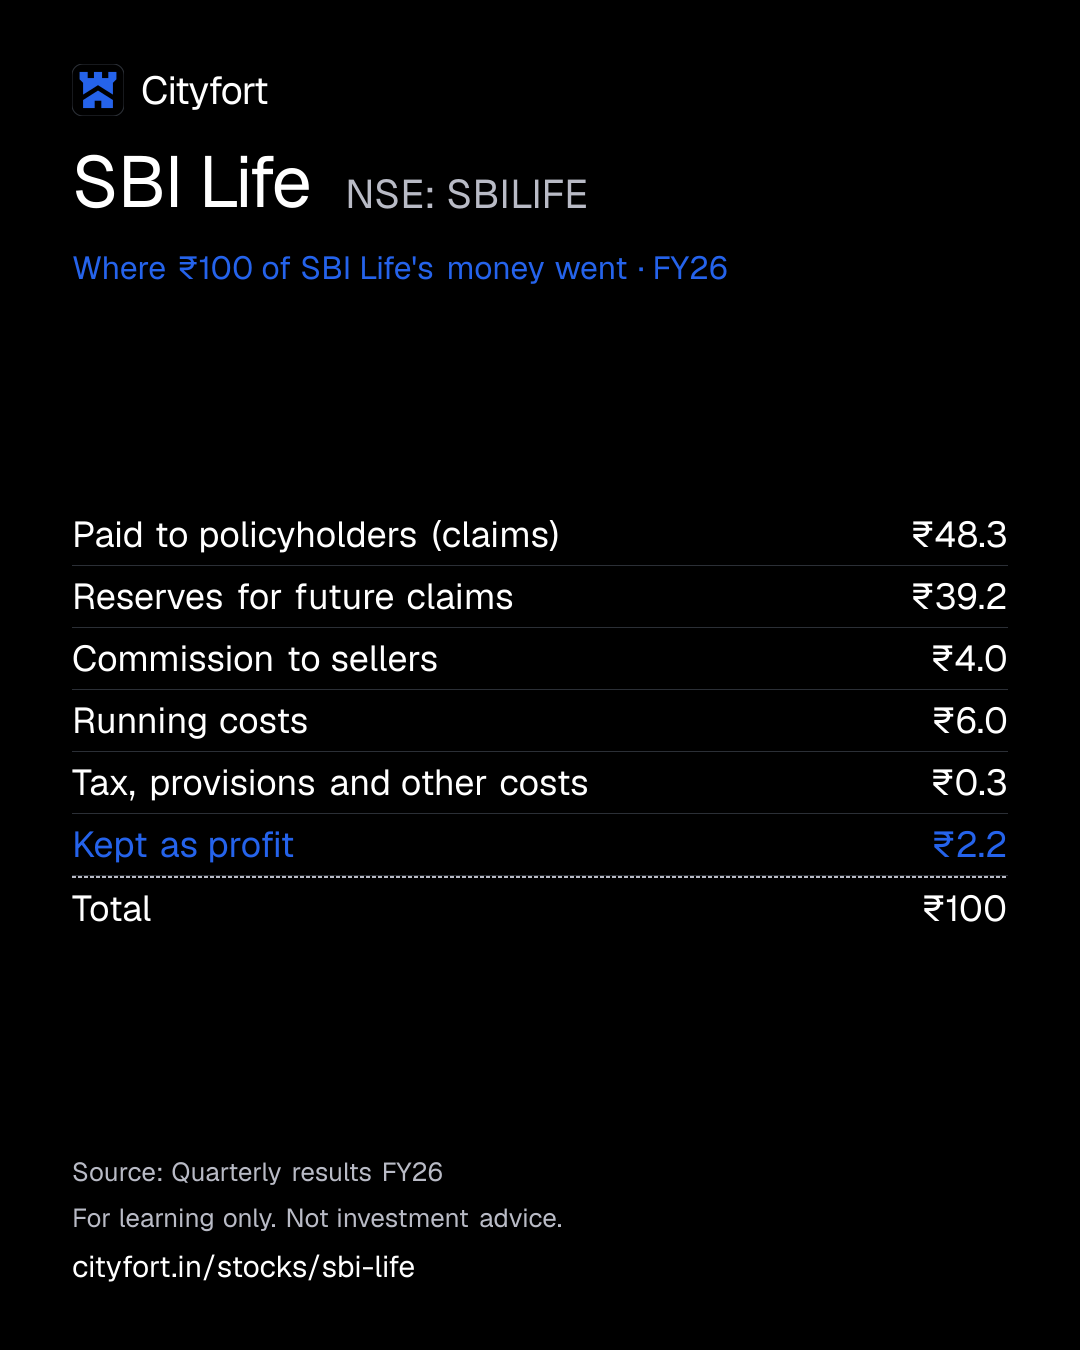
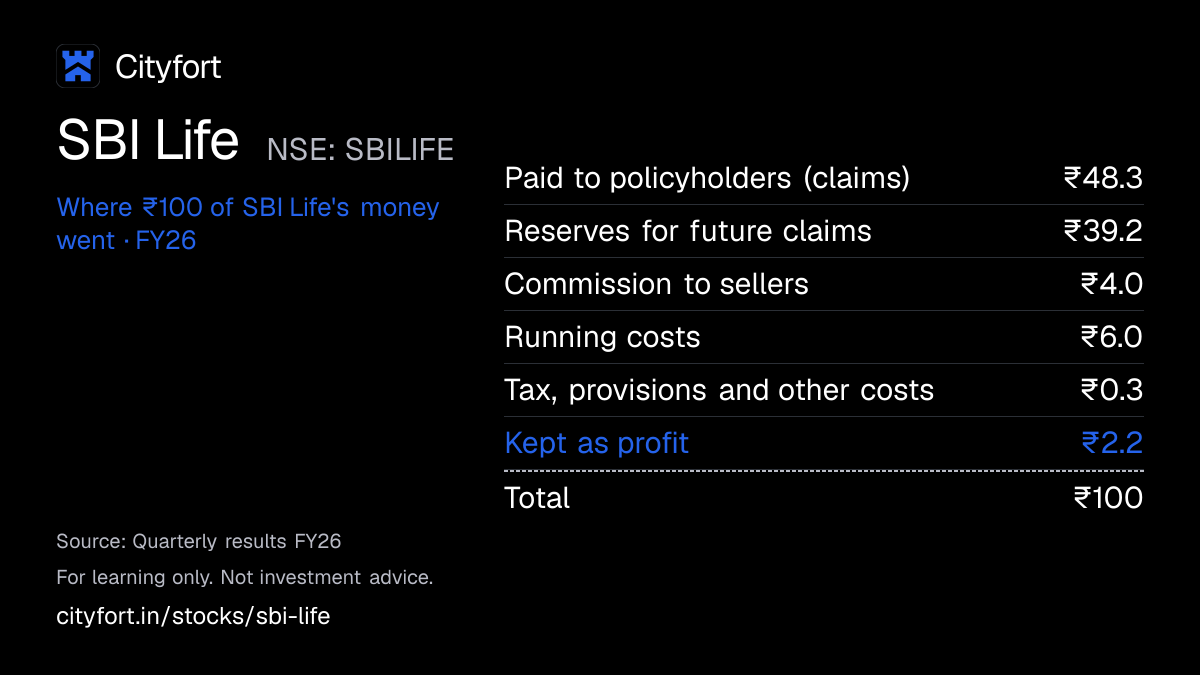
Of every ₹100 that came in during FY26, SBI Life kept ₹2.2 as profit after ₹88 went to policyholders' claims and reserves, and management said in the 22 Apr 2026 earnings call that FY26 profit of ₹2,470 crore would have been ₹3,120 crore without GST and revised labour-law effects.
4 · Where the operating profit comes from
SBI Life earns its profit over the life of each policy, and it valued the expected lifetime profit on its FY26 new business at ₹6,667 crore, a 27.5% margin on ₹24,270 crore of new annual premium (APE).
5 · The one thing to watch
SBI Life's bank channel (SBI and regional rural banks) brought 53% of its new annual premium (APE) in H1 FY27, against 57% a year earlier.
Sources: From SBI Life's FY26 annual report, its FY26 audited results, its FY26 and H1 FY27 investor presentations and its FY26 earnings call · checked
Sources (5)
01Where the money goes · FY26
Where does ₹100 of SBI Life's money go?
SBI Life · FY26
Receipt for every ₹100
| Paid to policyholders (claims) | ₹48.3 |
|---|---|
| Reserves for future claims | ₹39.2 |
| Commission to sellers | ₹4.0 |
| Running costs | ₹6.0 |
| Tax, provisions and other costs | ₹0.3 |
| Kept as profit | ₹2.2 |
| Total | ₹100 |
Each line = amount ÷ total money in × 100. Lines may not add to exactly ₹100 because of rounding.
How this is worked out
Cityfort calculation from the FY26 audited results filing: each line ÷ total money in (net premiums + investment income + other income, ₹112,389 crore) × 100. Reserves include funds kept for future bonuses; money moved between the policyholders' and shareholders' accounts is left out because it stays inside the company.
Save this receipt as an image
Embed this receipt or the key numbers
Paste this code into a blog or website to show the card you choose, with a link back to this page.
Each week: the next company due to report results, explained in 5 points.
We'll email you once a week with what changed on Cityfort. Facts only, no tips. Unsubscribe any time.
We store your email address with Kit, our email provider, which also records when you sign up and whether you open or click our emails. We send a confirmation email first. See our privacy policy.
02The business in one line
What does SBI Life do?
People and employers pay SBI Life premiums; in FY26, ₹88 of every ₹100 that came in went to policyholders' claims and reserves, and ₹2.2 was profit.
- SBI Life invests premiums until claims fall due. In FY26 that brought ₹11,062 crore of investment income on policyholders' funds, on top of ₹99,956 crore of net premiums.
- State Bank of India owned 55.31% of SBI Life at 30 Sep 2026. Bank branches brought 49.9% of SBI Life's FY26 new business premium.
03Who pays it
Who pays SBI Life?
Policyholders renewing their policies
58%
of revenue
Yearly premiums on policies sold in earlier years: ₹58,735 crore in FY26.
New buyers of regular-premium policies
21.6%
of revenue
The first year's premium on policies that are paid for every year: ₹21,841 crore in FY26.
Single-premium buyers
20.4%
of revenue
One-time lump-sum premiums, paid when the policy starts: ₹20,710 crore in FY26.
Borrowers and companies SBI Life invests in
Share of revenue not disclosed
Interest, dividends and gains on invested premiums: ₹11,062 crore for policyholders' funds in FY26, on top of premium income.
- Policyholders renewing their policies58%
- New buyers of regular-premium policies21.6%
- Single-premium buyers20.4%
How spread out the customers are
SBI Life does not disclose premium by distributor name. Bank branches of SBI and regional rural banks brought 49.9% of FY26 new business premium, and SBI received 52.9% of FY26 commission (Cityfort calculation from the FY26 annual report: ₹2,376.45 crore of ₹4,495.71 crore).
04How it makes money
How does SBI Life make money?
SBI Life sells long-term policies through a ready-made bank network, invests the premiums, and earns profit slowly over each policy's life.
A policy's profit arrives over many years. Value of new business (VNB) is the company's estimate of that future profit on the year's sales. SBI Life put it at ₹6,667 crore in FY26, a 27.5% margin on ₹24,270 crore of new annual premium (APE).
VNB margin: expected lifetime profit on the year's new policies per ₹100 of new annual premium
25.9%27.5%
FY22 to FY26
- Bank branches and agents sell policies, and buyers pay premiums.
- SBI Life invests the money in government bonds, shares and corporate bonds.
- Policies that stay in force keep paying premiums for years.
- SBI Life pays claims and maturities and sets aside reserves for future ones.
- The surplus left moves to shareholders over the policy's life.
- That becomes profit, dividends and capital for more sales.
↺ Step 6 feeds back into step 1.
05Business segments · FY26
Which businesses make up SBI Life?
Individual savings
52.7%New business premium on unit-linked, non-par and par savings plans for individuals.
Revenue ₹22,420 cr
Group savings
19.9%New business premium on employers' gratuity and pension fund plans.
Revenue ₹8,480 cr
Annuity
16.5%New business premium on plans that pay a regular income for life or a set period.
Revenue ₹7,030 cr
Protection
10.9%New business premium on pure life cover for individuals and groups.
Revenue ₹4,620 cr
How the mix changed
- Individual savings
- Group savings
- Annuity
- Protection
Revenue by segment, FY24 to FY26.
₹ crore
See the numbers
06The numbers · Standalone (no material subsidiaries) · ₹ crore
How has SBI Life done?
Revenue
₹99,956 crFY26
Net premium income rose every year, from ₹58,432 crore in FY22 to ₹99,956 crore in FY26. Revenue here is premiums only; investment income, which swings with markets, is in the money-flow section.
₹ crore
See the numbers
Net profit
₹2,470 crFY26
Net profit rose every year, from ₹1,506 crore in FY22 to ₹2,470 crore in FY26. In the 22 Apr 2026 earnings call, management said FY26 profit would have been ₹3,120 crore without GST and revised labour-law effects.
₹ crore
See the numbers
Net profit for every ₹100 of revenue
₹2.5FY26
EBITDA is not shown, because it does not fit an insurer's accounts. Net profit per ₹100 of net premium stayed between ₹2.35 and ₹2.87 from FY22 to FY26.
Net margin: ₹ of net profit per ₹100 of revenue
See the numbers
Free cash flow is not shown, because an insurer's operating cash flow mostly reflects premiums against claims. SBI Life's was ₹34,523 crore in FY26, against ₹25,547 crore in FY25.
See all yearly numbers
EBITDA = profit before interest, tax and wear-and-tear of assets. Financial year runs April to March (March year end). Net profit is the share belonging to the company's owners.
Sources (14)
- Integrated Annual Report FY26 (2025-26)
- Integrated filing (financials) XBRL Q4 FY25 and FY25
- Integrated filing (financials) XBRL Q4 FY26 and FY26
- Audited financial results Q4 FY26 and FY26
- Audited financial results Q3 FY26 (incl. Q3 FY25 comparatives)
- Integrated filing (financials) XBRL Q1 FY26
- Audited financial results Q1 FY26
- Integrated filing (financials) XBRL Q2 FY26
- Audited financial results Q2 FY26
- Integrated filing (financials) XBRL Q3 FY26
- Integrated filing (financials) XBRL Q1 FY27
- Unaudited financial results Q1 FY27
- Integrated filing (financials) XBRL Q2 FY27
- Unaudited financial results Q2 FY27 (quarter and half year ended 30 Sep 2026)
07Who runs it
Who runs SBI Life, and did they deliver?
Amit Jhingran
Managing Director & CEO
Re-appointed on 24 Jul 2025 for 1 Oct 2025 to 31 Jan 2027. Crisil describes the MD & CEO as deputed from SBI.
Challa Sreenivasulu Setty
Chairman (non-executive, SBI nominee director)
Sangramjit Sarangi
President & Chief Financial Officer
Ramesh Venkateshamurthy
Deputy CEO · since 2026
Appointed on 29 May 2026, after Deputy CEO Dorababu Daparti was relieved on 18 May 2026.
What they said, and what happened
1 delivered · 2 too early to tell
Said on 28 Jan 2026
Grow FY26 new annual premium (APE) by about 13% to 14%, and keep the VNB margin between 26% and 28%.
DeliveredWhat happened
FY26 APE rose to ₹24,270 crore from ₹21,420 crore in FY25, and the FY26 VNB margin was 27.5%.
Said on 22 Apr 2026
Keep the VNB margin in the 26% to 28% range; management said its "endeavor is to report the margin above 27%".
Too early to tellWhat happened
The VNB margin was 26.2% in Q1 FY27 and 27.9% for H1 FY27. FY27 ends on 31 Mar 2027.
Said on 24 Jul 2026
Grow individual rated premium (IRP) by around 14% to 15% in FY27.
Too early to tellWhat happened
IRP grew 12% in H1 FY27, to ₹9,720 crore. On 27 Oct 2026 management said it still expects to close FY27 at 14% to 15%.
Sources (12)
- Board outcome 24 Jul 2025: re-appointment of MD & CEO Amit Jhingran (1 Oct 2025 to 31 Jan 2027)
- Crisil Ratings: rating rationale, SBI Life (Crisil AAA/Stable reaffirmed)
- Integrated Annual Report FY26 (2025-26)
- Transcript, Q2 FY27 earnings call (27 Oct 2026)
- Change in management: Deputy CEO Dorababu Daparti relieved (18 May 2026)
- NSE corporate announcements list, SBILIFE (Jun 2024 to Nov 2026)
- Transcript, Q3 FY26 earnings call (28 Jan 2026)
- News release and investor presentation, FY26 (Performance Update 12M FY26)
- Transcript, Q4 FY26 earnings call (22 Apr 2026)
- News release and investor presentation, Q1 FY27
- News release and investor presentation, H1 FY27 (Performance Update 6M FY27)
- Transcript, Q1 FY27 earnings call (24 Jul 2026)
08What could go wrong
What could go wrong for SBI Life?
- Concentration
Dependence on State Bank of India
Bank branches of SBI and regional rural banks brought 49.9% of FY26 new business premium. SBI received 52.9% of FY26 commission (Cityfort calculation from the FY26 annual report).
Watch The bank channel's share of new annual premium (APE): 53% in H1 FY27, against 57% a year earlier.
- Regulation
New rules on distributor pay
IRDAI has issued consultation papers on the economics of insurance distribution. On 27 Oct 2026 management said SBI Life's structure is "broadly aligned with the proposed framework" and it expects limited impact.
Watch IRDAI's final guidelines and the commission ratio (4.8% in H1 FY27, 4.7% a year earlier).
- Other
Results move with stock markets
Unit-linked plans were 34% of H1 FY27 new business premium, and shares were 40% of assets under management at 30 Sep 2026. Investment income on policyholders' funds was negative ₹23,939 crore in Q4 FY26.
Watch Unit-linked share of APE (51% in H1 FY27, 57% a year earlier) and quarterly investment income.
- Demand
Fewer policies lasting five years
Policies still paying premiums in their 61st month (persistency, by premium) fell to 58.12% in FY26 from 63.6% in FY25, both on IRDAI's 2024 method. Surrenders were ₹19,702 crore of FY26 gross benefits.
Watch 61st-month persistency in the results (58.70% for H1 FY27).
- Pricing
Higher costs after the GST change
The opex ratio (running costs ÷ gross premium) rose to 6.9% in H1 FY27 from 6.2% a year earlier. On 27 Oct 2026 management said it would be 5.8% without the GST impact.
Watch Opex ratio and VNB margin in each quarterly presentation (VNB margin 27.9% in H1 FY27).
- Competition
Competition for private-sector share
SBI Life's share of private insurers' individual rated premium was 22.9% in FY26, against 23.4% in FY22. Crisil's May 2025 rating report cites rising competition as a challenge to profitability.
Watch Private market share in each quarterly presentation (22.6% in H1 FY27, 22.2% a year earlier).
- Governance
Leadership change at the top
The MD & CEO's term ends on 31 Jan 2027. Crisil describes the MD & CEO as deputed from SBI.
Watch Any board announcement on the next MD & CEO.
Sources (9)
- Integrated Annual Report FY26 (2025-26)
- Audited financial results Q4 FY26 and FY26
- News release and investor presentation, H1 FY27 (Performance Update 6M FY27)
- Transcript, Q2 FY27 earnings call (27 Oct 2026)
- Integrated filing (financials) XBRL Q4 FY26 and FY26
- Unaudited financial results Q2 FY27 (quarter and half year ended 30 Sep 2026)
- News release and investor presentation, FY26 (Performance Update 12M FY26)
- Crisil Ratings: rating rationale, SBI Life (Crisil AAA/Stable reaffirmed)
- Board outcome 24 Jul 2025: re-appointment of MD & CEO Amit Jhingran (1 Oct 2025 to 31 Jan 2027)
09Supporters and critics
What do supporters and critics point to?
What supporters point to
- Value of new business rose every year, from ₹3,704 crore in FY22 to ₹6,667 crore in FY26; the VNB margin was 27.9% in H1 FY27.
- Embedded value rose from ₹39,625 crore at FY22 to ₹80,791 crore at FY26, and was ₹87,350 crore at 30 Sep 2026.
- SBI Life had no borrowings, and gross bad assets (NPAs) were nil in its policyholders' and shareholders' funds at 30 Sep 2026.
- 13th-month persistency rose to 87.94% in FY26 from 87.4% in FY25, both on IRDAI's 2024 method.
- Individual APE from agents grew 12% in H1 FY27 and from other channels 26%, against 10% through banks.
What critics point to
- SBI received 52.9% of SBI Life's FY26 commission (Cityfort calculation from the FY26 annual report), and SBI and regional rural bank branches brought 49.9% of FY26 new business premium.
- 61st-month persistency fell to 58.12% in FY26 from 63.6% in FY25, both on IRDAI's 2024 method.
- The opex ratio rose to 6.9% in H1 FY27 from 6.2% a year earlier; on 27 Oct 2026 management said it would be 5.8% without the GST impact.
- Crisil's May 2025 rating report cites "challenges in sustaining profitability due to rising competition".
- Return on equity fell to 13.7% in FY26 from 15.1% in FY25.
10What to watch next
What should you watch next at SBI Life?
Next event
Q3 FY27 results (date not announced)
Date not announced yet.
VNB margin
It was 27.9% for H1 FY27. On 27 Oct 2026 management said it will stick to its 26% to 28% guidance.
Individual rated premium growth
IRP grew 12% in H1 FY27. On 27 Oct 2026 management said it expects 14% to 15% for FY27.
IRDAI rules on distributor pay
Final guidelines are awaited. Management said on 27 Oct 2026 that it expects limited impact on SBI Life.
MD & CEO's term
Amit Jhingran's term ends on 31 Jan 2027.
11Key facts
Key facts about SBI Life
- What does SBI Life do?
- SBI Life Insurance Company sells life insurance, savings, pension and annuity policies to individuals and employers in India. SBI Life collected ₹101,286 crore of gross premiums in FY26.
- How does SBI Life make money?
- SBI Life collects premiums, invests them, and keeps a share of what is left after claims, reserves and costs. In FY26 SBI Life earned ₹99,956 crore of net premiums and ₹11,062 crore of investment income on policyholders' funds, and made a net profit of ₹2,470 crore.
- How does SBI Life sell its policies?
- In FY26 bank branches of State Bank of India and regional rural banks brought 49.9% of SBI Life's new business premium, its agents 19.8% and brokers, corporate agents and other channels 30.3%. SBI Life had more than 3,10,000 agents at 30 Sep 2026.
- Who pays SBI Life's premiums?
- In FY26, renewal premiums on policies sold in earlier years were 58.0% of SBI Life's gross premium of ₹101,286 crore, first-year premiums on new regular-premium policies 21.6%, and one-time single premiums 20.4%.
- How big is SBI Life?
- SBI Life's FY26 net premium income was ₹99,956 crore and its net profit was ₹2,470 crore. SBI Life managed assets of ₹487,163 crore at 31 Mar 2026 and ₹527,120 crore at 30 Sep 2026.
- Who owns SBI Life?
- At 30 Sep 2026 State Bank of India owned 55.31% of SBI Life. Foreign investors held 20.68%, Indian institutions 20.07%, and individuals and others 3.94%. None of State Bank of India's SBI Life shares were pledged.
- Does SBI Life have debt?
- SBI Life had no borrowings at 31 Mar 2026. SBI Life's shareholders' money (net worth) was ₹19,080 crore and its solvency ratio was 1.90 on that date, against the insurance regulator IRDAI's minimum of 1.50.
- When was SBI Life set up and listed?
- SBI Life Insurance Company was incorporated on 11 Oct 2000 and registered with the insurance regulator IRDAI on 29 Mar 2001. SBI Life listed on NSE and BSE on 3 Oct 2017.
- What dividend did SBI Life pay for FY26?
- SBI Life declared an interim dividend of ₹2.70 per share for FY26 on 25 Feb 2026, with a record date of 6 Mar 2026. The FY26 dividend totalled ₹270.8 crore.
Terms on this page
- Credit rating
- Dividend payout ratio
- FII and DII holding
- Market capitalisation
- Net debt
- Net profit
- Promoter holding
- Public shareholding
- Revenue from operations
- Segment revenue
Each explains the term in plain English, with the same number from other companies on Cityfort.
Go deeper
More detail from the same filings. Open any section.
12What it sells
12What it sells
What does SBI Life sell?
Unit-linked plans (ULIPs)
Premiums go into market-linked funds the buyer picks, so the payout moves with markets. FY26 new business premium: ₹16,500 crore.
Guaranteed and participating savings plans
Non-participating ("non-par") plans fix benefits at the start; participating ("par") plans share a fund's surplus as bonuses. FY26 new business premium: non-par ₹4,260 crore, par ₹1,670 crore.
Protection (term cover)
Pure life cover for individuals and for groups such as employees or borrowers. FY26 new business premium: ₹4,620 crore, of which group ₹3,650 crore.
Annuities
A lump sum is paid in and SBI Life pays a regular income for life or a set period. FY26 new business premium: ₹7,030 crore.
Group savings plans
Employers buy gratuity and pension fund plans for staff. FY26 new business premium: ₹8,480 crore.
Think of it like this
Like a long-term savings club with a promise attached: members pay in for years, the club invests the money, and it pays out on death or maturity.
What it does
- Does: Sells life cover, savings, pension and annuity policies to individuals and employers.
- Does: Invests policyholders' money: ₹527,120 crore under management at 30 Sep 2026, 36% in government securities and 40% in shares.
- Does: Sells through 27,400+ SBI and regional rural bank branches, 3,10,000+ agents, 159 brokers and 84 corporate agents (30 Sep 2026).
What it does not do
- Does not: Is not a bank, though State Bank of India owns 55.31% of it.
- Does not: Is not a general insurer selling motor or home cover: life insurance was 100% of its FY26 turnover.
- Does not: Does not operate outside India: it works in 28 states and 7 union territories.
13How the money flows
13How the money flows · FY26
How does money flow through SBI Life?
Money in
- Premiums (net of reinsurance)₹99,956 cr
- Investment income on policyholders' funds₹11,062 cr
- Investment income on shareholders' funds₹1,297 cr
- Other income (policyholders' account)₹74 cr
The company
SBI Life
₹112,389 cr came in
Money out
- Paid to policyholders (claims, maturities, surrenders)₹54,323 cr
- Set aside in reserves for future claims₹44,067 cr
- Commission to banks, agents and other sellers₹4,496 cr
- Running costs (staff, offices, GST on charges)₹6,751 cr
- Tax, provisions and other costs₹282 cr
- Net profit₹2,470 cr
- Policyholders paid ₹99,956 crore of premiums in FY26, after reinsurance.
- SBI Life invested the money and earned ₹12,359 crore from its investments.
- It paid ₹54,323 crore to policyholders and set aside ₹44,067 crore for future claims.
- Banks, agents and other sellers got ₹4,496 crore of commission. Running costs were ₹6,751 crore.
- After ₹282 crore of tax, provisions and other costs, ₹2,470 crore was left as profit.
Sources (1)
14What it needs to run
14What it needs to run
What does SBI Life need to run?
SBI's bank branches
27,400+ branches of State Bank of India and regional rural banks sell SBI Life policies (30 Sep 2026). They brought 53% of H1 FY27 new annual premium (APE).
Agents, offices and staff
3,10,000+ agents and 1,244 offices at 30 Sep 2026, and 27,653 permanent employees at 31 Mar 2026.
Capital above what the regulator requires
The regulator requires insurers to keep capital beyond their promises to policyholders. SBI Life's solvency ratio (capital held ÷ capital required) was 1.97 at 30 Sep 2026; IRDAI's minimum is 1.50.
Licence
SBI Life holds life-insurance registration no. 111 from the regulator IRDAI, granted on 29 Mar 2001.
15Where growth could come from
15Where growth could come from
Where could SBI Life's growth come from?
On 27 Oct 2026 management said SBI Life expects individual rated premium (IRP) to grow 14% to 15% in FY27, as guided at the start of the year, and that it will stick to its VNB margin guidance of 26% to 28%.
Agents and other channels
WorkingIndividual APE: agency ₹3,200 cr (+12%), others ₹580 cr (+26%), H1 FY27
Sales outside the bank grew faster than through it. Brokers, corporate agents and other channels rose to 19% of H1 FY27 APE from 14%.
Status: Working, on track against what the company said.
Non-par plans
Working38% → 45% of APE, H1 FY26 → H1 FY27
Non-par plans fix benefits at the start; the share covers savings, protection, annuity and group plans. Unit-linked plans fell to 51% of APE from 57%.
Status: Working, on track against what the company said.
Protection cover
Working₹2,210 cr → ₹3,240 cr new business premium, H1 FY26 → H1 FY27
Most of the rise came from group cover: ₹2,790 crore in H1 FY27, against ₹1,840 crore a year earlier.
Status: Working, on track against what the company said.
Bank branches
MixedIndividual APE ₹5,990 cr, +10%, H1 FY27
Bancassurance still grew, but more slowly than other channels. Its share of APE fell to 53% from 57%.
Status: Mixed, partly on track.
GST exemption on individual policies
MixedPAT impact ₹530 cr in H1 FY27, per management
The MD & CEO said in the FY26 release that the exemption "enhanced affordability and supported demand". On 27 Oct 2026 management put the GST impact on H1 FY27 profit at ₹530 crore.
Status: Mixed, partly on track.
Status compares progress with what the company itself said it would do: Working = on track against what the company said; Mixed = partly on track; Behind = behind the company's own plan; New = recently announced; Early = too early to judge.
16Financial strength and debt
16Financial strength · 31 Mar 2026
How much debt does SBI Life have?
- Total debt₹0 cr
- Cash and investments₹3,208 cr
- Net cash (cash minus debt)₹3,208 cr
- Net worth (shareholders' money)₹19,080 cr
- Debt to equity
- 0×
- ₹ of debt for every ₹1 of shareholders' money
- Contingent liabilities
- ₹605 cr
- possible future payments, e.g. disputed claims
- Cash here is cash and bank balances only. Assets under management were ₹487,163 crore at 31 Mar 2026, mostly policyholders' money held for future claims.
- The solvency ratio (capital held ÷ capital required) was 1.90 at 31 Mar 2026 and 1.97 at 30 Sep 2026; IRDAI's minimum is 1.50.
- Contingent liabilities were ₹604.8 crore at 31 Mar 2026 (₹1,211.7 crore a year earlier), including ₹228.5 crore of disputed insurance claims.
17Who owns it
17Who owns it · Q2 FY27
Who owns SBI Life?
- Promoters (founders or parent company)55.3%
- Foreign institutions (FII)20.7%
- Indian institutions (DII)20.1%
- Public and others3.9%
Promoter pledge
No promoter shares were pledged in Q2 FY27.
How ownership changed
* Pledged = share of the promoters' own holding reported as pledged. In older filings this can include shares “otherwise encumbered”; the governance flags say when.
Sources (12)
- Shareholding pattern as of 30 Sep 2026 (XBRL)
- Shareholding pattern as of 30 Jun 2026 (XBRL)
- Shareholding pattern as of 31 Mar 2026 (XBRL)
- Shareholding pattern as of 31 Dec 2025 (XBRL)
- Shareholding pattern as of 30 Sep 2025 (XBRL)
- Shareholding pattern as of 30 Jun 2025 (XBRL)
- Shareholding pattern as of 31 Mar 2025 (XBRL)
- Shareholding pattern as of 31 Dec 2024 (XBRL)
- Shareholding pattern as of 30 Sep 2024 (XBRL)
- Shareholding pattern as of 30 Jun 2024 (XBRL)
- Shareholding pattern as of 31 Mar 2024 (XBRL)
- Shareholding pattern as of 31 Dec 2023 (XBRL)
18What it does with profit
18What it does with profit
What does SBI Life do with its profit?
Dividend per share
₹2.70FY26
Dividend paid for each share, by financial year.
₹ per share
See the numbers
No buybacks or fund raises in the period covered.
19Governance signals
19Governance signals
What do SBI Life's governance filings show?
- Auditor
- K. S. Aiyar & Co. and J Singh & Associates (joint statutory auditors)
- Auditor changes
- None in the period covered
- Audit qualifications
- None reported
- Related-party dealings
- State Bank of India, which owns 55.31%, is SBI Life's largest distributor. SBI received ₹2,376.45 crore of commission and ₹49.41 crore of royalty from SBI Life in FY26, and SBI Life held ₹2,588.63 crore of cash and bank balances with SBI at 31 Mar 2026.
- Credit rating
- Crisil Crisil AAA (corporate credit rating) (outlook Stable), 9 May 2025
A credit rating describes the company's ability to repay debt. It is not a rating of the share.
Flags to know about
regulatory · 22 Sep 2021
IRDAI order to refund group administrative charges
IRDAI directed SBI Life, under section 34(1) of the Insurance Act, to distribute ₹84.32 crore of administrative charges paid to group master policyholders. The Securities Appellate Tribunal dismissed SBI Life's appeal on 7 Apr 2021 and the Supreme Court dismissed its petition on 22 Sep 2021. SBI Life made a provision in FY22 and had refunded ₹57.46 crore of the charges, plus ₹23.58 crore of interest, by 31 Mar 2026.
other · 24 Jul 2025
MD & CEO's term ends on 31 Jan 2027
Amit Jhingran was re-appointed MD & CEO for 1 Oct 2025 to 31 Jan 2027.
other · 29 May 2026
Deputy CEO changed in May 2026
Deputy CEO Dorababu Daparti was relieved on 18 May 2026 on being posted by SBI to SBI-SG Global Securities Services. Ramesh Venkateshamurthy was appointed Deputy CEO on 29 May 2026.
disclosure · 14 Jun 2024
Persistency method changed in 2024
From FY25 SBI Life calculates persistency under IRDAI's circular of 14 Jun 2024; FY22–FY24 figures use the circular of 30 Sep 2021. Figures before and after the change are not like for like.
Sources (8)
- Unaudited financial results Q2 FY27 (quarter and half year ended 30 Sep 2026)
- Integrated Annual Report FY26 (2025-26)
- Shareholding pattern as of 30 Sep 2026 (XBRL)
- Crisil Ratings: rating rationale, SBI Life (Crisil AAA/Stable reaffirmed)
- Board outcome 24 Jul 2025: re-appointment of MD & CEO Amit Jhingran (1 Oct 2025 to 31 Jan 2027)
- Change in management: Deputy CEO Dorababu Daparti relieved (18 May 2026)
- NSE corporate announcements list, SBILIFE (Jun 2024 to Nov 2026)
- Integrated Annual Report FY24 (2023-24)
20What the market paid
20What the market paid · price as of 11 Nov 2026
What did the market pay for SBI Life on 11 Nov 2026?
Price as of 11 Nov 2026 (shown for education; prices change daily).
Price as of 11 Nov 2026: ₹1,767.00, the NSE closing price. Market value: ₹177,302 crore (Cityfort calculation from the 11 Nov 2026 NSE closing price and 1,003,405,073 shares in the Sep 2026 shareholding pattern). P/E is the share price divided by one year's profit per share: here ₹26.47, the sum of basic EPS for Q3 FY26 to Q2 FY27 (66.8). P/B divides the price by shareholders' money per share at 30 Sep 2026, ₹20,539 crore in total (8.63). Insurers are also compared with embedded value (EV): shareholders' money plus the value of future profits on policies already sold. The market value was 2.03 times SBI Life's EV of ₹87,350 crore at 30 Sep 2026. All three ratios are Cityfort calculations from the Q3 FY26 to Q2 FY27 results and the H1 FY27 presentation. EV/EBITDA is not shown, because EBITDA does not fit an insurer's accounts.
- Share price
- ₹1,767.00
- Market value (market cap)
- ₹177,302 cr
- P/E
- 66.8×
- P/B
- 8.6×
Source: NSE historical price data, SBILIFE EQ (close 11 Nov 2026); Shareholding pattern as of 30 Sep 2026 (XBRL); Integrated filing (financials) XBRL Q2 FY27 and 4 more
Sources (7)
- NSE historical price data, SBILIFE EQ (close 11 Nov 2026)
- Shareholding pattern as of 30 Sep 2026 (XBRL)
- Integrated filing (financials) XBRL Q2 FY27
- Integrated filing (financials) XBRL Q1 FY27
- Integrated filing (financials) XBRL Q4 FY26 and FY26
- Integrated filing (financials) XBRL Q3 FY26
- News release and investor presentation, H1 FY27 (Performance Update 6M FY27)
21How it got here
21How it got here
How did SBI Life get here?
2000
Milestone
Incorporated
SBI Life Insurance Company was incorporated as a public limited company on 11 Oct 2000.
2001
Milestone
Life-insurance licence
IRDAI registered SBI Life as a life insurer (registration no. 111) on 29 Mar 2001.
2008
Milestone
No promoter capital after FY08
The FY26 annual report says the promoters have made no capital infusion after FY08.
2017
Milestone
Listed on NSE and BSE
SBI Life shares listed on NSE and BSE on 3 Oct 2017.
2024
Milestone
New persistency method
IRDAI's circular of 14 Jun 2024 changed how persistency is calculated; SBI Life uses it from FY25.
2025
Business-model change
GST removed on individual policies
In FY26 individual life policies became exempt from GST. In the 22 Apr 2026 earnings call, management said FY26 profit would have been ₹3,120 crore without GST and revised labour-law effects.
2025
Milestone
MD & CEO re-appointed
On 24 Jul 2025 the board re-appointed Amit Jhingran as MD & CEO for 1 Oct 2025 to 31 Jan 2027.
2026
Milestone
Gross premium above ₹100,000 crore
Gross premium income reached ₹101,286 crore in FY26, from ₹84,985 crore in FY25.
Sources (5)
- Integrated Annual Report FY26 (2025-26)
- Unaudited financial results Q2 FY27 (quarter and half year ended 30 Sep 2026)
- News release and investor presentation, FY26 (Performance Update 12M FY26)
- Transcript, Q4 FY26 earnings call (22 Apr 2026)
- Board outcome 24 Jul 2025: re-appointment of MD & CEO Amit Jhingran (1 Oct 2025 to 31 Jan 2027)
22Sources and changes
Where every number on this page comes from
Sources (39 documents)
- S1Integrated Annual Report FY26 (2025-26) · SBI Life (NSE annual reports) · Tier 1: company or exchange filing · 23 Jul 2026
- S3Integrated Annual Report FY24 (2023-24) · SBI Life (NSE annual reports) · Tier 1: company or exchange filing · 3 Aug 2024
- S4Unaudited financial results Q2 FY27 (quarter and half year ended 30 Sep 2026) · SBI Life (NSE filing) · Tier 1: company or exchange filing · 27 Oct 2026
- S5Integrated filing (financials) XBRL Q2 FY27 · NSE (XBRL) · Tier 1: company or exchange filing · 27 Oct 2026
- S6Integrated filing (financials) XBRL Q1 FY27 · NSE (XBRL) · Tier 1: company or exchange filing · 24 Jul 2026
- S7Integrated filing (financials) XBRL Q4 FY26 and FY26 · NSE (XBRL) · Tier 1: company or exchange filing · 22 Apr 2026
- S8Integrated filing (financials) XBRL Q3 FY26 · NSE (XBRL) · Tier 1: company or exchange filing · 28 Jan 2026
- S9Integrated filing (financials) XBRL Q2 FY26 · NSE (XBRL) · Tier 1: company or exchange filing · 24 Oct 2025
- S10Integrated filing (financials) XBRL Q1 FY26 · NSE (XBRL) · Tier 1: company or exchange filing · 24 Jul 2025
- S11Integrated filing (financials) XBRL Q4 FY25 and FY25 · NSE (XBRL) · Tier 1: company or exchange filing · 24 Apr 2025
- S12Audited financial results Q3 FY26 (incl. Q3 FY25 comparatives) · SBI Life (NSE filing) · Tier 1: company or exchange filing · 28 Jan 2026
- S13Audited financial results Q4 FY26 and FY26 · SBI Life (NSE filing) · Tier 1: company or exchange filing · 22 Apr 2026
- S14Unaudited financial results Q1 FY27 · SBI Life (NSE filing) · Tier 1: company or exchange filing · 24 Jul 2026
- S15Audited financial results Q2 FY26 · SBI Life (NSE filing) · Tier 1: company or exchange filing · 24 Oct 2025
- S16Audited financial results Q1 FY26 · SBI Life (NSE filing) · Tier 1: company or exchange filing · 24 Jul 2025
- S17News release and investor presentation, H1 FY27 (Performance Update 6M FY27) · SBI Life (NSE filing) · Tier 1: company or exchange filing · 27 Oct 2026
- S18News release and investor presentation, Q1 FY27 · SBI Life (NSE filing) · Tier 1: company or exchange filing · 24 Jul 2026
- S19News release and investor presentation, FY26 (Performance Update 12M FY26) · SBI Life (NSE filing) · Tier 1: company or exchange filing · 22 Apr 2026
- S23Transcript, Q2 FY27 earnings call (27 Oct 2026) · SBI Life (NSE filing) · Tier 1: company or exchange filing · 3 Nov 2026
- S24Transcript, Q1 FY27 earnings call (24 Jul 2026) · SBI Life (NSE filing) · Tier 1: company or exchange filing · 30 Jul 2026
- S25Transcript, Q4 FY26 earnings call (22 Apr 2026) · SBI Life (NSE filing) · Tier 1: company or exchange filing · 28 Apr 2026
- S26Transcript, Q3 FY26 earnings call (28 Jan 2026) · SBI Life (NSE filing) · Tier 1: company or exchange filing · 3 Feb 2026
- S27Shareholding pattern as of 30 Sep 2026 (XBRL) · NSE (XBRL) · Tier 1: company or exchange filing · 15 Oct 2026
- S28Shareholding pattern as of 30 Jun 2026 (XBRL) · NSE (XBRL) · Tier 1: company or exchange filing · 17 Jul 2026
- S29Shareholding pattern as of 31 Mar 2026 (XBRL) · NSE (XBRL) · Tier 1: company or exchange filing · 16 Apr 2026
- S30Shareholding pattern as of 31 Dec 2025 (XBRL) · NSE (XBRL) · Tier 1: company or exchange filing · 13 Jan 2026
- S31Shareholding pattern as of 30 Sep 2025 (XBRL) · NSE (XBRL) · Tier 1: company or exchange filing · 17 Oct 2025
- S32Shareholding pattern as of 30 Jun 2025 (XBRL) · NSE (XBRL) · Tier 1: company or exchange filing · 18 Jul 2025
- S33Shareholding pattern as of 31 Mar 2025 (XBRL) · NSE (XBRL) · Tier 1: company or exchange filing · 11 Apr 2025
- S34Shareholding pattern as of 31 Dec 2024 (XBRL) · NSE (XBRL) · Tier 1: company or exchange filing · 13 Jan 2025
- S35Shareholding pattern as of 30 Sep 2024 (XBRL) · NSE (XBRL) · Tier 1: company or exchange filing · 16 Oct 2024
- S36Shareholding pattern as of 30 Jun 2024 (XBRL) · NSE (XBRL) · Tier 1: company or exchange filing · 18 Jul 2024
- S37Shareholding pattern as of 31 Mar 2024 (XBRL) · NSE (XBRL) · Tier 1: company or exchange filing · 18 Apr 2024
- S38Shareholding pattern as of 31 Dec 2023 (XBRL) · NSE (XBRL) · Tier 1: company or exchange filing · 11 Jan 2024
- S39Crisil Ratings: rating rationale, SBI Life (Crisil AAA/Stable reaffirmed) · Crisil Ratings · Tier 2: rating agency or regulator · 9 May 2025
- S40NSE historical price data, SBILIFE EQ (close 11 Nov 2026) · NSE · Tier 1: company or exchange filing · 11 Nov 2026
- S42Board outcome 24 Jul 2025: re-appointment of MD & CEO Amit Jhingran (1 Oct 2025 to 31 Jan 2027) · SBI Life (NSE filing) · Tier 1: company or exchange filing · 24 Jul 2025
- S43Change in management: Deputy CEO Dorababu Daparti relieved (18 May 2026) · SBI Life (NSE filing) · Tier 1: company or exchange filing · 18 May 2026
- S44NSE corporate announcements list, SBILIFE (Jun 2024 to Nov 2026) · NSE · Tier 1: company or exchange filing · 11 Nov 2026
Changes to this page (v1 · 11 Nov 2026)
- v1 · 11 Nov 2026First version. (first version)
Numbers come only from tier 1 and tier 2 sources. Read how we research.
Disclaimer
For learning only. Cityfort is not a SEBI-registered adviser and does not recommend buying or selling any security. Prices shown are dated and may be out of date.
Investing in securities involves risk, including loss of capital. Before making any investment decision, do your own research and consider consulting a SEBI-registered investment adviser.
Cityfort, its owners and contributors may or may not hold securities of companies covered. Content is not an offer or solicitation to buy or sell any security.
Read the full disclaimerHide the full disclaimer
Cityfort publishes educational content that explains how listed companies work. Cityfort is not registered with the Securities and Exchange Board of India (SEBI) as an Investment Adviser or Research Analyst and does not provide investment advice, recommendations, ratings, price targets or any opinion on whether to buy, sell or hold any security.
All information is taken from publicly available sources, mainly company filings on BSE and NSE, which are listed on each page with dates. We work to keep it accurate and correct errors publicly, but we do not guarantee that it is complete, accurate or up to date. Any market price or price-based ratio shown is dated, may be out of date by the time you read it, and is included only to explain concepts.
Statements by company management are reported as statements, with their date and source; they are not our forecasts.