Power · NSE: ADANIGREEN · BSE: 541450
Adani Green Energy: how the business works
Adani Green Energy runs 20,763 MW of solar, wind and hybrid power plants in India and earned ₹12,928 crore of revenue in FY26.
Follow Adani Green Energy
Email me when Adani Green Energy's page is updated after results.
We store your email address with Kit, our email provider, which also records when you sign up and whether you open or click our emails. We send a confirmation email first. See our privacy policy.
Adani Green Energy Limited · Ahmedabad, Gujarat · Founded 2015
Updated for Q2 FY27 · checked
- Revenue, FY26
- ₹12,928 cr
- Profit to shareholders, FY26
- ₹1,652 cr
- Operating capacity, 30 Sep 2026
- 20,763 MW
- Founded
- 2015
- Promoter holding, Sep 2026 (none pledged)
- 62.43%
The short version
Adani Green Energy in 5 points
1 · What it sells
Adani Green Energy runs solar, wind and hybrid power plants with 20,763 MW of operating capacity and 6,632 MWh of batteries on 30 Sep 2026, and its FY26 revenue was ₹12,928 crore.
2 · Who pays it
Adani Green Energy does not split revenue by customer, but CARE puts central agencies such as SECI and NTPC at about 66% of its contracted capacity on 30 Jun 2026, companies (mostly through group firm PTSL) at about 21% and state and private utilities at about 12%.
3 · What it keeps from ₹100
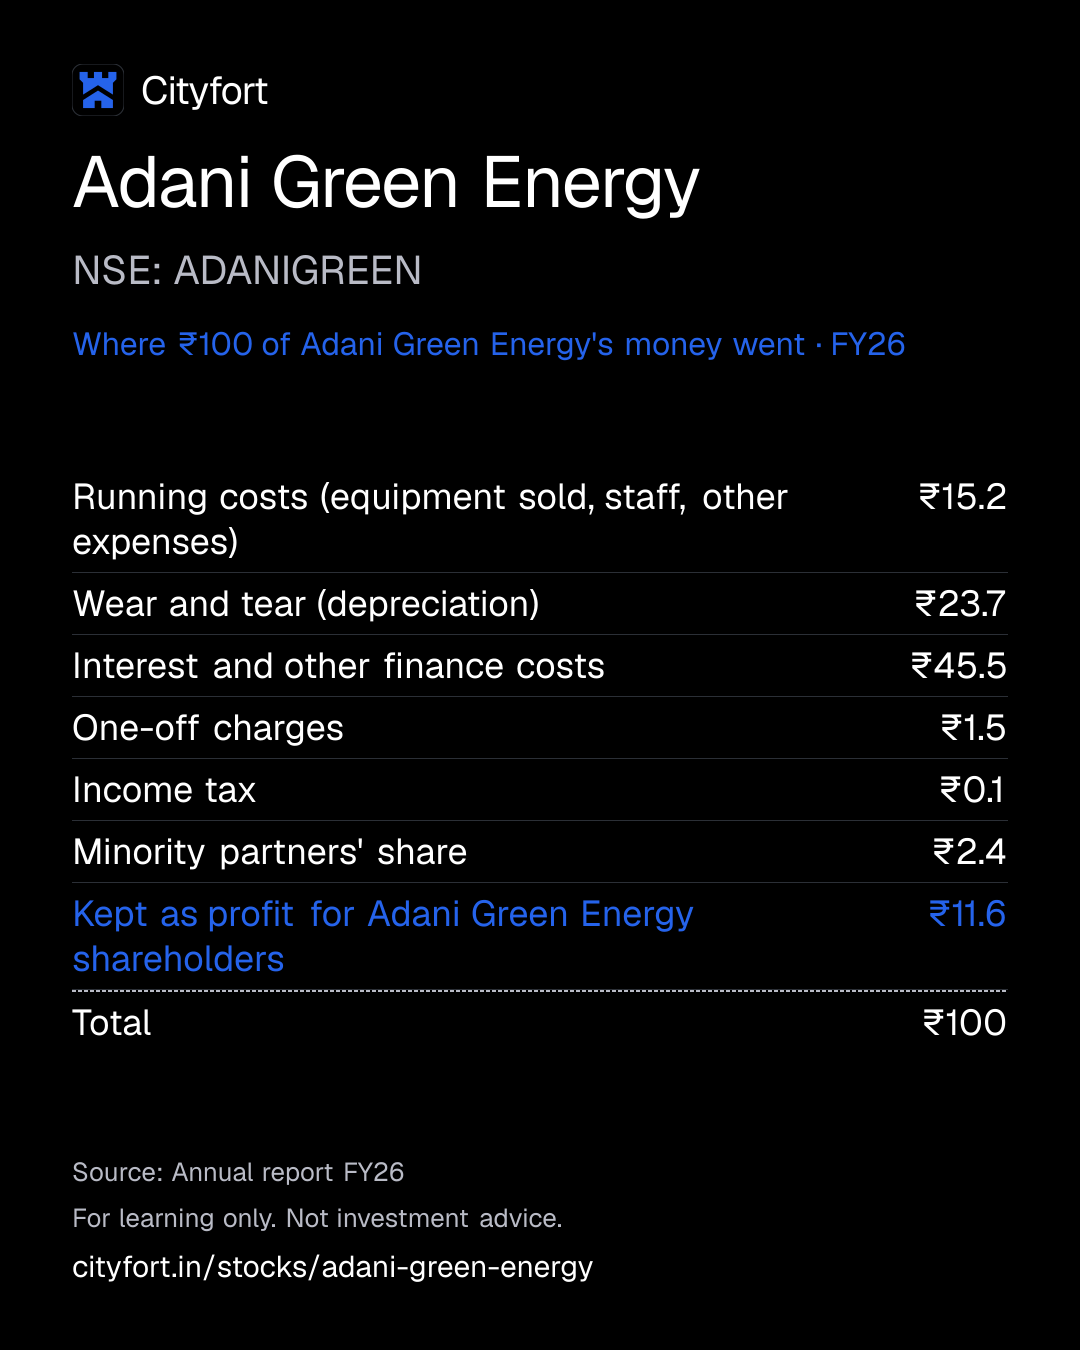
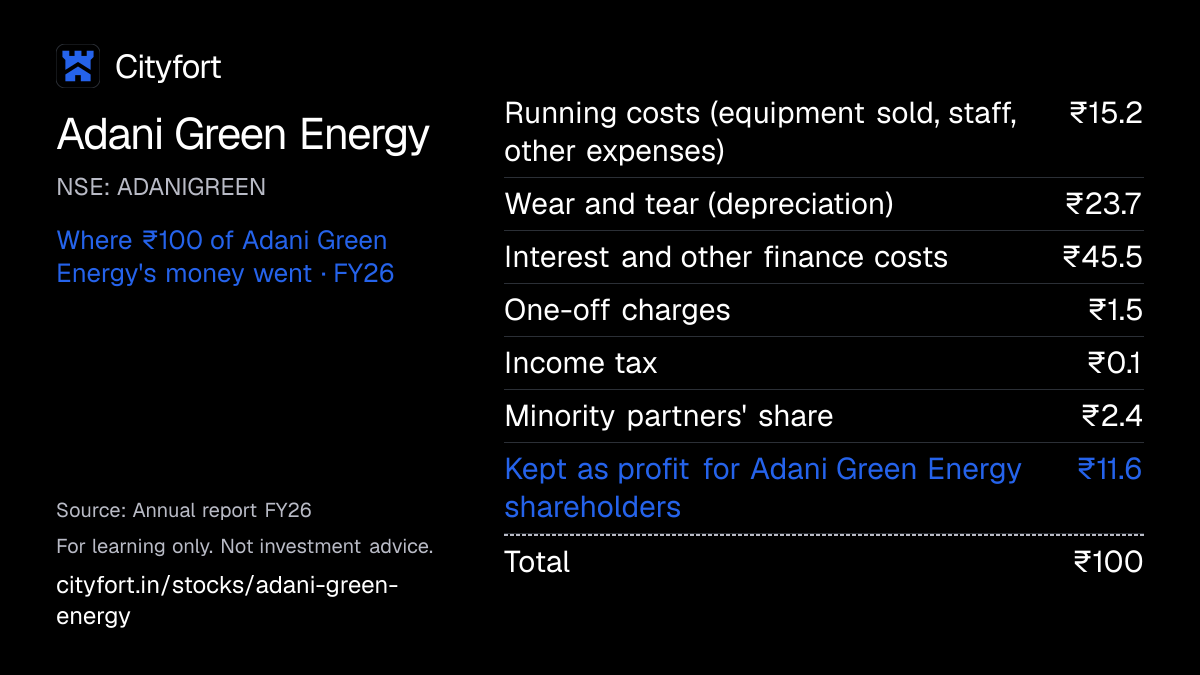
Of every ₹100 that came in during FY26, including other income and joint-venture profit, Adani Green Energy kept ₹11.6 for shareholders after ₹45.5 of interest, ₹23.7 of depreciation and ₹1.5 of one-off charges, while its operating profit (EBITDA, Cityfort calculation) was ₹81.6 per ₹100 of revenue.
4 · Where the operating profit comes from
In FY26 the renewable power segment earned ₹1,578 crore of profit before tax, while the equipment segment's ₹516 crore was almost all cancelled by ₹510 crore removed for sales within the group.
5 · The one thing to watch
Borrowings rose from ₹98,373 crore on 31 Mar 2026 to ₹112,311 crore on 30 Sep 2026, and CARE put FY26 net debt at 8.3 times EBITDA against the 5.5 times it had set as a negative threshold.
Sources: From Adani Green Energy's FY26 annual report, its Q4 FY26 and Q2 FY27 results, its H1 FY27 results presentation and CARE Ratings' 3 Sep 2026 report · checked
Sources (5)
- Earnings presentation H1 FY27 (consolidated financial performance)
- Integrated Annual Report FY26 (2025-26), incl. consolidated financial statements
- CareEdge Ratings press release: Adani Green Energy Ltd, bank facilities CARE AA; Stable / CARE A1+ reaffirmed (3 Sep 2026)
- Audited financial results Q4 FY26 and FY26 (to 31 Mar 2026), standalone and consolidated
- Consolidated results XBRL Q2 FY27 (integrated filing)
01Where the money goes · FY26
Where does ₹100 of Adani Green Energy's money go?
Adani Green Energy · FY26
Receipt for every ₹100
| Running costs (equipment sold, staff, other expenses) | ₹15.2 |
|---|---|
| Wear and tear (depreciation) | ₹23.7 |
| Interest and other finance costs | ₹45.5 |
| One-off charges | ₹1.5 |
| Income tax | ₹0.1 |
| Minority partners' share | ₹2.4 |
| Kept as profit for Adani Green Energy shareholders | ₹11.6 |
| Total | ₹100 |
Each line = amount ÷ total money in × 100. Lines may not add to exactly ₹100 because of rounding.
How this is worked out
Of every ₹100 that came in during FY26: revenue (₹12,928 crore), other income (₹891 crore) and the share of joint ventures' profit (₹417 crore). One-off charges were mainly ₹178 crore of costs for repaying loans early. Each line is a Cityfort calculation.
Save this receipt as an image
Embed this receipt or the key numbers
Paste this code into a blog or website to show the card you choose, with a link back to this page.
Each week: the next company due to report results, explained in 5 points.
We'll email you once a week with what changed on Cityfort. Facts only, no tips. Unsubscribe any time.
We store your email address with Kit, our email provider, which also records when you sign up and whether you open or click our emails. We send a confirmation email first. See our privacy policy.
02The business in one line
What does Adani Green Energy do?
Government power agencies, utilities and companies pay Adani Green Energy for electricity from its solar and wind plants under long-term contracts; most of the money goes on interest and wear and tear of those plants, and what's left is profit.
- Of every ₹100 that came in during FY26, interest took ₹45.5 and depreciation ₹23.7; ₹11.6 was left for shareholders.
- The plants are built mostly with loans: borrowings were ₹112,311 crore on 30 Sep 2026, against FY26 revenue of ₹12,928 crore.
03Who pays it
Who pays Adani Green Energy?
Adani Green Energy does not disclose how much each type of customer pays.
Central government agencies
Mainly SECI and NTPC, both rated CARE AAA; about 66% of contracted capacity on 30 Jun 2026, per CARE. They resell the power to state distribution companies.
Companies (commercial and industrial buyers)
About 21% of contracted capacity, mostly through PTSL, a wholly owned subsidiary of group company Adani Energy Solutions. PTSL's contracts run 25 years at fixed prices, such as ₹2.7 a unit for solar.
State and private utilities
About 12% of contracted capacity on 30 Jun 2026, per CARE.
How spread out the customers are
Adani Green Energy does not disclose revenue by customer. The shares above are CARE Ratings' split of the ~20.1 GW of contracted capacity on 30 Jun 2026, not of revenue.
04How it makes money
How does Adani Green Energy make money?
Plants cost a lot to build and little to run, so interest and output decide the profit.
A solar or wind plant has no fuel bill: running costs took ₹15.2 of every ₹100 that came in during FY26. The plants are built mostly with loans, so interest and wear and tear take most of the rest. Prices are fixed in long contracts, so revenue rises with capacity and with how much the sun, wind and grid allow.
Electricity sold (million units)
14,88037,567
FY23 to FY26
- Win a long-term contract to sell power at a fixed price
- Borrow most of the cost and build the plant
- The plant makes power with no fuel cost
- Buyers pay for every unit delivered
- Interest and loan repayments take much of the cash
- Cash, new loans and equity fund the next plants
↺ Step 6 feeds back into step 1.
05Business segments · FY26
Which businesses make up Adani Green Energy?
Renewable power generation and related activities
85.9%Selling electricity from its plants, plus related services. Segment profit here is profit before tax, as reported.
Revenue ₹12,227 cr · Operating profit ₹1,578 cr
Sale of goods and renewable power equipment
14.1%Goods and equipment sales, including those of associate Mundra Solar Energy. ₹1,306 crore of revenue and ₹510 crore of profit were removed as sales within the group.
Revenue ₹2,007 cr · Operating profit ₹516 cr
How the mix changed
- Renewable power generation and related activities
- Sale of goods and renewable power equipment
Revenue by segment, FY25 to FY26.
₹ crore
See the numbers
06The numbers · Consolidated · ₹ crore
How has Adani Green Energy done?
Revenue
₹12,928 crFY26
Revenue rose every year, from ₹5,133 crore in FY22 to ₹12,928 crore in FY26, and Q2 FY27 revenue was 41.6% above Q2 FY26.
₹ crore
See the numbers
Net profit
₹1,652 crFY26
Profit for shareholders rose every year to ₹1,652 crore in FY26, but Q3 FY26 was a ₹41 crore loss; for that quarter's weaker revenue, management cited seasonality and low wind, curtailment worsened by grid additions about two months late, and subdued market prices (23 Jan 2026 call).
₹ crore
See the numbers
Net profit for every ₹100 of revenue
₹12.8FY26
EBITDA is a Cityfort calculation (profit before tax, excluding joint-venture profit, plus interest and depreciation, less other income): ₹81.6 per ₹100 of FY26 revenue, after ₹219 crore of one-off charges, mostly ₹178 crore for repaying loans early.
Net margin: ₹ of net profit per ₹100 of revenue
See the numbers
Free cash flow
−₹15,962 crFY26
Free cash flow was negative in four of the five years, reaching minus ₹15,962 crore in FY26 as capex of ₹26,097 crore exceeded ₹10,135 crore of operating cash flow.
₹ crore · cash from operations minus spending on plants and equipment
See the numbers
See all yearly numbers
EBITDA = profit before interest, tax and wear-and-tear of assets. Financial year runs April to March (March year end). Net profit is the share belonging to the company's owners. Total net income differs from net profit to the company's owners: Total FY26 profit was ₹1,987 crore; ₹335 crore belonged to minority partners in subsidiaries, including TotalEnergies, which owns 50% of three of them.
Sources (13)
- Annual Report FY23 (2022-23), incl. consolidated financial statements (zip on NSE)
- Integrated Annual Report FY24 (2023-24), incl. consolidated financial statements
- Integrated Annual Report FY25 (2024-25), incl. consolidated financial statements
- Integrated Annual Report FY26 (2025-26), incl. consolidated financial statements
- Unaudited financial results Q3 FY26 (quarter and nine months to 31 Dec 2025)
- Audited financial results Q4 FY26 and FY26 (to 31 Mar 2026), standalone and consolidated
- Unaudited financial results Q1 FY26 (quarter to 30 Jun 2025)
- Consolidated results XBRL Q2 FY26 (revised integrated filing, 27 Jan 2026)
- Unaudited financial results Q2 FY27 (quarter and half year to 30 Sep 2026), standalone and consolidated, with notes
- Consolidated results XBRL Q3 FY26 (integrated filing)
- Consolidated results XBRL Q4 FY26 and FY26 (integrated filing)
- Consolidated results XBRL Q1 FY27 (integrated filing)
- Consolidated results XBRL Q2 FY27 (integrated filing)
07Who runs it
Who runs Adani Green Energy, and did they deliver?
Gautam S. Adani
Chairman
Vneet S. Jaain
Managing Director
Sagar R. Adani
Executive Director
Ashish Khanna
Chief Executive Officer
Saurabh Shah
Chief Financial Officer
What they said, and what happened
5 too early to tell
Said on 23 Jan 2026
Management said on the Q3 FY26 call that actual revenue for FY27 "would be in the range of about INR17,000 crores to, say, INR18,000 crores".
Too early to tellWhat happened
Revenue was ₹8,689 crore in H1 FY27.
Said on 23 Jan 2026
Management said on the same call that FY27 capex would be about ₹35,000 crore to ₹40,000 crore.
Too early to tellWhat happened
Capex in the cash flow statement was ₹16,012 crore in H1 FY27.
Said on 24 Apr 2026
Management said on the Q4 FY26 call: "We expect to commission north of 10,000 megawatt hours or 10 gigawatt hours in this coming year."
Too early to tellWhat happened
It added 1,972 MWh in Q1 FY27 and 3,081 MWh in Q2 FY27, reaching 6,632 MWh installed on 30 Sep 2026.
Said on 22 Jul 2026
CEO Ashish Khanna said on the Q1 FY27 call: "We remain on track to add 5 GW of greenfield capacity this year."
Too early to tellWhat happened
It added 1,469 MW in H1 FY27. On 22 Oct 2026 management said the target set at the start of the year was 4.5 to 5 GW, possible if the Phase 3 line comes by the end of Q4.
Said on 22 Jul 2026
Ashish Khanna said on the Q1 FY27 call that he expects no curtailment by the end of calendar 2026, at least from Khavda, for the capacity installed.
Too early to tellWhat happened
Solar grid availability was 78.9% in H1 FY27; on 22 Oct 2026 management said it now expects the Phase 3 transmission line by Q4 FY27.
Sources (9)
- Integrated Annual Report FY26 (2025-26), incl. consolidated financial statements
- Transcript of Q3 FY26 earnings call (held 23 Jan 2026; NSE letter of 30 Jan 2026 links to this file)
- Consolidated results XBRL Q2 FY27 (integrated filing)
- Unaudited financial results Q2 FY27 (quarter and half year to 30 Sep 2026), standalone and consolidated, with notes
- Transcript of Q4 FY26 equity earnings call (held 24 Apr 2026)
- Earnings presentation Q1 FY27
- Earnings presentation H1 FY27 (consolidated financial performance)
- Transcript of Q1 FY27 earnings call (held 22 Jul 2026)
- Transcript of Q2 FY27 earnings call (held 22 Oct 2026)
08What could go wrong
What could go wrong for Adani Green Energy?
- Debt
Large debt to build plants
Borrowings were ₹112,311 crore on 30 Sep 2026, up from ₹98,373 crore on 31 Mar 2026. CARE put FY26 net debt at 8.3 times EBITDA, above its 5.5 times threshold.
Watch Net debt to EBITDA in CARE's reviews, and ₹11,238 crore of long-term repayments due in FY29.
- Execution
Grid lines not ready for new plants
When the grid cannot take all the power, output is curtailed (cut back). Ashish Khanna said on 22 Jul 2026 that curtailment has an impact of 5% to 7% on overall EBITDA.
Watch Solar grid availability (78.9% in H1 FY27) and the Phase 3 Khavda line, expected by Q4 FY27 per management.
- Execution
A large building programme
CARE counts 36.2 GW of renewable capacity, 24.4 GWh of batteries and 22.8 GWh of pumped storage under construction for FY27–FY30, and estimates ₹144,000 crore of capex.
Watch Capacity added each quarter against management's stated aims, and free cash flow (minus ₹15,962 crore in FY26).
- Governance
Group companies as buyer and supplier
Most power sold to companies goes through group company PTSL. It also buys modules and wind turbines from group companies Adani New Industries and Mundra Solar Energy.
Watch The result of the 16 Nov 2026 EGM on deals worth up to ₹4,345 crore and ₹1,550 crore over FY27–FY28.
- Legal
Legal cases involving directors
A US indictment of three directors was dismissed with prejudice on 10 Aug 2026; two directors paid SEC civil penalties under a consent judgment, without admitting or denying the allegations. The company says it was not a party. It settled a SEBI case in Sep 2026 without admitting or denying the findings.
Watch Any new filings on these matters, and how rating agencies refer to them.
- Other
Output depends on sun and wind
Buyers pay for units delivered, so less sun or wind means less revenue, CARE notes. Wind plants' average output (CUF) was 26.6% of capacity in FY26, against 27.2% in FY25.
Watch CUF by solar, wind and hybrid in each results presentation.
Sources (13)
- Consolidated results XBRL Q2 FY27 (integrated filing)
- Integrated Annual Report FY26 (2025-26), incl. consolidated financial statements
- CareEdge Ratings press release: Adani Green Energy Ltd, bank facilities CARE AA; Stable / CARE A1+ reaffirmed (3 Sep 2026)
- Earnings presentation H1 FY27 (consolidated financial performance)
- Transcript of Q1 FY27 earnings call (held 22 Jul 2026)
- Transcript of Q2 FY27 earnings call (held 22 Oct 2026)
- Notice of EGM 16 Nov 2026: material RPTs with Adani New Industries and Mundra Solar Energy; borrowing limit
- Further update on US matter: indictment dismissed with prejudice (order 10 Aug 2026)
- Further update on US matter: SEC final judgment on consent entered 10 Aug 2026
- Unaudited financial results Q2 FY27 (quarter and half year to 30 Sep 2026), standalone and consolidated, with notes
- Reg 30 disclosure: SEBI settlement order (Reg 33(1)(d)), settlement amount Rs 45,50,000
- Earnings presentation FY26 (operational and financial highlights)
- Integrated Annual Report FY25 (2024-25), incl. consolidated financial statements
09Supporters and critics
What do supporters and critics point to?
What supporters point to
- CARE says the whole ~20.1 GW operating portfolio was under long-term contracts on 30 Jun 2026, about 66% with central agencies SECI and NTPC.
- Revenue rose every year from ₹5,133 crore in FY22 to ₹12,928 crore in FY26, and Q2 FY27 revenue was 41.6% above Q2 FY26.
- Operating capacity reached 20,763 MW on 30 Sep 2026, after 5,051 MW was added in FY26.
- The US indictment of three directors was dismissed with prejudice on 10 Aug 2026, and CARE reaffirmed its AA; Stable rating on 3 Sep 2026.
What critics point to
- Borrowings reached ₹112,311 crore on 30 Sep 2026, and CARE put FY26 net debt at 8.3 times EBITDA, above its 5.5 times threshold.
- Interest took ₹45.5 of every ₹100 that came in during FY26, and free cash flow was minus ₹15,962 crore.
- About 21% of contracted capacity is sold to companies mostly through PTSL, a group company.
- Two directors paid SEC civil penalties of US$6 million and US$12 million under a consent judgment, without admitting or denying the allegations; CARE says "residual reputational and governance considerations remain".
10What to watch next
What should you watch next at Adani Green Energy?
Next event
Q3 FY27 results
Date not announced yet.
Shareholder vote on 16 Nov 2026
The EGM votes on deals with group companies Adani New Industries (₹4,345 crore) and Mundra Solar Energy (₹1,550 crore) over FY27–FY28, and on a higher borrowing limit.
Phase 3 transmission at Khavda
Management said on the 22 Oct 2026 call it now expects the line by Q4 FY27, and could then commission 4.5 to 5 GW.
Debt against cash flow
Borrowings were ₹112,311 crore on 30 Sep 2026; CARE put FY26 net debt at 8.3 times EBITDA, against a 5.5 times threshold.
Battery storage
6,632 MWh was installed by 30 Sep 2026; Ashish Khanna said on 22 Oct 2026 the company remains on track to exceed 10 GWh during the year.
11Key facts
Key facts about Adani Green Energy
- What does Adani Green Energy do?
- Adani Green Energy builds and runs solar, wind and hybrid power plants in India and sells the electricity under long-term contracts. It had 20,763 MW of operating capacity and 6,632 MWh of battery storage on 30 Sep 2026.
- How does Adani Green Energy make money?
- Adani Green Energy makes most of its money by selling electricity: power supply brought in ₹11,602 crore of its ₹12,928 crore revenue in FY26, or 89.7% (Cityfort calculation).
- Who are Adani Green Energy's customers?
- By CARE Ratings' count on 30 Jun 2026, about 66% of Adani Green Energy's contracted capacity was with central agencies such as SECI and NTPC, about 21% with companies (mostly through Powerpulse Trading Solutions, an Adani Energy Solutions subsidiary) and about 12% with state and private utilities.
- How big is Adani Green Energy?
- Adani Green Energy's revenue was ₹12,928 crore in FY26, up 15.3% from ₹11,212 crore in FY25. Profit for its shareholders was ₹1,652 crore in FY26, up from ₹1,444 crore.
- Who owns Adani Green Energy?
- On 30 Sep 2026 the Adani promoter group owned 62.43% of Adani Green Energy, with no shares pledged. Two TotalEnergies companies held 17.25%, foreign portfolio investors 11.33% and Indian institutions 5.29%.
- Why do Adani Green Energy's shareholders not get all of its profit?
- In FY26, ₹335 crore of Adani Green Energy's ₹1,987 crore profit belonged to minority partners in its subsidiaries, including TotalEnergies, which owns 50% of three of them. That left ₹1,652 crore for Adani Green Energy's shareholders.
- How much debt does Adani Green Energy have?
- Adani Green Energy's borrowings were ₹112,311 crore on 30 Sep 2026, up from ₹98,373 crore on 31 Mar 2026. Its finance costs were ₹6,484 crore in FY26.
- Does Adani Green Energy pay a dividend?
- Adani Green Energy has not declared a dividend since it was incorporated in 2015, according to its FY26 annual report.
- Where are Adani Green Energy's plants?
- Adani Green Energy's plants are all in India, across 12 states. Of the 5,051 MW it added in FY26, 4,613 MW was at Khavda in Gujarat.
Sources (8)
- Earnings presentation H1 FY27 (consolidated financial performance)
- Audited financial results Q4 FY26 and FY26 (to 31 Mar 2026), standalone and consolidated
- Integrated Annual Report FY26 (2025-26), incl. consolidated financial statements
- CareEdge Ratings press release: Adani Green Energy Ltd, bank facilities CARE AA; Stable / CARE A1+ reaffirmed (3 Sep 2026)
- Shareholding pattern Q2 FY27 (quarter to 2026-09), XBRL
- Consolidated results XBRL Q2 FY27 (integrated filing)
- Business Responsibility and Sustainability Report FY26
- Earnings presentation FY26 (operational and financial highlights)
Terms on this page
- Capital expenditure (capex)
- Credit rating
- EBITDA
- FII and DII holding
- Free cash flow
- Market capitalisation
- Net debt
- Net profit
- Operating margin
- Promoter holding
Each explains the term in plain English, with the same number from other companies on Cityfort.
Go deeper
More detail from the same filings. Open any section.
12What it sells
12What it sells
What does Adani Green Energy sell?
Solar power
Fields of solar panels that make power in daytime: 14,550 MW running on 30 Sep 2026, and 24,005 million units sold in FY26.
Wind power
Wind turbines: 2,947 MW running on 30 Sep 2026, and 4,918 million units sold in FY26.
Hybrid power
Solar panels and wind turbines at the same site: 3,266 MW running on 30 Sep 2026, and 8,644 million units sold in FY26.
Battery storage
Large batteries that store daytime solar power and release it in the evening peak: 6,632 MWh installed by 30 Sep 2026.
Goods and equipment
Some sales of goods and power equipment, which brought in ₹724 crore of FY26 revenue.
What it does
- Does: Builds and runs solar, wind and hybrid plants in 12 Indian states
- Does: Sells power under long-term contracts to government agencies, utilities and companies
- Does: Stores power in batteries to sell at other hours
What it does not do
- Does not: Does not sell to homes: agencies such as SECI and NTPC resell its power to state distribution companies
- Does not: Has no plants outside India, according to its FY26 BRSR
13How the money flows
13How the money flows · FY26
How does money flow through Adani Green Energy?
Money in
- Revenue from operations₹12,928 cr
- Share of profit of joint ventures and associates₹417 cr
- Other income₹891 cr
The company
Adani Green Energy
₹14,236 cr came in
Money out
- Running costs: equipment and materials sold, staff and other expenses₹2,160 cr
- Depreciation and amortisation (wear and tear of plants)₹3,372 cr
- Interest and other finance costs₹6,484 cr
- One-off charges (exceptional items)₹219 cr
- Income tax₹14 cr
- Profit belonging to minority partners in subsidiaries₹335 cr
- Net profit for Adani Green Energy shareholders₹1,652 cr
- In FY26 Adani Green Energy's plants and other sales brought in ₹12,928 crore of revenue, plus ₹891 crore of other income.
- Joint ventures and associates added ₹417 crore as its share of their profit.
- Running costs took ₹2,160 crore, and wear and tear of the plants ₹3,372 crore.
- Interest took ₹6,484 crore, one-off charges ₹219 crore and income tax ₹14 crore.
- Minority partners in some subsidiaries took ₹335 crore, leaving ₹1,652 crore for Adani Green Energy's shareholders.
14What it needs to run
14What it needs to run
What does Adani Green Energy need to run?
Land at Khavda
Its main site in Gujarat covers 538 sq km; 4,613 MW of the 5,051 MW added in FY26 was built there.
Grid connections
Power reaches buyers through the grid. Solar plants' grid availability was 78.9% in H1 FY27, and management called the Phase 3 Khavda line "out of our control" on 22 Oct 2026.
Borrowed money
CARE says the capex plan is to be funded 75% with debt; borrowings were ₹112,311 crore on 30 Sep 2026.
Solar modules and wind turbines
Bought partly from group companies Adani New Industries and Mundra Solar Energy, according to the 23 Oct 2026 EGM notice.
People
976 permanent employees in FY26, on the standalone basis of its BRSR.
Sources (7)
- Earnings presentation H1 FY27 (consolidated financial performance)
- Earnings presentation FY26 (operational and financial highlights)
- Transcript of Q2 FY27 earnings call (held 22 Oct 2026)
- CareEdge Ratings press release: Adani Green Energy Ltd, bank facilities CARE AA; Stable / CARE A1+ reaffirmed (3 Sep 2026)
- Consolidated results XBRL Q2 FY27 (integrated filing)
- Notice of EGM 16 Nov 2026: material RPTs with Adani New Industries and Mundra Solar Energy; borrowing limit
- Business Responsibility and Sustainability Report FY26
15Where growth could come from
15Where growth could come from
Where could Adani Green Energy's growth come from?
On the Q2 FY27 call (22 Oct 2026), CEO Ashish Khanna said the company remains on track to exceed 10 GWh of battery storage during the year. Management said it could commission 4.5 to 5 GW of new plants if the Phase 3 transmission line at Khavda comes by the end of Q4 FY27.
New plants at Khavda
Mixed1,469 MW added in H1 FY27
Khavda took 4,613 MW of the 5,051 MW added in FY26. New capacity now waits on the Phase 3 transmission line.
Status: Mixed, partly on track.
Battery storage
Working6,632 MWh on 30 Sep 2026
It added 1,972 MWh in Q1 FY27 and 3,081 MWh in Q2 FY27, against a stated aim of more than 10 GWh in FY27.
Status: Working, on track against what the company said.
Pumped-storage hydro
EarlyFirst 500 MW plant, Chitravathi
Pumped storage moves water uphill and releases it through turbines later. CARE says the first 500 MW is due by FY27-end, with most such capacity from FY29.
Status: Early, too early to judge.
Long-term contracts instead of market sales
Working~20.1 GW all contracted (30 Jun 2026)
CARE says the whole portfolio was contracted, against ~83% at its previous review. Market prices for solar power fell to ₹2.3 a unit in FY26 from ₹3.0.
Status: Working, on track against what the company said.
Status compares progress with what the company itself said it would do: Working = on track against what the company said; Mixed = partly on track; Behind = behind the company's own plan; New = recently announced; Early = too early to judge.
Sources (6)
- Transcript of Q2 FY27 earnings call (held 22 Oct 2026)
- Earnings presentation FY26 (operational and financial highlights)
- Earnings presentation H1 FY27 (consolidated financial performance)
- Earnings presentation Q1 FY27
- Transcript of Q4 FY26 equity earnings call (held 24 Apr 2026)
- CareEdge Ratings press release: Adani Green Energy Ltd, bank facilities CARE AA; Stable / CARE A1+ reaffirmed (3 Sep 2026)
16Financial strength and debt
16Financial strength · 31 Mar 2026
How much debt does Adani Green Energy have?
- Total debt₹98,373 cr
- Cash and investments₹4,393 cr
- Net debt (debt minus cash)₹93,980 cr
- Net worth (shareholders' money)₹29,879 cr
- Debt to equity
- 3.29×
- ₹ of debt for every ₹1 of shareholders' money
- Interest cover
- 1.6×
- how many times operating profit covers interest
- Borrowings rose to ₹112,311 crore on 30 Sep 2026 (₹100,484 crore long-term and ₹11,827 crore short-term).
- Borrowings exclude lease liabilities of ₹3,067 crore and ₹2,105 crore of suppliers' credit from banks (31 Mar 2026).
- The company's own measure: gross debt of ₹114,848 crore and net debt of ₹102,973 crore on 30 Sep 2026, after ₹11,875 crore of cash and bank balances including deposits held as debt reserves.
- CARE Ratings put FY26 net debt at 8.3 times EBITDA (6.9 times in FY25), above the 5.5 times it had set as a negative sensitivity threshold. The company puts net debt at 5.6 times its own 'run-rate EBITDA' (Sep 2026).
- Interest cover: FY26 EBITDA of ₹10,549 crore was 1.63 times finance costs of ₹6,484 crore (Cityfort calculation).
- Net worth here is total equity including minority partners (₹9,914 crore); equity for Adani Green Energy shareholders was ₹19,965 crore.
- The company says all foreign-currency loan principal is hedged. Its schedule shows long-term repayments of ₹1,438 crore in H2 FY27, ₹4,016 crore in FY28 and ₹11,238 crore in FY29.
Sources (4)
- Integrated Annual Report FY26 (2025-26), incl. consolidated financial statements
- Consolidated results XBRL Q2 FY27 (integrated filing)
- Earnings presentation H1 FY27 (consolidated financial performance)
- CareEdge Ratings press release: Adani Green Energy Ltd, bank facilities CARE AA; Stable / CARE A1+ reaffirmed (3 Sep 2026)
17Who owns it
17Who owns it · Q2 FY27
Who owns Adani Green Energy?
- Promoters (founders or parent company)62.4%
- Foreign institutions (FII)11.3%
- Indian institutions (DII)5.3%
- Public and others20.9%
Promoter pledge
No promoter shares were pledged in Q2 FY27.
How ownership changed
* Pledged = share of the promoters' own holding reported as pledged. In older filings this can include shares “otherwise encumbered”; the governance flags say when.
Sources (12)
- Shareholding pattern Q2 FY27 (quarter to 2026-09), XBRL
- Shareholding pattern Q1 FY27 (quarter to 2026-06), XBRL
- Shareholding pattern Q4 FY26 (quarter to 2026-03), XBRL
- Shareholding pattern Q3 FY26 (quarter to 2025-12), XBRL
- Shareholding pattern Q2 FY26 (quarter to 2025-09), XBRL
- Shareholding pattern Q1 FY26 (quarter to 2025-06), XBRL
- Shareholding pattern Q4 FY25 (quarter to 2025-03), XBRL
- Shareholding pattern Q3 FY25 (quarter to 2024-12), XBRL
- Shareholding pattern Q2 FY25 (quarter to 2024-09), XBRL
- Shareholding pattern Q1 FY25 (quarter to 2024-06), XBRL
- Shareholding pattern Q4 FY24 (quarter to 2024-03), XBRL
- Shareholding pattern Q3 FY24 (quarter to 2023-12), XBRL
18What it does with profit
18What it does with profit
What does Adani Green Energy do with its profit?
Money raised · 18 Jan 2024
Shareholders approved 63,143,677 warrants for promoter-group company Ardour Investment Holding at ₹1,480.75 each, up to ₹9,350 crore in all.
₹9,350 cr
Money raised · 31 Mar 2026
In FY26 the company received ₹7,012 crore on the warrants and issued the 63,143,677 shares, taking the total to 1,647,176,155.
₹7,012 cr
19Governance signals
19Governance signals
What do Adani Green Energy's governance filings show?
- Auditor
- S R B C & Co LLP and Dharmesh Parikh & Co LLP (joint auditors)
- Auditor changes
- None in the period covered
- Audit qualifications
- None reported
- Related-party dealings
- Most power sold to companies goes through PTSL, a subsidiary of group company Adani Energy Solutions, CARE says. Unsecured loans from related parties fell to ₹314 crore on 31 Mar 2026 from ₹4,730 crore a year earlier.
- Credit rating
- CARE Ratings CARE AA (long term), CARE A1+ (short term), on ₹19,730 crore of bank facilities (outlook Stable), 3 Sep 2026
A credit rating describes the company's ability to repay debt. It is not a rating of the share.
Flags to know about
regulatory · 21 Oct 2026
US court cases involving three directors
On 21 Nov 2024 the company disclosed a US criminal indictment by the Department of Justice (DOJ) and a civil complaint by the Securities and Exchange Commission (SEC). Both were filed in a New York federal court against board members Gautam Adani and Sagar Adani; the indictment also named board member Vneet Jaain. The company said: "There are no allegations made against the Company." The company said the three directors were charged with alleged securities fraud conspiracy, alleged wire fraud conspiracy and alleged securities fraud, and not with any FCPA (US Foreign Corrupt Practices Act) violation. On 10 Aug 2026 the court dismissed the indictment against Gautam S. Adani, Sagar R. Adani and Vneet S. Jaain with prejudice, on a DOJ motion. It also entered a final judgment on consent in the SEC case. Gautam Adani and Sagar Adani, without admitting or denying the allegations, agreed to civil penalties of US$6 million and US$12 million. They are permanently restrained and enjoined from violating specified sections of US securities laws. The Q2 FY27 results say the penalties have been paid and the matter has concluded.
regulatory · 22 Sep 2026
SEBI settlement order, Sep 2026
On 22 Sep 2026 the company disclosed that it settled with SEBI an alleged violation of Regulation 33(1)(d) of the listing rules, read with Clause 2 of the earlier Listing Agreement, "without admitting or denying the findings of facts and conclusions of law". The settlement amount was ₹0.46 crore (INR 45,50,000). The FY24 annual report says the notice concerned the validity of one joint auditor's peer review certificate in earlier years.
auditor · 30 May 2026
Emphasis of matter in the FY26 audit report
The joint auditors drew attention to the note on the US indictment and complaint against certain directors, then pending. This is not a qualification: "Our opinion is not modified in respect of this matter."
related party · 23 Oct 2026
Group companies on both sides of deals
Most of the ~21% of capacity sold to companies goes through PTSL, a group company, CARE says. An EGM on 16 Nov 2026 votes on buying goods and services worth up to ₹4,345 crore from Adani New Industries and ₹1,550 crore from Mundra Solar Energy over FY27 and FY28.
regulatory · 30 May 2025
Short-seller report matters (FY23)
After a short seller's report in FY23 on Adani Group companies, the Supreme Court disposed of the related appeals on 3 Jan 2024. The FY25 annual report says "management believes that as of date, all the above matters of investigation by SEBI have been concluded".
regulatory · 28 May 2024
Exchange penalty over board composition, 2023
Stock exchanges levied a ₹0.16 crore penalty for a delay in meeting board and Nomination and Remuneration Committee composition rules from 23 May to 6 Sep 2023. The FY24 annual report says the company complied from 7 Sep 2023.
Sources (15)
- Integrated Annual Report FY26 (2025-26), incl. consolidated financial statements
- CareEdge Ratings press release: Adani Green Energy Ltd, bank facilities CARE AA; Stable / CARE A1+ reaffirmed (3 Sep 2026)
- Update: US DOJ indictment and US SEC civil complaint against directors; subsidiaries not proceeding with USD bonds
- Clarification on news item (CNBC-TV18, 21 Nov 2024): no allegations against the Company; group media release
- Reg 30 intimation with litigation details (Cr. No. 24-CR-433; 1:24 Civ. 8080)
- Clarification on media articles: directors not charged under FCPA
- Further update on US matter: request for consent final judgment in SEC case (civil penalties USD 6 mn / 12 mn)
- Further update on US matter: DOJ motion to dismiss indictment with prejudice
- Further update on US matter: indictment dismissed with prejudice (order 10 Aug 2026)
- Further update on US matter: SEC final judgment on consent entered 10 Aug 2026
- Unaudited financial results Q2 FY27 (quarter and half year to 30 Sep 2026), standalone and consolidated, with notes
- Reg 30 disclosure: SEBI settlement order (Reg 33(1)(d)), settlement amount Rs 45,50,000
- Integrated Annual Report FY24 (2023-24), incl. consolidated financial statements
- Notice of EGM 16 Nov 2026: material RPTs with Adani New Industries and Mundra Solar Energy; borrowing limit
- Integrated Annual Report FY25 (2024-25), incl. consolidated financial statements
20What the market paid
20What the market paid · price as of 11 Nov 2026
What did the market pay for Adani Green Energy on 11 Nov 2026?
Price as of 11 Nov 2026 (shown for education; prices change daily).
Price as of 11 Nov 2026: ₹1,401.70, the NSE closing price. Market value as of 11 Nov 2026 was ₹230,885 crore (price × 1,647,176,155 shares in the Sep 2026 shareholding pattern). P/E (price ÷ earnings per share) was 145.3 on FY26 earnings of ₹9.65 a share. P/B (market value ÷ shareholders' equity) was 10.69 on 30 Sep 2026 equity of ₹21,592 crore. Market value, P/E and P/B are Cityfort calculations.
- Share price
- ₹1,401.70
- Market value (market cap)
- ₹230,885 cr
- P/E
- 145.3×
- P/B
- 10.7×
Source: NSE historical price data, ADANIGREEN EQ, 1-12 Nov 2026 (close 11 Nov 2026); Shareholding pattern Q2 FY27 (quarter to 2026-09), XBRL; Integrated Annual Report FY26 (2025-26), incl. consolidated financial statements and 1 more
21How it got here
21How it got here
How did Adani Green Energy get here?
2015
Milestone
Incorporated
Adani Green Energy Limited was incorporated in 2015, with its head office in Ahmedabad.
2024
Milestone
Promoter warrants approved
In Jan 2024 shareholders approved warrants for promoter-group firm Ardour at ₹1,480.75 each, up to ₹9,350 crore; they became shares in FY26.
2024
Crisis
US charges against directors
On 21 Nov 2024 it disclosed the US DOJ indictment and SEC complaint against directors; subsidiaries dropped planned US dollar bond offerings.
2025
Milestone
Rating watch removed
India Ratings had put its rating on watch negative on 26 Nov 2024; it affirmed IND AA-/Stable on 5 May 2025.
2026
Crisis
Loss in Q3 FY26
Oct–Dec 2025 ended with a ₹41 crore loss for shareholders, and finance costs rose 35.7% to ₹1,698 crore. On the 23 Jan 2026 call, management cited seasonality, low wind, delayed grid additions and subdued market prices for weaker revenue.
2026
Milestone
5,051 MW added in a year
In FY26 it added 5,051 MW, 4,613 MW of it at Khavda, reaching 19,294 MW.
2026
Business-model change
Whole portfolio under contract
CARE says all ~20.1 GW was under long-term contracts by 30 Jun 2026, against ~83% before, with sales to companies mostly through group firm PTSL.
2026
Milestone
US cases against directors end
On 10 Aug 2026 a US court dismissed the indictment against the three directors with prejudice and entered a consent judgment in the SEC case.
2026
Milestone
Batteries reach 6,632 MWh
It added 3,081 MWh of battery storage in Q2 FY27, reaching 6,632 MWh by 30 Sep 2026.
Sources (14)
- Business Responsibility and Sustainability Report FY26
- Integrated Annual Report FY24 (2023-24), incl. consolidated financial statements
- Integrated Annual Report FY26 (2025-26), incl. consolidated financial statements
- Update: US DOJ indictment and US SEC civil complaint against directors; subsidiaries not proceeding with USD bonds
- USD bond offering intimation by subsidiaries (AHEJ One, AHEJ Two, ASEJ One)
- Credit rating intimation: India Ratings places IND AA- on Rating Watch Negative
- Credit rating intimation: India Ratings affirms IND AA-/Stable, watch resolved
- Unaudited financial results Q3 FY26 (quarter and nine months to 31 Dec 2025)
- Transcript of Q3 FY26 earnings call (held 23 Jan 2026; NSE letter of 30 Jan 2026 links to this file)
- Earnings presentation FY26 (operational and financial highlights)
- CareEdge Ratings press release: Adani Green Energy Ltd, bank facilities CARE AA; Stable / CARE A1+ reaffirmed (3 Sep 2026)
- Further update on US matter: indictment dismissed with prejudice (order 10 Aug 2026)
- Further update on US matter: SEC final judgment on consent entered 10 Aug 2026
- Earnings presentation H1 FY27 (consolidated financial performance)
22Sources and changes
Where every number on this page comes from
Sources (48 documents)
- S1Integrated Annual Report FY26 (2025-26), incl. consolidated financial statements · NSE (company filing, nsearchives.nseindia.com) · Tier 1: company or exchange filing · 30 May 2026
- S2Integrated Annual Report FY25 (2024-25), incl. consolidated financial statements · NSE (company filing, nsearchives.nseindia.com) · Tier 1: company or exchange filing · 30 May 2025
- S3Integrated Annual Report FY24 (2023-24), incl. consolidated financial statements · NSE (company filing, nsearchives.nseindia.com) · Tier 1: company or exchange filing · 28 May 2024
- S4Annual Report FY23 (2022-23), incl. consolidated financial statements (zip on NSE) · NSE (company filing, nsearchives.nseindia.com) · Tier 1: company or exchange filing · 27 Jun 2023
- S5Unaudited financial results Q2 FY27 (quarter and half year to 30 Sep 2026), standalone and consolidated, with notes · NSE (company filing, nsearchives.nseindia.com) · Tier 1: company or exchange filing · 21 Oct 2026
- S6Audited financial results Q4 FY26 and FY26 (to 31 Mar 2026), standalone and consolidated · NSE (company filing, nsearchives.nseindia.com) · Tier 1: company or exchange filing · 24 Apr 2026
- S7Unaudited financial results Q3 FY26 (quarter and nine months to 31 Dec 2025) · NSE (company filing, nsearchives.nseindia.com) · Tier 1: company or exchange filing · 23 Jan 2026
- S8Unaudited financial results Q1 FY26 (quarter to 30 Jun 2025) · NSE (company filing, nsearchives.nseindia.com) · Tier 1: company or exchange filing · 28 Jul 2025
- S9Consolidated results XBRL Q2 FY27 (integrated filing) · NSE (XBRL) · Tier 1: company or exchange filing · 21 Oct 2026
- S10Consolidated results XBRL Q1 FY27 (integrated filing) · NSE (XBRL) · Tier 1: company or exchange filing · 22 Jul 2026
- S11Consolidated results XBRL Q4 FY26 and FY26 (integrated filing) · NSE (XBRL) · Tier 1: company or exchange filing · 24 Apr 2026
- S12Consolidated results XBRL Q3 FY26 (integrated filing) · NSE (XBRL) · Tier 1: company or exchange filing · 23 Jan 2026
- S13Consolidated results XBRL Q2 FY26 (revised integrated filing, 27 Jan 2026) · NSE (XBRL) · Tier 1: company or exchange filing · 27 Jan 2026
- S14Earnings presentation H1 FY27 (consolidated financial performance) · NSE (company filing, nsearchives.nseindia.com) · Tier 1: company or exchange filing · 21 Oct 2026
- S15Earnings presentation Q1 FY27 · NSE (company filing, nsearchives.nseindia.com) · Tier 1: company or exchange filing · 22 Jul 2026
- S16Earnings presentation FY26 (operational and financial highlights) · NSE (company filing, nsearchives.nseindia.com) · Tier 1: company or exchange filing · 24 Apr 2026
- S18Transcript of Q2 FY27 earnings call (held 22 Oct 2026) · NSE (company filing, nsearchives.nseindia.com) · Tier 1: company or exchange filing · 26 Oct 2026
- S19Transcript of Q1 FY27 earnings call (held 22 Jul 2026) · NSE (company filing, nsearchives.nseindia.com) · Tier 1: company or exchange filing · 27 Jul 2026
- S20Transcript of Q4 FY26 equity earnings call (held 24 Apr 2026) · NSE (company filing, nsearchives.nseindia.com) · Tier 1: company or exchange filing · 28 Apr 2026
- S21Transcript of Q3 FY26 earnings call (held 23 Jan 2026; NSE letter of 30 Jan 2026 links to this file) · Adani Green Energy (company website) · Tier 1: company or exchange filing · 30 Jan 2026
- S22CareEdge Ratings press release: Adani Green Energy Ltd, bank facilities CARE AA; Stable / CARE A1+ reaffirmed (3 Sep 2026) · CARE Ratings · Tier 2: rating agency or regulator · 3 Sep 2026
- S23Credit rating intimation: India Ratings places IND AA- on Rating Watch Negative · NSE (company filing, nsearchives.nseindia.com) · Tier 1: company or exchange filing · 26 Nov 2024
- S25Credit rating intimation: India Ratings affirms IND AA-/Stable, watch resolved · NSE (company filing, nsearchives.nseindia.com) · Tier 1: company or exchange filing · 5 May 2025
- S27Business Responsibility and Sustainability Report FY26 · NSE (company filing, nsearchives.nseindia.com) · Tier 1: company or exchange filing · 29 May 2026
- S28Shareholding pattern Q2 FY27 (quarter to 2026-09), XBRL · NSE (XBRL) · Tier 1: company or exchange filing · 3 Oct 2026
- S29Shareholding pattern Q1 FY27 (quarter to 2026-06), XBRL · NSE (XBRL) · Tier 1: company or exchange filing · 8 Jul 2026
- S30Shareholding pattern Q4 FY26 (quarter to 2026-03), XBRL · NSE (XBRL) · Tier 1: company or exchange filing · 3 Apr 2026
- S31Shareholding pattern Q3 FY26 (quarter to 2025-12), XBRL · NSE (XBRL) · Tier 1: company or exchange filing · 16 Jan 2026
- S32Shareholding pattern Q2 FY26 (quarter to 2025-09), XBRL · NSE (XBRL) · Tier 1: company or exchange filing · 9 Oct 2025
- S33Shareholding pattern Q1 FY26 (quarter to 2025-06), XBRL · NSE (XBRL) · Tier 1: company or exchange filing · 21 Jul 2025
- S34Shareholding pattern Q4 FY25 (quarter to 2025-03), XBRL · NSE (XBRL) · Tier 1: company or exchange filing · 9 Apr 2025
- S35Shareholding pattern Q3 FY25 (quarter to 2024-12), XBRL · NSE (XBRL) · Tier 1: company or exchange filing · 10 Jan 2025
- S36Shareholding pattern Q2 FY25 (quarter to 2024-09), XBRL · NSE (XBRL) · Tier 1: company or exchange filing · 4 Oct 2024
- S37Shareholding pattern Q1 FY25 (quarter to 2024-06), XBRL · NSE (XBRL) · Tier 1: company or exchange filing · 16 Jul 2024
- S38Shareholding pattern Q4 FY24 (quarter to 2024-03), XBRL · NSE (XBRL) · Tier 1: company or exchange filing · 10 Apr 2024
- S39Shareholding pattern Q3 FY24 (quarter to 2023-12), XBRL · NSE (XBRL) · Tier 1: company or exchange filing · 13 Jan 2024
- S40USD bond offering intimation by subsidiaries (AHEJ One, AHEJ Two, ASEJ One) · NSE (company filing, nsearchives.nseindia.com) · Tier 1: company or exchange filing · 18 Nov 2024
- S41Update: US DOJ indictment and US SEC civil complaint against directors; subsidiaries not proceeding with USD bonds · NSE (company filing, nsearchives.nseindia.com) · Tier 1: company or exchange filing · 21 Nov 2024
- S42Clarification on news item (CNBC-TV18, 21 Nov 2024): no allegations against the Company; group media release · NSE (company filing, nsearchives.nseindia.com) · Tier 1: company or exchange filing · 21 Nov 2024
- S43Reg 30 intimation with litigation details (Cr. No. 24-CR-433; 1:24 Civ. 8080) · NSE (company filing, nsearchives.nseindia.com) · Tier 1: company or exchange filing · 27 Nov 2024
- S44Clarification on media articles: directors not charged under FCPA · NSE (company filing, nsearchives.nseindia.com) · Tier 1: company or exchange filing · 27 Nov 2024
- S53Further update on US matter: request for consent final judgment in SEC case (civil penalties USD 6 mn / 12 mn) · NSE (company filing, nsearchives.nseindia.com) · Tier 1: company or exchange filing · 15 May 2026
- S54Further update on US matter: DOJ motion to dismiss indictment with prejudice · NSE (company filing, nsearchives.nseindia.com) · Tier 1: company or exchange filing · 18 May 2026
- S55Further update on US matter: indictment dismissed with prejudice (order 10 Aug 2026) · NSE (company filing, nsearchives.nseindia.com) · Tier 1: company or exchange filing · 11 Aug 2026
- S56Further update on US matter: SEC final judgment on consent entered 10 Aug 2026 · NSE (company filing, nsearchives.nseindia.com) · Tier 1: company or exchange filing · 11 Aug 2026
- S57Reg 30 disclosure: SEBI settlement order (Reg 33(1)(d)), settlement amount Rs 45,50,000 · NSE (company filing, nsearchives.nseindia.com) · Tier 1: company or exchange filing · 22 Sep 2026
- S58Notice of EGM 16 Nov 2026: material RPTs with Adani New Industries and Mundra Solar Energy; borrowing limit · NSE (company filing, nsearchives.nseindia.com) · Tier 1: company or exchange filing · 23 Oct 2026
- S59NSE historical price data, ADANIGREEN EQ, 1-12 Nov 2026 (close 11 Nov 2026) · NSE (nseindia.com historical data) · Tier 1: company or exchange filing · 11 Nov 2026
Changes to this page (v1 · 12 Nov 2026)
- v1 · 12 Nov 2026First version. (first version)
Numbers come only from tier 1 and tier 2 sources. Read how we research.
Disclaimer
For learning only. Cityfort is not a SEBI-registered adviser and does not recommend buying or selling any security. Prices shown are dated and may be out of date.
Investing in securities involves risk, including loss of capital. Before making any investment decision, do your own research and consider consulting a SEBI-registered investment adviser.
Cityfort, its owners and contributors may or may not hold securities of companies covered. Content is not an offer or solicitation to buy or sell any security.
Read the full disclaimerHide the full disclaimer
Cityfort publishes educational content that explains how listed companies work. Cityfort is not registered with the Securities and Exchange Board of India (SEBI) as an Investment Adviser or Research Analyst and does not provide investment advice, recommendations, ratings, price targets or any opinion on whether to buy, sell or hold any security.
All information is taken from publicly available sources, mainly company filings on BSE and NSE, which are listed on each page with dates. We work to keep it accurate and correct errors publicly, but we do not guarantee that it is complete, accurate or up to date. Any market price or price-based ratio shown is dated, may be out of date by the time you read it, and is included only to explain concepts.
Statements by company management are reported as statements, with their date and source; they are not our forecasts.