Information Technology · NSE: NETWEB · BSE: 543945
Netweb Technologies: how the business works
Netweb Technologies designs and builds supercomputers, AI servers and private-cloud systems under its Tyrone brand near Delhi, and earned ₹2,184 crore of revenue in FY26.
Follow Netweb Technologies
Email me when Netweb Technologies's page is updated after results.
We store your email address with Kit, our email provider, which also records when you sign up and whether you open or click our emails. We send a confirmation email first. See our privacy policy.
Netweb Technologies India Ltd · Faridabad, Haryana · Founded 1999
Updated for Q2 FY27 · checked
- Revenue, FY26
- ₹2,184 cr
- Net profit, FY26
- ₹206 cr
- Order book (confirmed orders not yet delivered), 30 Sep 2026
- ₹2,629 cr
- Founded
- 1999
- Promoters (four Lodha promoters and group), Sep 2026
- 64.16%
The short version
Netweb Technologies in 5 points
1 · What it sells
Netweb Technologies designs and builds supercomputers, AI servers and private-cloud systems under its Tyrone brand, and its FY26 revenue from operations was ₹2,184 crore.
2 · Who pays it
In FY26, customers in India paid 98.6% of Netweb Technologies' revenue and customers outside India 1.4% (Cityfort calculation from the FY26 annual report).
3 · What it keeps from ₹100
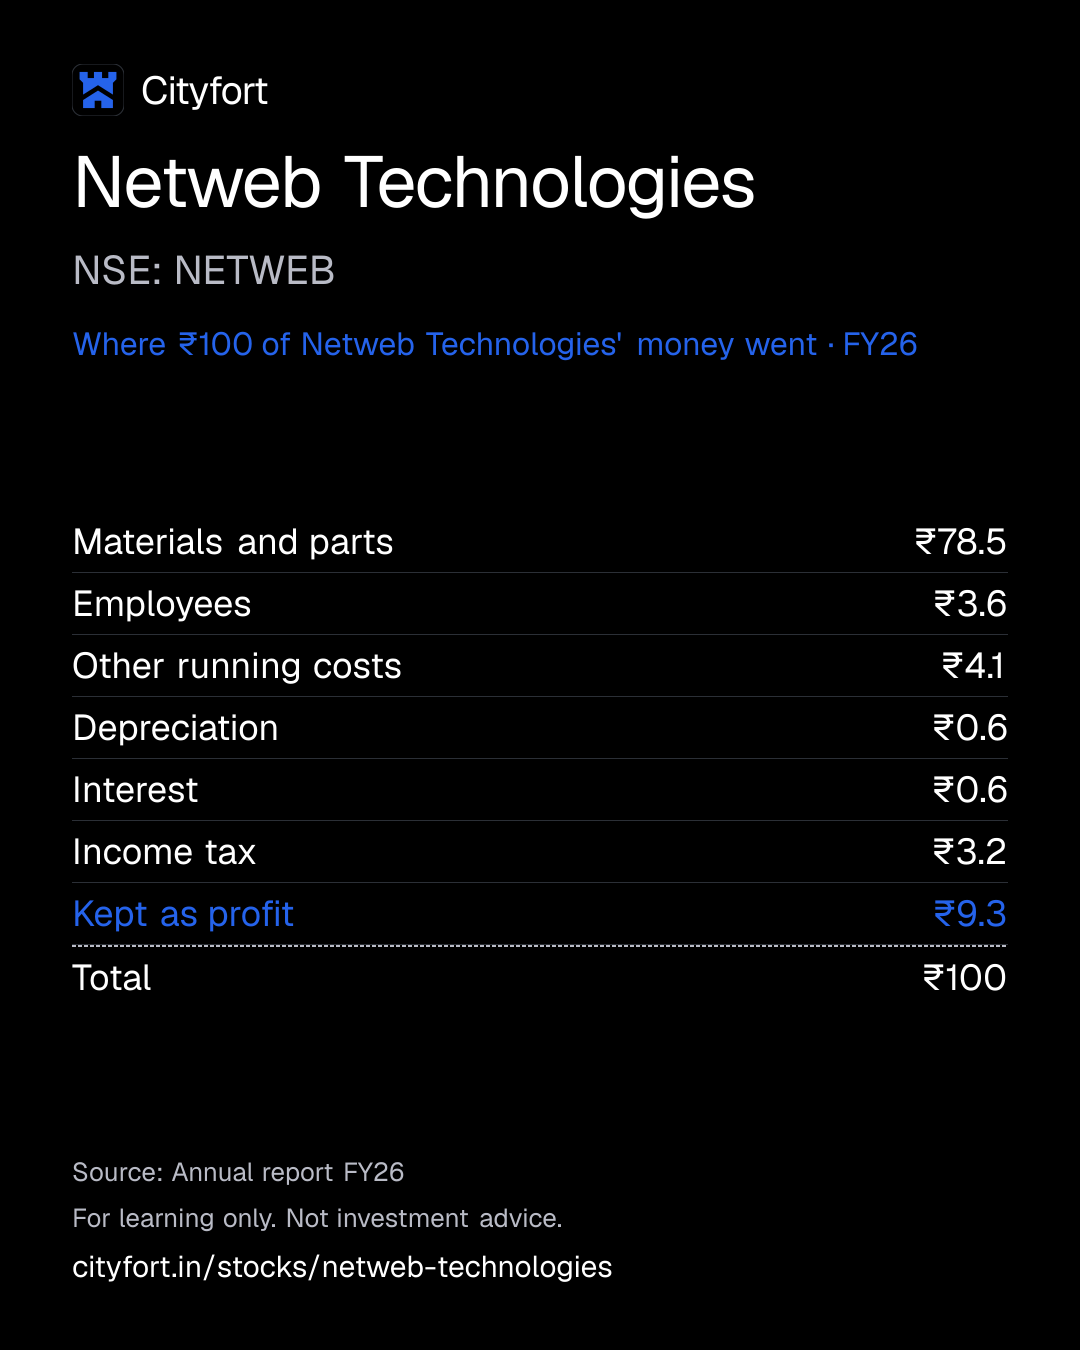
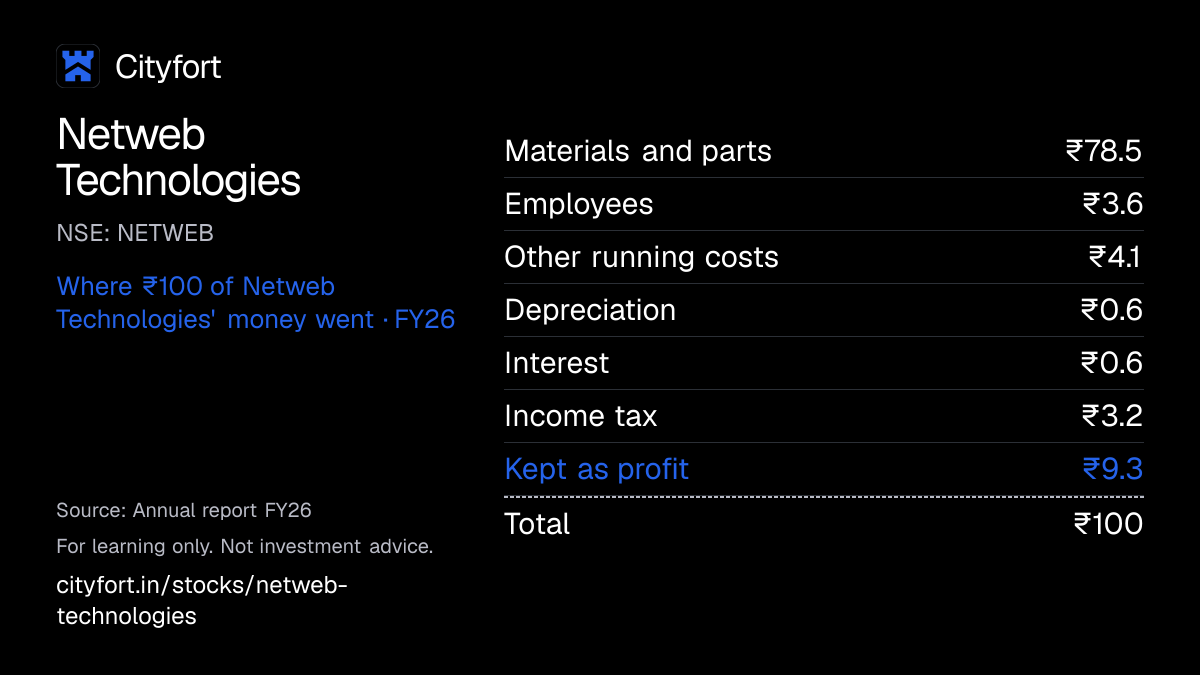
Of every ₹100 that came in during FY26, Netweb Technologies kept ₹9.3 as profit after ₹78.5 for materials and parts, and ₹0.9 of the ₹100 was other income outside its operations.
4 · Where the operating profit comes from
Netweb Technologies reports one business segment, computer servers, and no profit by product line; AI systems brought in 43.4% of FY26 revenue by its own product split, and EBITDA was 13.0% of revenue.
5 · The one thing to watch
Netweb Technologies' inventory rose to ₹1,931 crore on 30 Sep 2026 from ₹805 crore on 31 Mar 2026, and H1 FY27 operating cash flow was an outflow of ₹639 crore against net profit of ₹222 crore.
Sources: From Netweb Technologies' FY26 annual report, its July 2023 prospectus, its FY26 and Q2 FY27 results and its company presentations · checked
Sources (6)
- Annual Report FY2025-26 (standalone financial statements, BRSR section)
- Earnings presentation, Q2 FY27 (October 2026)
- Press release, Q4 FY26 and FY26 results
- Earnings presentation, Q4 FY26 (May 2026)
- Integrated filing (financials) XBRL, quarter ended 30 Sep 2026
- Integrated filing (financials) XBRL, quarter and year ended 31 Mar 2026 (revised 16 May 2026: reporting type)
01Where the money goes · FY26
Where does ₹100 of Netweb Technologies' money go?
Netweb Technologies · FY26
Receipt for every ₹100
| Materials and parts | ₹78.5 |
|---|---|
| Employees | ₹3.6 |
| Other running costs | ₹4.1 |
| Depreciation | ₹0.6 |
| Interest | ₹0.6 |
| Income tax | ₹3.2 |
| Kept as profit | ₹9.3 |
| Total | ₹100 |
Each line = amount ÷ total money in × 100. Lines may not add to exactly ₹100 because of rounding.
How this is worked out
Of every ₹100 that came in during FY26: revenue (₹2,183.6 crore) and other income (₹18.8 crore, or ₹0.9 of the ₹100). Materials include the change in inventories. Cityfort calculation from the FY26 annual report; lines add to ₹99.9 because of rounding.
Save this receipt as an image
Embed this receipt or the key numbers
Paste this code into a blog or website to show the card you choose, with a link back to this page.
Each week: the next company due to report results, explained in 5 points.
We'll email you once a week with what changed on Cityfort. Facts only, no tips. Unsubscribe any time.
We store your email address with Kit, our email provider, which also records when you sign up and whether you open or click our emails. We send a confirmation email first. See our privacy policy.
02The business in one line
What does Netweb Technologies do?
Research bodies, government agencies, IT companies and data-centre firms pay Netweb to build powerful computer systems; ₹78.5 of every ₹100 that came in during FY26 went on materials and parts, and ₹9.3 was left as profit.
- In FY26, AI systems brought in ₹947.8 crore, or 43.4% of revenue, supercomputing systems ₹530.8 crore and private cloud ₹517.0 crore, by the company's own product split.
- Customers in India paid 98.6% of FY26 revenue. Revenue swings with large orders: Q3 FY26 revenue of ₹805 crore included ₹450 crore from one large order.
03Who pays it
Who pays Netweb Technologies?
Netweb Technologies does not disclose how much each type of customer pays.
Government, research and academic bodies
Supercomputers and AI systems for bodies such as ISRO, the IITs, the University of Delhi and RailTel, named by CRISIL. The prospectus says most government contracts are won through tenders.
Companies and IT firms
Servers, storage and private-cloud systems for companies such as Infosys, TCS and Zoho, named by CRISIL.
Data-centre and cloud operators
GPU systems for AI computing for operators such as Yotta, named by CRISIL.
Technology distributors
Each of the two Sep 2025 AI server orders, of about ₹1,734 crore and ₹450 crore, came from a buyer the filings describe as one of the largest Indian-headquartered global providers of technology distribution and integrated supply chain solutions.
Where its revenue came from · FY26
- India (Cityfort calculation from the FY26 annual report)98.6%
- Outside India1.4%
Customer concentration
Netweb does not name its customers or give each one's share. In FY26 its five largest customers gave 62.2% of revenue and its ten largest 76.4% (company presentation), and three customers each gave at least 10% (annual report). Customers in India paid 98.6% of FY26 revenue (Cityfort calculation from the FY26 annual report).
- Top 5 customers
- 62%
- Top 10 customers
- 76%
Sources (6)
- CRISIL Ratings rationale: Crisil A+/Stable/Crisil A1 reaffirmed, bank limits enhanced to Rs 2,420 crore (filed with intimation)
- Red Herring Prospectus dated 10 Jul 2023 (restated financial information FY21-FY23)
- Order intimation: Rs 1,734 crore purchase order for Nvidia Blackwell-based servers
- Order intimation: Rs 450 crore purchase order for Tyrone AI GPU-accelerated systems
- Earnings presentation, Q4 FY26 (May 2026)
- Annual Report FY2025-26 (standalone financial statements, BRSR section)
04How it makes money
How does Netweb Technologies make money?
Volume of orders, at a steady margin on bought-in parts, decides the profit.
Netweb buys processors, GPUs and other parts, then designs, builds and supports complete systems. Materials and parts took ₹78.5 of every ₹100 that came in during FY26. EBITDA was 13.0% of revenue in FY26 and 14.0% in FY22, while revenue grew from ₹247 crore to ₹2,184 crore.
EBITDA per ₹100 of revenue (Cityfort calculation from the 2023 prospectus and the FY26 annual report)
₹14₹13
FY22 to FY26
- A research body, company or distributor orders systems, often after a tender.
- Netweb designs the setup and buys processors, GPUs and other parts, many imported.
- Its plants near Delhi assemble and test the Tyrone systems.
- It delivers, installs and supports them, often with its own software.
- Customers pay; large orders need inventory and bank lines before the cash comes in.
↺ Step 5 feeds back into step 1.
05Business segments · FY26
Which businesses make up Netweb Technologies?
AI systems
43.4%GPU servers for AI. This is the company's own product split from its presentations, not an accounting segment: the accounts show one segment, computer servers, and no profit by product. FY26 includes ₹558.8 crore from one strategic order.
Revenue ₹948 cr
Supercomputing (HPC)
24.3%Clusters of linked servers for research and engineering work.
Revenue ₹531 cr
Private cloud and HCI
23.7%Companies' own clouds: servers, storage and software combined.
Revenue ₹517 cr
Software, services, spares and others
5.6%Software, support services and spare parts.
Revenue ₹123 cr
High-performance storage
1.5%Fast storage systems for large data.
Revenue ₹32.8 cr
Data-centre servers
1.5%Standard servers for data centres.
Revenue ₹32.1 cr
How the mix changed
- AI systems
- Supercomputing (HPC)
- Private cloud and HCI
- Software, services, spares and others
- High-performance storage
- Data-centre servers
Revenue by segment, FY24 to FY26.
₹ crore
See the numbers
06The numbers · Standalone (no material subsidiaries) · ₹ crore
How has Netweb Technologies done?
Revenue
₹2,184 crFY26
Revenue rose every year, from ₹247 crore in FY22 (restated, from the 2023 prospectus) to ₹2,184 crore in FY26; Q3 FY26 revenue of ₹805 crore included ₹450 crore from one large order.
₹ crore
See the numbers
Net profit
₹206 crFY26
Net profit rose from ₹22.45 crore in FY22 to ₹206 crore in FY26; FY25, Q3 FY25 and Q4 FY25 are restated for the change in how inventory is valued from 1 Apr 2025, while FY22–FY24 are not restated.
₹ crore
See the numbers
Net profit for every ₹100 of revenue
₹9.4FY26
EBITDA per ₹100 of revenue (Cityfort calculation; no exceptional items in any year shown) was ₹15.7 in FY23 and ₹13.0 in FY26, and ₹14.9 in Q2 FY27 against ₹15.0 in Q2 FY26.
Net margin: ₹ of net profit per ₹100 of revenue
See the numbers
Free cash flow
₹160 crFY26
Operating cash flow was an outflow of ₹13.2 crore in FY25, an inflow of ₹171 crore in FY26 and an outflow of ₹639 crore in H1 FY27, when inventory rose by ₹1,126 crore.
₹ crore · cash from operations minus spending on plants and equipment
See the numbers
See all yearly numbers
EBITDA = profit before interest, tax and wear-and-tear of assets. Financial year runs April to March (March year end). Net profit is the share belonging to the company's owners.
Sources (15)
- Red Herring Prospectus dated 10 Jul 2023 (restated financial information FY21-FY23)
- Annual Report FY2023-24
- Financial results XBRL, quarter and year ended 31 Mar 2024
- Annual Report FY2025-26 (standalone financial statements, BRSR section)
- Integrated filing (financials) XBRL, quarter and year ended 31 Mar 2026 (revised 16 May 2026: reporting type)
- Press release, Q3 FY26 results
- Unaudited results, quarter ended 31 Dec 2025 (scanned PDF; restatement note 3)
- Press release, Q4 FY26 and FY26 results
- Audited results, quarter and year ended 31 Mar 2026 (scanned PDF)
- Integrated filing (financials) XBRL, quarter and year ended 31 Mar 2025 (revised 9 May 2025: reporting type; pre-restatement figures)
- Integrated filing (financials) XBRL, quarter ended 30 Jun 2025
- Integrated filing (financials) XBRL, quarter ended 30 Sep 2025
- Integrated filing (financials) XBRL, quarter ended 31 Dec 2025
- Integrated filing (financials) XBRL, quarter ended 30 Jun 2026
- Integrated filing (financials) XBRL, quarter ended 30 Sep 2026
07Who runs it
Who runs Netweb Technologies, and did they deliver?
Sanjay Lodha
Chairman and Managing Director
Promoter holding 25.46% of the company at 30 Sep 2026. Re-appointed for five years from 14 Aug 2026.
Navin Lodha
Whole-time Director
Promoter holding 12.82% at 30 Sep 2026. Re-appointed for five years from 14 Aug 2026.
Niraj Lodha
Whole-time Director
Promoter holding 12.82% at 30 Sep 2026. Re-appointed for five years from 14 Aug 2026.
Vivek Lodha
Whole-time Director
Promoter holding 12.82% at 30 Sep 2026. Re-appointed for five years from 14 Aug 2026.
Ankit Kumar Singhal
Chief Financial Officer · since 2024
CFO from 15 Nov 2024, after Prawal Jain, who was CFO up to 14 Nov 2024.
What they said, and what happened
4 too early to tell
Said on 3 Sep 2025
Execute the order of about ₹1,734 crore for Nvidia Blackwell-based servers by the first half of FY27 (order filing).
Too early to tellWhat happened
The first half of FY27 ended on 30 Sep 2026. The company has not reported separately how much of this order it delivered; AI systems revenue was ₹1,283.6 crore in H1 FY27.
Said on 19 Sep 2025
Execute the order of about ₹450 crore for Tyrone AI GPU systems by the end of FY26 (order filing).
Too early to tellWhat happened
The company reported executing ₹450.39 crore of a large strategic order in Q3 FY26, but did not say whether it was this order.
Said on 4 May 2026
Revenue growth of 35–40% and operating EBITDA margins of 13–14% for the next couple of years (CFO Ankit Kumar Singhal, Q4 FY26 call).
Too early to tellWhat happened
H1 FY27 revenue was ₹2,143 crore, against ₹604.9 crore in H1 FY26. EBITDA was 14.7% of revenue in Q1 FY27 and 14.9% in Q2 FY27 (Cityfort calculation from the results).
Said on 26 Oct 2026
"Targeting to achieve INR4,000 crores of revenue this particular financial year" (Chairman and MD Sanjay Lodha, Q2 FY27 call, about FY27).
Too early to tellWhat happened
Revenue was ₹2,143 crore in H1 FY27 (Apr–Sep 2026).
Sources (13)
- Annual Report FY2025-26 (standalone financial statements, BRSR section)
- Shareholding pattern (XBRL), quarter ended Sep 2026
- Postal ballot result: re-appointment of Sanjay, Navin, Niraj and Vivek Lodha for 5 years from 14 Aug 2026
- Order intimation: Rs 1,734 crore purchase order for Nvidia Blackwell-based servers
- Earnings presentation, Q2 FY27 (October 2026)
- Order intimation: Rs 450 crore purchase order for Tyrone AI GPU-accelerated systems
- Press release, Q3 FY26 results
- Q4 FY26 earnings call transcript (call 4 May 2026)
- Integrated filing (financials) XBRL, quarter ended 30 Sep 2026
- Integrated filing (financials) XBRL, quarter ended 30 Jun 2026
- Integrated filing (financials) XBRL, quarter ended 30 Sep 2025
- Integrated filing (financials) XBRL, quarter ended 30 Jun 2025
- Q2 FY27 earnings call transcript (call 26 Oct 2026)
08What could go wrong
What could go wrong for Netweb Technologies?
- Concentration
A few customers bring in most of the revenue
The five largest customers gave 62.2% of FY26 revenue and the ten largest 76.4%, up from 50.8% and 65.8% in FY25. Three customers each gave at least 10% of FY26 revenue.
Watch The top-five customer share in the FY27 annual presentation.
- Demand
Revenue swings with large orders
Q3 FY26 revenue was ₹805 crore, against ₹304 crore in Q2 FY26, and included ₹450 crore from one large order. The order book moved from ₹472.4 crore at 31 Mar 2026 to ₹2,629.0 crore at 30 Sep 2026.
Watch The order book each quarter, and new order filings with the exchanges.
- Cash and liquidity
Cash tied up in inventory
Inventory was ₹1,931 crore at 30 Sep 2026, against ₹805 crore at 31 Mar 2026. Operating cash flow was an outflow of ₹639 crore in H1 FY27, against net profit of ₹222 crore, and an outflow of ₹13.2 crore in FY25.
Watch Operating cash flow for FY27, and the cash conversion cycle the CFO said in the Q2 FY27 call (26 Oct 2026) will run between 90 and 110 days (94 days at 30 Sep 2026).
- Raw-material prices
Reliance on a few chip and part suppliers
CRISIL says the top three suppliers give 65–70% of purchases and a significant share of components is imported from Taiwan. Materials and parts took ₹78.5 of every ₹100 that came in during FY26.
Watch Materials cost per ₹100 of revenue in each annual report.
- Competition
Tenders and competition from global makers
The prospectus says most government contracts are won through tenders, and competitors may have greater resources. CRISIL says intense competition could lead to pricing pressure.
Watch EBITDA margin each quarter: 14.9% in Q2 FY27, against 15.0% in Q2 FY26.
- Pricing
Lower margins than in FY23
EBITDA was 15.7% of revenue in FY23 and 13.0% in FY26. The CFO guided 13–14% operating EBITDA margins for the next couple of years in the Q4 FY26 call (4 May 2026).
Watch FY27 EBITDA margin against the 13–14% range the CFO gave.
Sources (14)
- Earnings presentation, Q4 FY26 (May 2026)
- Annual Report FY2025-26 (standalone financial statements, BRSR section)
- Integrated filing (financials) XBRL, quarter ended 31 Dec 2025
- Integrated filing (financials) XBRL, quarter ended 30 Sep 2025
- Press release, Q3 FY26 results
- Press release, Q4 FY26 and FY26 results
- Earnings presentation, Q2 FY27 (October 2026)
- Integrated filing (financials) XBRL, quarter ended 30 Sep 2026
- Integrated filing (financials) XBRL, quarter and year ended 31 Mar 2026 (revised 16 May 2026: reporting type)
- Q2 FY27 earnings call transcript (call 26 Oct 2026)
- CRISIL Ratings rationale: Crisil A+/Stable/Crisil A1 reaffirmed, bank limits enhanced to Rs 2,420 crore (filed with intimation)
- Red Herring Prospectus dated 10 Jul 2023 (restated financial information FY21-FY23)
- Annual Report FY2023-24
- Q4 FY26 earnings call transcript (call 4 May 2026)
09Supporters and critics
What do supporters and critics point to?
What supporters point to
- Revenue rose every year from ₹247 crore in FY22 to ₹2,184 crore in FY26, and Q2 FY27 revenue was ₹1,323 crore, up 335.7% from a year earlier.
- The order book was ₹2,629.0 crore at 30 Sep 2026, against ₹472.4 crore at 31 Mar 2026.
- Cash and bank balances were ₹1,124 crore against borrowings of ₹321 crore at 30 Sep 2026 (Cityfort calculation from the Q2 FY27 results).
- CRISIL reaffirmed its A+/Stable rating on 10 Jun 2026 and rated ₹2,420 crore of bank facilities, up from ₹700 crore.
- No promoter shares were pledged in any quarter from Dec 2023 to Sep 2026.
What critics point to
- The five largest customers gave 62.2% of FY26 revenue.
- Operating cash flow was an outflow of ₹639 crore in H1 FY27, against net profit of ₹222 crore, and inventory reached ₹1,931 crore.
- EBITDA was 15.7% of revenue in FY23 and 13.0% in FY26.
- The promoters sold shares in Aug 2024 and Feb 2026; their holding went from 75.04% in Mar 2024 to 64.16% in Sep 2026, partly through the Aug 2026 placement.
- CRISIL says the top three suppliers give 65–70% of purchases, with a significant share of components imported from Taiwan.
10What to watch next
What should you watch next at Netweb Technologies?
Next event
Q3 FY27 results
Date not announced yet.
Orders turning into revenue
The order book was ₹2,629.0 crore at 30 Sep 2026. The company also counted ₹652.5 crore of bids where it was the lowest bidder but had no order yet.
Inventory and cash flow
Inventory was ₹1,931 crore at 30 Sep 2026. The CFO said in the Q2 FY27 call (26 Oct 2026) the cash conversion cycle will run between 90 and 110 days; it was 94 days at 30 Sep 2026.
Taiwan subsidiary
The board approved a proposed Taiwan subsidiary on 24 Oct 2026; incorporation had not been initiated as of that filing. At 31 Mar 2026 the only subsidiary was a CSR company that is not consolidated, so the figures are standalone.
11Key facts
Key facts about Netweb Technologies
- What does Netweb Technologies do?
- Netweb Technologies designs, builds and supports high-end computer systems under its Tyrone brand: supercomputers, GPU servers for AI and private-cloud systems. Netweb Technologies had revenue of ₹2,184 crore in FY26, almost all of it from customers in India.
- How does Netweb Technologies make money?
- Netweb Technologies sells computer systems it builds from bought-in processors, GPUs and other parts. In FY26 AI systems brought in ₹947.8 crore (43.4% of revenue), supercomputing systems ₹530.8 crore and private cloud and HCI systems ₹517.0 crore, by Netweb Technologies' own product split; the accounts show a single segment, computer servers.
- Who are Netweb Technologies' customers?
- CRISIL names ISRO, the IITs, the University of Delhi, RailTel, Infosys, TCS, Zoho and Yotta among Netweb Technologies' customers. Netweb Technologies' five largest customers gave 62.2% of FY26 revenue and its ten largest 76.4%.
- How big is Netweb Technologies?
- Netweb Technologies' revenue was ₹2,184 crore in FY26 and net profit ₹206 crore, against ₹1,149 crore and ₹113.75 crore (restated) in FY25. Netweb Technologies reports standalone figures because its only subsidiary is a CSR foundation that is not consolidated.
- Who owns Netweb Technologies?
- The promoter group led by Sanjay, Navin, Niraj and Vivek Lodha owned 64.16% of Netweb Technologies on 30 Sep 2026, with no shares pledged. Foreign investors held 9.47%, Indian institutions 7.22% and other shareholders 19.15% of Netweb Technologies.
- What were Netweb Technologies' latest quarterly results?
- Netweb Technologies' revenue was ₹1,323 crore in Q2 FY27 (Jul–Sep 2026), against ₹304 crore in Q2 FY26, and net profit was ₹137 crore against ₹31.4 crore.
- What is Netweb Technologies' order book?
- Netweb Technologies' order book, the value of confirmed purchase orders not yet delivered, was ₹2,629.0 crore on 30 Sep 2026, against ₹472.4 crore on 31 Mar 2026.
- When did Netweb Technologies list, and has it raised money since?
- Netweb Technologies listed on NSE and BSE on 27 Jul 2023. In Aug 2026 Netweb Technologies raised ₹1,200 crore by selling 2,505,219 new shares to institutions at ₹4,790 each (qualified institutions placement, allotted 20 Aug 2026), mainly to fund working capital.
- Does Netweb Technologies have debt?
- Netweb Technologies had borrowings of ₹321 crore and cash and bank balances of ₹1,124 crore on 30 Sep 2026 (Cityfort calculation from the Q2 FY27 results). Netweb Technologies' inventory was ₹1,931 crore on the same date.
Sources (12)
- Annual Report FY2025-26 (standalone financial statements, BRSR section)
- Earnings presentation, Q2 FY27 (October 2026)
- Earnings presentation, Q4 FY26 (May 2026)
- Press release, Q4 FY26 and FY26 results
- CRISIL Ratings rationale: Crisil A+/Stable/Crisil A1 reaffirmed, bank limits enhanced to Rs 2,420 crore (filed with intimation)
- Shareholding pattern (XBRL), quarter ended Sep 2026
- Integrated filing (financials) XBRL, quarter ended 30 Sep 2026
- Integrated filing (financials) XBRL, quarter ended 30 Sep 2025
- Press release, Q2 FY27 results
- Annual Report FY2023-24
- QIP: outcome of fund-raising committee, allotment of 25,05,219 shares at Rs 4,790 (Rs 1,200 crore)
- Monitoring agency report on QIP proceeds, quarter ended 30 Sep 2026
Terms on this page
- Capital expenditure (capex)
- Credit rating
- Customer concentration
- EBITDA
- FII and DII holding
- Free cash flow
- Market capitalisation
- Net debt
- Net profit
- Operating margin
Each explains the term in plain English, with the same number from other companies on Cityfort.
Go deeper
More detail from the same filings. Open any section.
12What it sells
12What it sells
What does Netweb Technologies sell?
AI systems
Servers packed with GPUs (graphics processors) that train and run AI models, built with Nvidia as an OEM partner. ₹947.8 crore of FY26 revenue, 43.4% of the total, up 459.6% from FY25.
Supercomputing (HPC) systems
Clusters of many linked servers that solve large scientific and engineering problems, mainly for research labs and universities. ₹530.8 crore of FY26 revenue; the company says it has installed more than 600 such systems.
Private cloud and HCI
A company's own cloud inside its data centre: servers, storage and Netweb's Skylus software combined (hyper-converged infrastructure, HCI). ₹517.0 crore of FY26 revenue.
High-performance storage
Fast storage systems for large data, such as Tyrone ParallelStor. ₹32.8 crore of FY26 revenue.
Data-centre servers
Standard servers for data centres. ₹32.1 crore of FY26 revenue.
Software, services, spares and others
₹123.2 crore of FY26 revenue, of which software and services ₹51.4 crore.
Think of it like this
Like a custom PC builder on a much larger scale: it buys processors and graphics chips from makers such as Nvidia, AMD and Intel, then designs, assembles, tests and supports complete systems.
What it does
- Does: Designs and assembles its own Tyrone systems in plants in the Delhi region, including a server plant at IMT Faridabad that started commercial production on 10 May 2024
- Does: Writes software that runs on its systems, such as the Skylus private-cloud stack
- Does: Sells almost only in India: ₹30.5 crore of FY26 revenue came from outside India
What it does not do
- Does not: Does not make processors or GPUs: it buys them from partners such as Nvidia, AMD and Intel
- Does not: Is not mainly a software or IT services company, despite its NSE industry tag: software and services were ₹51.4 crore of FY26 revenue
- Does not: Has no operating subsidiaries: its only subsidiary is Netweb Foundation, a not-for-profit CSR company that is not consolidated, so all figures are standalone
- Does not: Had not started setting up its proposed Taiwan subsidiary as of the 24 Oct 2026 board filing that approved the proposal
13How the money flows
13How the money flows · FY26
How does money flow through Netweb Technologies?
Money in
- Revenue from operations₹2,184 cr
- Other income₹18.8 cr
The company
Netweb Technologies
₹2,202 cr came in
Money out
- Materials and parts (incl. change in inventories)₹1,728 cr
- Employee costs₹80.3 cr
- Other running costs₹90.2 cr
- Depreciation₹14.2 cr
- Interest₹13 cr
- Income tax₹70.7 cr
- Net profit₹206 cr
- In FY26 Netweb's sales brought in ₹2,184 crore, plus ₹18.8 crore of other income.
- Materials and parts took ₹1,728 crore, the biggest cost.
- Employees took ₹80 crore and other running costs ₹90 crore.
- Depreciation took ₹14 crore and interest ₹13 crore.
- After ₹71 crore of tax, ₹206 crore was left as profit.
14What it needs to run
14What it needs to run
What does Netweb Technologies need to run?
Plants near Delhi
Two plants and 16 offices in India at 31 Mar 2026, the BRSR says. The server plant at IMT Faridabad started commercial production on 10 May 2024. The company does not disclose plant capacity.
Bought-in chips and parts
CRISIL says the top three suppliers give 65–70% of purchases, and a significant share of components is imported from Taiwan. Partners include Nvidia, AMD, Intel and Samsung.
Engineers
665 employees at 31 Mar 2026. At 30 Sep 2026 the company counted 380 engineers and a research and development team of 128.
Working capital and bank lines
Large orders need parts bought and paid for before delivery. CRISIL rated ₹2,420 crore of bank facilities on 10 Jun 2026, up from ₹700 crore, and ₹970.50 crore of the Aug 2026 share sale was set aside for working capital.
Sources (6)
- Business Responsibility and Sustainability Report FY2025-26
- Commencement of commercial production at the Faridabad IMT server plant (10 May 2024)
- CRISIL Ratings rationale: Crisil A+/Stable/Crisil A1 reaffirmed, bank limits enhanced to Rs 2,420 crore (filed with intimation)
- Earnings presentation, Q2 FY27 (October 2026)
- Annual Report FY2025-26 (standalone financial statements, BRSR section)
- Monitoring agency report on QIP proceeds, quarter ended 30 Sep 2026
15Where it sells
15Where it sells · FY26
Where does Netweb Technologies sell?
- India (Cityfort calculation from the FY26 annual report)98.6%
- Outside India1.4%
16Competitors and what protects it
16Competitors and what protects it
Who does Netweb Technologies compete with?
Hewlett Packard Enterprise (HPE)
Not listed in India. Named as a major player in supercomputing (HPC) and in private cloud and HCI in the industry section of Netweb's 2023 prospectus (Frost & Sullivan report commissioned by Netweb).
Dell Technologies
Not listed in India. Named as a major player in supercomputing (HPC) and in private cloud and HCI in the industry section of Netweb's 2023 prospectus (Frost & Sullivan report commissioned by Netweb).
Lenovo
Not listed in India. Named among major supercomputing (HPC) players and in the India HPC key-player table of Netweb's 2023 prospectus (Frost & Sullivan report commissioned by Netweb).
Atos
Not listed in India. Listed in the India HPC key-player table of Netweb's 2023 prospectus (Frost & Sullivan report commissioned by Netweb).
What protects the business
Each strength is scored 1 (weak) to 5 (strong) for the business, with the reason. It is not a rating of the share.
- In-house design, assembly and software3 of 5
Netweb designs and assembles its Tyrone systems in its own plants and writes software for them, such as the Skylus cloud stack; it had 128 people in research and development at 30 Sep 2026.
- Track record in supercomputers3 of 5
The company says it has installed more than 600 supercomputing systems, and three of its supercomputers have been listed 17 times in the global Top500 list. AIRAWAT at C-DAC Pune ranked 75th in June 2023.
- Access to chip makers2 of 5
Netweb is an Nvidia OEM partner and also works with AMD, Intel and Samsung; it does not make the chips itself.
Weak spot
Few large customers and suppliers
The five largest customers gave 62.2% of FY26 revenue. CRISIL says the top three suppliers give 65–70% of purchases, with a significant share of components imported from Taiwan.
Sources (5)
- Red Herring Prospectus dated 10 Jul 2023 (restated financial information FY21-FY23)
- Earnings presentation, Q2 FY27 (October 2026)
- Commencement of commercial production at the Faridabad IMT server plant (10 May 2024)
- Earnings presentation, Q4 FY26 (May 2026)
- CRISIL Ratings rationale: Crisil A+/Stable/Crisil A1 reaffirmed, bank limits enhanced to Rs 2,420 crore (filed with intimation)
17Where growth could come from
17Where growth could come from
Where could Netweb Technologies' growth come from?
Chairman and MD Sanjay Lodha said in the Q2 FY27 call (26 Oct 2026) that the company is "targeting to achieve INR4,000 crores of revenue this particular financial year". Earlier, in the Q4 FY26 call (4 May 2026), CFO Ankit Kumar Singhal said the company was guiding 35–40% revenue growth and 13–14% operating EBITDA margins for the next couple of years.
AI systems
Working₹773.1 crore in Q2 FY27, 58.4% of revenue
AI systems revenue was ₹947.8 crore in FY26, up 459.6%, including ₹558.8 crore from one strategic order. In H1 FY27 it was ₹1,283.6 crore, 59.9% of revenue.
Status: Working, on track against what the company said.
Order book
Working₹2,629.0 crore at 30 Sep 2026, against ₹472.4 crore at 31 Mar 2026
The order book was ₹2,506.9 crore at 30 Jun 2026. On 30 Sep 2026 the company also counted ₹652.5 crore of bids where it was lowest but had no order yet, and a ₹11,151.8 crore pipeline of further opportunities.
Status: Working, on track against what the company said.
Supercomputing and private cloud
Working₹530.8 crore and ₹517.0 crore in FY26
Supercomputing revenue rose from ₹405.5 crore in FY25 and private cloud from ₹402.7 crore. In Q2 FY27 they were ₹248.2 crore and ₹244.8 crore.
Status: Working, on track against what the company said.
Taiwan subsidiary
NewProposal approved by the board, 24 Oct 2026
A wholly owned subsidiary in Taiwan is proposed; the 24 Oct 2026 filing says incorporation had not yet been initiated. Management said in the Q2 FY27 call (26 Oct 2026) it will be used for research and development.
Status: New, recently announced.
Status compares progress with what the company itself said it would do: Working = on track against what the company said; Mixed = partly on track; Behind = behind the company's own plan; New = recently announced; Early = too early to judge.
Sources (7)
- Q2 FY27 earnings call transcript (call 26 Oct 2026)
- Q4 FY26 earnings call transcript (call 4 May 2026)
- Earnings presentation, Q2 FY27 (October 2026)
- Press release, Q4 FY26 and FY26 results
- Earnings presentation, Q4 FY26 (May 2026)
- Earnings presentation, Q1 FY27 (July 2026)
- Outcome of board meeting and unaudited results, quarter ended 30 Sep 2026 (incl. proposed Taiwan subsidiary)
18Financial strength and debt
18Financial strength · 30 Sep 2026
How much debt does Netweb Technologies have?
- Total debt₹321 cr
- Cash and investments₹1,124 cr
- Net cash (cash minus debt)₹803 cr
- Net worth (shareholders' money)₹2,104 cr
- Debt to equity
- 0.15×
- ₹ of debt for every ₹1 of shareholders' money
- Interest cover
- 22.3×
- how many times operating profit covers interest
- Contingent liabilities
- ₹137 cr
- possible future payments, e.g. disputed claims
- Net cash of ₹803 crore at 30 Sep 2026 is a Cityfort calculation from the Q2 FY27 results: cash and cash equivalents (₹333.33 crore) plus other bank balances (₹791.11 crore) minus borrowings (₹321.31 crore). Lease liabilities are not included.
- The company's own measure differs: "net free cash" of ₹83.3 crore at 31 Mar 2026, which counts only cash and cash equivalents (₹365.5 crore) against debt, leases and accrued interest (₹282.2 crore). It leaves out ₹223.8 crore of other bank balances.
- Inventory was ₹1,931 crore at 30 Sep 2026, against ₹805 crore at 31 Mar 2026, and trade payables were ₹1,219 crore. Operating cash flow in H1 FY27 was an outflow of ₹639 crore, against net profit of ₹222 crore.
- Of the ₹1,200 crore raised in Aug 2026, ₹774.42 crore had been used by 30 Sep 2026; of the unused ₹425.58 crore, ₹350 crore was in fixed deposits and ₹75.58 crore in monitoring and escrow accounts, the monitoring agency report says.
- Interest cover of 22.3 times is FY26 profit before interest and tax divided by finance costs, as CRISIL also states. Contingent liabilities (claims and guarantees not booked as debts) were ₹137.37 crore at 31 Mar 2026, mostly bank guarantees of ₹136.31 crore.
Sources (6)
- Integrated filing (financials) XBRL, quarter ended 30 Sep 2026
- Annual Report FY2025-26 (standalone financial statements, BRSR section)
- Press release, Q4 FY26 and FY26 results
- CRISIL Ratings rationale: Crisil A+/Stable/Crisil A1 reaffirmed, bank limits enhanced to Rs 2,420 crore (filed with intimation)
- Monitoring agency report on QIP proceeds, quarter ended 30 Sep 2026
- Integrated filing (financials) XBRL, quarter and year ended 31 Mar 2026 (revised 16 May 2026: reporting type)
19Who owns it
19Who owns it · Q2 FY27
Who owns Netweb Technologies?
- Promoters (founders or parent company)64.2%
- Foreign institutions (FII)9.5%
- Indian institutions (DII)7.2%
- Public and others19.2%
Promoter pledge
No promoter shares were pledged in Q2 FY27.
How ownership changed
* Pledged = share of the promoters' own holding reported as pledged. In older filings this can include shares “otherwise encumbered”; the governance flags say when.
Sources (13)
- Shareholding pattern (XBRL), quarter ended Sep 2026
- Shareholding pattern (XBRL), quarter ended Jun 2026
- Shareholding pattern (XBRL), quarter ended Mar 2026
- Shareholding pattern (XBRL), quarter ended Dec 2025
- Shareholding pattern (XBRL), quarter ended Sep 2025
- Shareholding pattern (XBRL), quarter ended Jun 2025
- Shareholding pattern (XBRL), quarter ended Mar 2025
- Shareholding pattern (XBRL), quarter ended Dec 2024
- Shareholding pattern (XBRL), quarter ended Sep 2024
- Shareholding pattern (XBRL), quarter ended Jun 2024
- Shareholding pattern (XBRL), quarter ended Mar 2024
- Shareholding pattern (XBRL), quarter ended Dec 2023
- SAST Regulation 29 disclosures list for NETWEB (promoter sales Aug 2024 and Feb 2026)
20What it does with profit
20What it does with profit
What does Netweb Technologies do with its profit?
Dividend per share
₹3.00FY26
Dividend paid for each share, by financial year.
₹ per share
See the numbers
Money raised · 27 Jul 2023
IPO, listed 27 Jul 2023: a ₹206 crore fresh issue for the company and an offer for sale of 85 lakh shares by the four promoters, after a ₹51 crore pre-IPO placement. The prospectus listed a new production line, working capital, debt repayment and general purposes as the uses of the fresh issue.
₹206 cr
Money raised · 20 Aug 2026
Qualified institutions placement: 2,505,219 new shares allotted at ₹4,790 each for ₹1,200 crore. Of the money, ₹970.50 crore is for working capital and ₹199.50 crore for general purposes.
₹1,200 cr
Sources (6)
- Annual Report FY2025-26 (standalone financial statements, BRSR section)
- Integrated filing (financials) XBRL, quarter ended 30 Sep 2026
- Red Herring Prospectus dated 10 Jul 2023 (restated financial information FY21-FY23)
- Annual Report FY2023-24
- QIP: outcome of fund-raising committee, allotment of 25,05,219 shares at Rs 4,790 (Rs 1,200 crore)
- Monitoring agency report on QIP proceeds, quarter ended 30 Sep 2026
21Governance signals
21Governance signals
What do Netweb Technologies' governance filings show?
- Auditor
- S S Kothari Mehta & Co. LLP, since 2022
- Auditor changes
- None in the period covered
- Audit qualifications
- None reported
- Related-party dealings
- The FY26 annual report lists as related parties the four Lodha directors and other key managers, a relative employed from 1 Feb 2026, the CSR company Netweb Foundation and Ashoka Bajaj Automobiles LLP. It states there were no materially significant related party transactions that may conflict with the company's interests.
- Credit rating
- CRISIL A+ (long term), A1 (short term), on ₹2,420 crore of bank facilities (outlook Stable), 10 Jun 2026
A credit rating describes the company's ability to repay debt. It is not a rating of the share.
Flags to know about
regulatory · 28 Mar 2025
Exchange cautionary letters
On 28 Mar 2025 BSE and NSE sent cautionary letters about the late filing of the intimation of investor and analyst meets held on 21 May 2024 and 29 Jul 2024. The company said it will take steps to address the concern.
regulatory · 14 Aug 2025
Customs duty order, under appeal
An order of 8 May 2025 from the Commissioner of Customs (Audit), New Delhi, alleges short payment of duty by wrongfully availing a benefit under customs notification No. 57/2017-Cus. It confirms ₹1.06 crore of duty plus interest, a ₹0.82 crore redemption fine and a ₹1.06 crore penalty. The company filed an appeal before CESTAT on 14 Aug 2025.
other · 16 Oct 2026
Promoter share sales
The promoters sold 2,054,795 shares in Aug 2024 (holding 75.04% to 71.39%) and 2,079,935 shares in Feb 2026 (71.00% to 66.98%). The fall to 64.16% by Sep 2026 came from new shares issued in the Aug 2026 placement; promoter shares were unchanged. No promoter shares were pledged in any quarter from Dec 2023 to Sep 2026.
disclosure · 28 Aug 2026
Restated periods and figures on this page
From 1 Apr 2025 the company values inventory at moving weighted average cost instead of first-in first-out, and applied the change to earlier periods too. FY25 profit became ₹113.75 crore (₹114.47 crore before), and Q3 and Q4 FY25 were also restated; FY22–FY24 were not. Restated Q3 and Q4 FY25 revenue, profit and EPS come from the company's press releases; their EBITDA is a Cityfort calculation from the restated results.
disclosure · 28 Aug 2026
Largest customers not named
Three customers each gave at least 10% of FY26 revenue (two in FY25); the annual report does not give their names or amounts.
auditor · 28 Aug 2026
Auditor appointed for five years in 2022
S S Kothari Mehta & Co. LLP was appointed on 20 Sep 2022 for five years. Its opinion on the FY26 accounts was unmodified.
Sources (13)
- Annual Report FY2025-26 (standalone financial statements, BRSR section)
- CRISIL Ratings rationale: Crisil A+/Stable/Crisil A1 reaffirmed, bank limits enhanced to Rs 2,420 crore (filed with intimation)
- Cautionary letters from BSE and NSE on late intimation of analyst meets
- Customs order-in-original: differential duty demand of Rs 1.06 crore plus interest and penalty
- Appeal filed before CESTAT against the customs order
- SAST Regulation 29 disclosures list for NETWEB (promoter sales Aug 2024 and Feb 2026)
- Shareholding pattern (XBRL), quarter ended Sep 2026
- Shareholding pattern (XBRL), quarter ended Mar 2026
- Shareholding pattern (XBRL), quarter ended Jun 2026
- Integrated filing (financials) XBRL, quarter and year ended 31 Mar 2025 (revised 9 May 2025: reporting type; pre-restatement figures)
- Press release, Q3 FY26 results
- Press release, Q4 FY26 and FY26 results
- Unaudited results, quarter ended 31 Dec 2025 (scanned PDF; restatement note 3)
22What the market paid
22What the market paid · price as of 11 Nov 2026
What did the market pay for Netweb Technologies on 11 Nov 2026?
Price as of 11 Nov 2026 (shown for education; prices change daily).
Price as of 11 Nov 2026: ₹4,154.50 (NSE closing price). Market value is ₹24,697 crore on 59,447,551 shares (Cityfort calculation from the NSE price data of 11 Nov 2026 and the Sep 2026 shareholding pattern). P/E is the price divided by profit per share: on diluted EPS of the four quarters to Sep 2026 (₹63.89, Cityfort calculation: the sum of quarterly EPS) it is 65.0. These EPS figures use average share counts, which were lower before the Aug 2026 placement. P/B divides the price by book value per share at 30 Sep 2026 (₹353.95, Cityfort calculation: net worth ÷ shares): 11.7.
- Share price
- ₹4,154.50
- Market value (market cap)
- ₹24,697 cr
- P/E
- 65×
- P/B
- 11.7×
Source: NSE security-wise historical price data, NETWEB EQ, 2-11 Nov 2026 (close 11 Nov 2026: Rs 4,154.50); Shareholding pattern (XBRL), quarter ended Sep 2026; Integrated filing (financials) XBRL, quarter ended 30 Sep 2026 and 3 more
Sources (6)
- NSE security-wise historical price data, NETWEB EQ, 2-11 Nov 2026 (close 11 Nov 2026: Rs 4,154.50)
- Shareholding pattern (XBRL), quarter ended Sep 2026
- Integrated filing (financials) XBRL, quarter ended 30 Sep 2026
- Integrated filing (financials) XBRL, quarter ended 30 Jun 2026
- Integrated filing (financials) XBRL, quarter and year ended 31 Mar 2026 (revised 16 May 2026: reporting type)
- Integrated filing (financials) XBRL, quarter ended 31 Dec 2025
23How it got here
23How it got here
How did Netweb Technologies get here?
1999
Milestone
Company set up
Incorporated on 22 Sep 1999 in New Delhi as Netweb Technologies India Pvt Ltd.
2004
Milestone
First supercomputer for research
Deployed the KABRU supercomputer at IMSc Chennai, which the company's timeline lists at 500th place among the world's most powerful supercomputers.
2019
Milestone
PARAM Ambar for ISRO
Deployed the PARAM Ambar supercomputer at ISRO.
2023
Milestone
AIRAWAT AI supercomputer
AIRAWAT, built by Netweb and installed at C-DAC Pune, ranked 75th in the June 2023 Top500 list, the prospectus says.
2023
Business-model change
Listed on NSE and BSE
Shares began trading on 27 Jul 2023 after an IPO with a ₹206 crore fresh issue and an offer for sale of 85 lakh promoter shares.
2024
Milestone
New server plant
Commercial production began at the IMT Faridabad server plant on 10 May 2024.
2025
Business-model change
Large AI server orders
In Sep 2025 the company announced orders of about ₹1,734 crore for Nvidia Blackwell-based servers and ₹450 crore for Tyrone AI GPU systems.
2026
Business-model change
AI becomes the largest product line
AI systems were 43.4% of FY26 revenue, up from 14.7% in FY25, by the company's own product split.
2026
Milestone
₹1,200 crore share placement
On 20 Aug 2026 the company allotted 2,505,219 new shares to institutions at ₹4,790 each, mainly to fund working capital.
2026
Milestone
Taiwan subsidiary proposed
On 24 Oct 2026 the board approved a proposal for a wholly owned subsidiary in Taiwan; incorporation had not yet been initiated, the filing says.
Sources (11)
- Red Herring Prospectus dated 10 Jul 2023 (restated financial information FY21-FY23)
- Earnings presentation, Q1 FY27 (July 2026)
- Annual Report FY2023-24
- Commencement of commercial production at the Faridabad IMT server plant (10 May 2024)
- Order intimation: Rs 1,734 crore purchase order for Nvidia Blackwell-based servers
- Order intimation: Rs 450 crore purchase order for Tyrone AI GPU-accelerated systems
- Press release, Q4 FY26 and FY26 results
- Earnings presentation, Q4 FY26 (May 2026)
- QIP: outcome of fund-raising committee, allotment of 25,05,219 shares at Rs 4,790 (Rs 1,200 crore)
- Monitoring agency report on QIP proceeds, quarter ended 30 Sep 2026
- Outcome of board meeting and unaudited results, quarter ended 30 Sep 2026 (incl. proposed Taiwan subsidiary)
Used in a free classroom lesson: Project: an IPO filing profile from one RHP.
24Sources and changes
Where every number on this page comes from
Sources (48 documents)
- S1Annual Report FY2025-26 (standalone financial statements, BRSR section) · NSE (company filing, nsearchives.nseindia.com) · Tier 1: company or exchange filing · 28 Aug 2026
- S3Annual Report FY2023-24 · NSE (company filing, nsearchives.nseindia.com) · Tier 1: company or exchange filing · 27 Jul 2024
- S4Red Herring Prospectus dated 10 Jul 2023 (restated financial information FY21-FY23) · NSE IPO archive (offer document, zip) · Tier 1: company or exchange filing · 10 Jul 2023
- S5Business Responsibility and Sustainability Report FY2025-26 · NSE (company filing, nsearchives.nseindia.com) · Tier 1: company or exchange filing · 28 Aug 2026
- S6Outcome of board meeting and unaudited results, quarter ended 30 Sep 2026 (incl. proposed Taiwan subsidiary) · NSE (company filing, nsearchives.nseindia.com) · Tier 1: company or exchange filing · 24 Oct 2026
- S7Integrated filing (financials) XBRL, quarter ended 30 Sep 2026 · NSE (company filing, nsearchives.nseindia.com) · Tier 1: company or exchange filing · 24 Oct 2026
- S8Integrated filing (financials) XBRL, quarter ended 30 Jun 2026 · NSE (company filing, nsearchives.nseindia.com) · Tier 1: company or exchange filing · 28 Jul 2026
- S9Integrated filing (financials) XBRL, quarter and year ended 31 Mar 2026 (revised 16 May 2026: reporting type) · NSE (company filing, nsearchives.nseindia.com) · Tier 1: company or exchange filing · 16 May 2026
- S10Integrated filing (financials) XBRL, quarter ended 31 Dec 2025 · NSE (company filing, nsearchives.nseindia.com) · Tier 1: company or exchange filing · 17 Jan 2026
- S11Integrated filing (financials) XBRL, quarter ended 30 Sep 2025 · NSE (company filing, nsearchives.nseindia.com) · Tier 1: company or exchange filing · 1 Nov 2025
- S12Integrated filing (financials) XBRL, quarter ended 30 Jun 2025 · NSE (company filing, nsearchives.nseindia.com) · Tier 1: company or exchange filing · 31 Jul 2025
- S13Integrated filing (financials) XBRL, quarter and year ended 31 Mar 2025 (revised 9 May 2025: reporting type; pre-restatement figures) · NSE (company filing, nsearchives.nseindia.com) · Tier 1: company or exchange filing · 9 May 2025
- S15Financial results XBRL, quarter and year ended 31 Mar 2024 · NSE (company filing, nsearchives.nseindia.com) · Tier 1: company or exchange filing · 1 May 2024
- S16Audited results, quarter and year ended 31 Mar 2026 (scanned PDF) · NSE (company filing, nsearchives.nseindia.com) · Tier 1: company or exchange filing · 2 May 2026
- S17Unaudited results, quarter ended 31 Dec 2025 (scanned PDF; restatement note 3) · NSE (company filing, nsearchives.nseindia.com) · Tier 1: company or exchange filing · 17 Jan 2026
- S18Press release, Q2 FY27 results · NSE (company filing, nsearchives.nseindia.com) · Tier 1: company or exchange filing · 24 Oct 2026
- S19Press release, Q4 FY26 and FY26 results · NSE (company filing, nsearchives.nseindia.com) · Tier 1: company or exchange filing · 2 May 2026
- S20Press release, Q3 FY26 results · NSE (company filing, nsearchives.nseindia.com) · Tier 1: company or exchange filing · 17 Jan 2026
- S21Earnings presentation, Q2 FY27 (October 2026) · NSE (company filing, nsearchives.nseindia.com) · Tier 1: company or exchange filing · 24 Oct 2026
- S23Earnings presentation, Q4 FY26 (May 2026) · NSE (company filing, nsearchives.nseindia.com) · Tier 1: company or exchange filing · 2 May 2026
- S24Earnings presentation, Q1 FY27 (July 2026) · NSE (company filing, nsearchives.nseindia.com) · Tier 1: company or exchange filing · 28 Jul 2026
- S25Q2 FY27 earnings call transcript (call 26 Oct 2026) · NSE (company filing, nsearchives.nseindia.com) · Tier 1: company or exchange filing · 29 Oct 2026
- S27Q4 FY26 earnings call transcript (call 4 May 2026) · NSE (company filing, nsearchives.nseindia.com) · Tier 1: company or exchange filing · 7 May 2026
- S29CRISIL Ratings rationale: Crisil A+/Stable/Crisil A1 reaffirmed, bank limits enhanced to Rs 2,420 crore (filed with intimation) · CRISIL Ratings (via NSE filing) · Tier 2: rating agency or regulator · 10 Jun 2026
- S30Shareholding pattern (XBRL), quarter ended Sep 2026 · NSE (company filing, nsearchives.nseindia.com) · Tier 1: company or exchange filing · 16 Oct 2026
- S31Shareholding pattern (XBRL), quarter ended Jun 2026 · NSE (company filing, nsearchives.nseindia.com) · Tier 1: company or exchange filing · 17 Jul 2026
- S32Shareholding pattern (XBRL), quarter ended Mar 2026 · NSE (company filing, nsearchives.nseindia.com) · Tier 1: company or exchange filing · 9 Apr 2026
- S33Shareholding pattern (XBRL), quarter ended Dec 2025 · NSE (company filing, nsearchives.nseindia.com) · Tier 1: company or exchange filing · 16 Jan 2026
- S34Shareholding pattern (XBRL), quarter ended Sep 2025 · NSE (company filing, nsearchives.nseindia.com) · Tier 1: company or exchange filing · 17 Oct 2025
- S35Shareholding pattern (XBRL), quarter ended Jun 2025 · NSE (company filing, nsearchives.nseindia.com) · Tier 1: company or exchange filing · 18 Jul 2025
- S36Shareholding pattern (XBRL), quarter ended Mar 2025 · NSE (company filing, nsearchives.nseindia.com) · Tier 1: company or exchange filing · 19 Apr 2025
- S37Shareholding pattern (XBRL), quarter ended Dec 2024 · NSE (company filing, nsearchives.nseindia.com) · Tier 1: company or exchange filing · 15 Jan 2025
- S38Shareholding pattern (XBRL), quarter ended Sep 2024 · NSE (company filing, nsearchives.nseindia.com) · Tier 1: company or exchange filing · 10 Oct 2024
- S39Shareholding pattern (XBRL), quarter ended Jun 2024 · NSE (company filing, nsearchives.nseindia.com) · Tier 1: company or exchange filing · 16 Jul 2024
- S40Shareholding pattern (XBRL), quarter ended Mar 2024 · NSE (company filing, nsearchives.nseindia.com) · Tier 1: company or exchange filing · 16 Apr 2024
- S41Shareholding pattern (XBRL), quarter ended Dec 2023 · NSE (company filing, nsearchives.nseindia.com) · Tier 1: company or exchange filing · 16 Jan 2024
- S42QIP: outcome of fund-raising committee, allotment of 25,05,219 shares at Rs 4,790 (Rs 1,200 crore) · NSE (company filing, nsearchives.nseindia.com) · Tier 1: company or exchange filing · 20 Aug 2026
- S43Monitoring agency report on QIP proceeds, quarter ended 30 Sep 2026 · NSE (company filing, nsearchives.nseindia.com) · Tier 1: company or exchange filing · 27 Oct 2026
- S45Order intimation: Rs 1,734 crore purchase order for Nvidia Blackwell-based servers · NSE (company filing, nsearchives.nseindia.com) · Tier 1: company or exchange filing · 3 Sep 2025
- S46Order intimation: Rs 450 crore purchase order for Tyrone AI GPU-accelerated systems · NSE (company filing, nsearchives.nseindia.com) · Tier 1: company or exchange filing · 19 Sep 2025
- S47Customs order-in-original: differential duty demand of Rs 1.06 crore plus interest and penalty · NSE (company filing, nsearchives.nseindia.com) · Tier 1: company or exchange filing · 16 May 2025
- S48Appeal filed before CESTAT against the customs order · NSE (company filing, nsearchives.nseindia.com) · Tier 1: company or exchange filing · 14 Aug 2025
- S49Cautionary letters from BSE and NSE on late intimation of analyst meets · NSE (company filing, nsearchives.nseindia.com) · Tier 1: company or exchange filing · 28 Mar 2025
- S52Postal ballot result: re-appointment of Sanjay, Navin, Niraj and Vivek Lodha for 5 years from 14 Aug 2026 · NSE (company filing, nsearchives.nseindia.com) · Tier 1: company or exchange filing · 20 Mar 2026
- S53Commencement of commercial production at the Faridabad IMT server plant (10 May 2024) · NSE (company filing, nsearchives.nseindia.com) · Tier 1: company or exchange filing · 10 May 2024
- S55Product launch: Tyrone ParallelStor Velox · NSE (company filing, nsearchives.nseindia.com) · Tier 1: company or exchange filing · 29 Apr 2026
- S56SAST Regulation 29 disclosures list for NETWEB (promoter sales Aug 2024 and Feb 2026) · NSE (corporate-sast-reg29 API, symbol NETWEB) · Tier 1: company or exchange filing · 12 Feb 2026
- S57NSE security-wise historical price data, NETWEB EQ, 2-11 Nov 2026 (close 11 Nov 2026: Rs 4,154.50) · NSE (historicalOR API) · Tier 1: company or exchange filing · 11 Nov 2026
Changes to this page (v1 · 12 Nov 2026)
- v1 · 12 Nov 2026First version. (first version)
Numbers come only from tier 1 and tier 2 sources. Read how we research.
Disclaimer
For learning only. Cityfort is not a SEBI-registered adviser and does not recommend buying or selling any security. Prices shown are dated and may be out of date.
Investing in securities involves risk, including loss of capital. Before making any investment decision, do your own research and consider consulting a SEBI-registered investment adviser.
Cityfort, its owners and contributors may or may not hold securities of companies covered. Content is not an offer or solicitation to buy or sell any security.
Read the full disclaimerHide the full disclaimer
Cityfort publishes educational content that explains how listed companies work. Cityfort is not registered with the Securities and Exchange Board of India (SEBI) as an Investment Adviser or Research Analyst and does not provide investment advice, recommendations, ratings, price targets or any opinion on whether to buy, sell or hold any security.
All information is taken from publicly available sources, mainly company filings on BSE and NSE, which are listed on each page with dates. We work to keep it accurate and correct errors publicly, but we do not guarantee that it is complete, accurate or up to date. Any market price or price-based ratio shown is dated, may be out of date by the time you read it, and is included only to explain concepts.
Statements by company management are reported as statements, with their date and source; they are not our forecasts.