Metals & Mining · NSE: SAIL · BSE: 500113
SAIL: how the business works
SAIL, 65% owned by the Government of India, makes steel at five integrated plants and three special steel plants, and earned ₹110,811 crore of revenue in FY26.
Follow SAIL
Email me when SAIL's page is updated after results.
We store your email address with Kit, our email provider, which also records when you sign up and whether you open or click our emails. We send a confirmation email first. See our privacy policy.
Steel Authority of India Limited · New Delhi · Founded 1973
Updated for Q2 FY27 · checked
- Revenue, FY26
- ₹110,811 cr
- Profit, FY26 (after ₹668 cr of one-off charges)
- ₹3,373 cr
- Steel sold, FY26 (incl. about 1.17 million tonnes made by NMDC Steel and RINL)
- 19.93 million tonnes
- Incorporated
- 1973
- Government of India holding, 30 Sep 2026
- 65.00%
The short version
SAIL in 5 points
1 · What it sells
SAIL makes steel at five integrated plants and three special steel plants, and sold 19.93 million tonnes in FY26, including about 1.17 million tonnes made by NMDC Steel and RINL.
2 · Who pays it
Of SAIL's FY26 product sales, the Central Government, including Indian Railways, took 10.2%, buyers outside India 1.1% and other customers in India, such as companies and dealers, 88.7% (Cityfort calculation from the FY26 annual report).
3 · What it keeps from ₹100
Of every ₹100 that came in during FY26, SAIL kept ₹3.0 as profit after ₹0.6 of one-off charges for a higher gratuity ceiling and a power-tariff adjustment, and its profit before one-off items and tax, including its ₹425 crore share of joint ventures' profit, was ₹5,174 crore.
4 · Where the operating profit comes from
Of SAIL's ₹7,332 crore FY26 segment profit before interest and one-off items, the Bhilai plant earned ₹2,832 crore and Rourkela ₹1,609 crore, while the Salem plant lost ₹218 crore.
5 · The one thing to watch
SAIL's debt including leases was ₹31,464 crore on 30 Sep 2026, and management said on 28 Oct 2026 that it plans about ₹120,000 crore of capital spending over four years to grow from 20 to 35 million tonnes a year.
Sources: From SAIL's FY26 annual report, its Q4 FY26 to Q2 FY27 results, its Q4 FY26 and Q2 FY27 earnings calls and its Sep 2026 shareholding pattern · checked
Sources (8)
- Business Responsibility and Sustainability Report FY26
- Results presentation Q4 and FY26
- Earnings call transcript Q4 FY26 (call held 16 May 2026)
- Annual Report FY26 (incl. standalone + consolidated statements)
- Consolidated results Q4 FY26 and FY26, XBRL
- Financial results Q4 FY26 and FY26 (standalone + consolidated, with press release)
- Financial results Q2 FY27 (standalone + consolidated, with press release)
- Earnings call transcript Q2 FY27 (call held 28 Oct 2026)
01Where the money goes · FY26
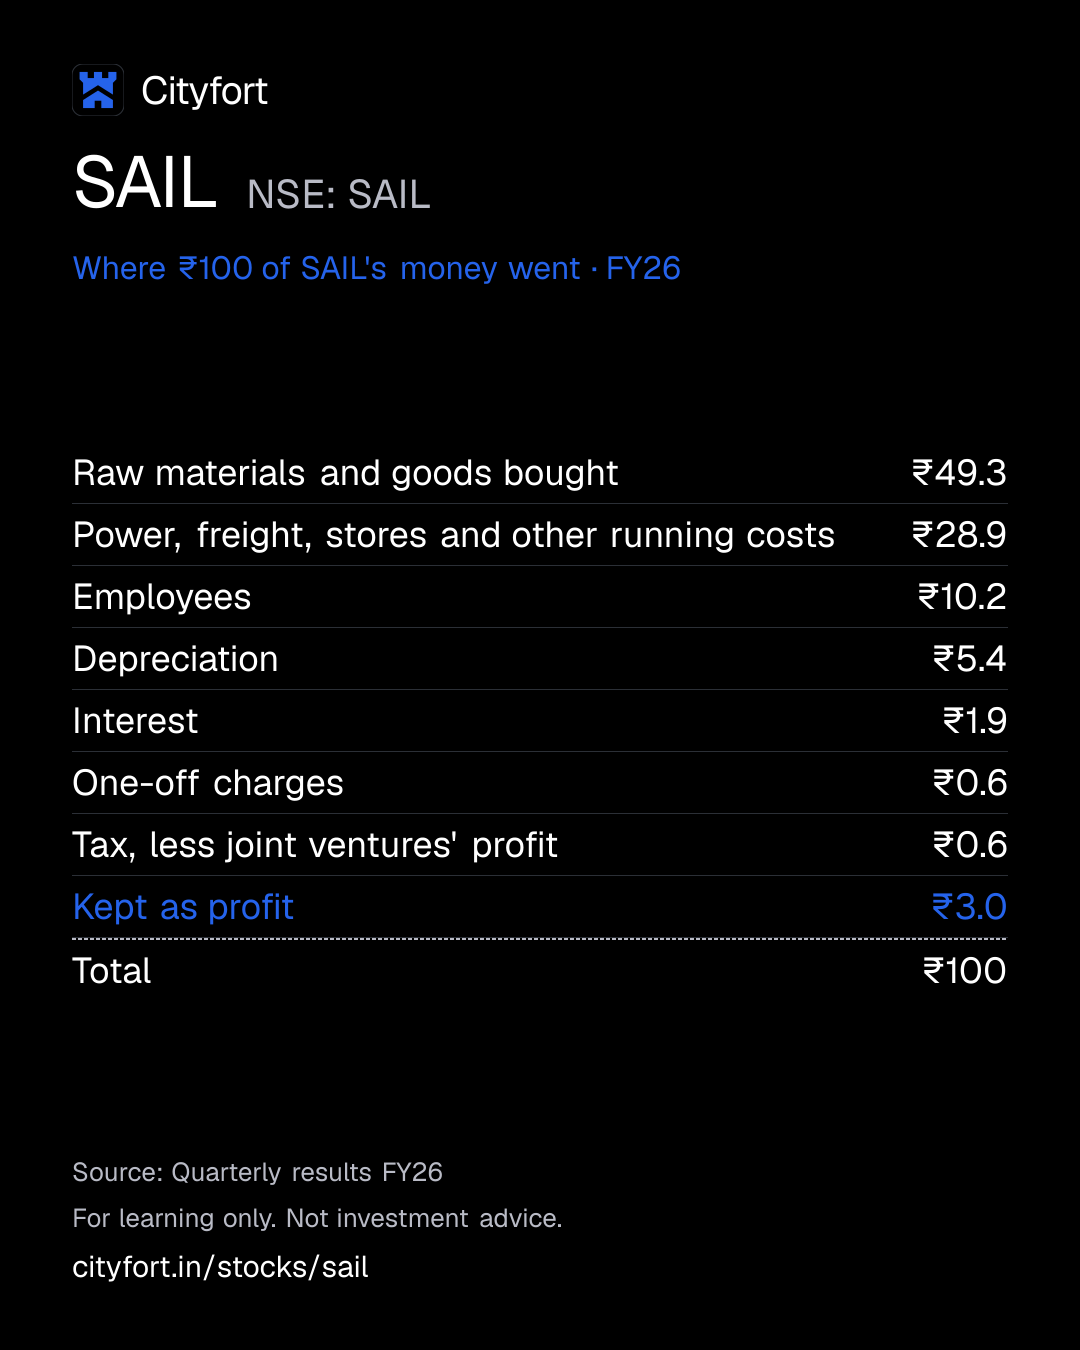
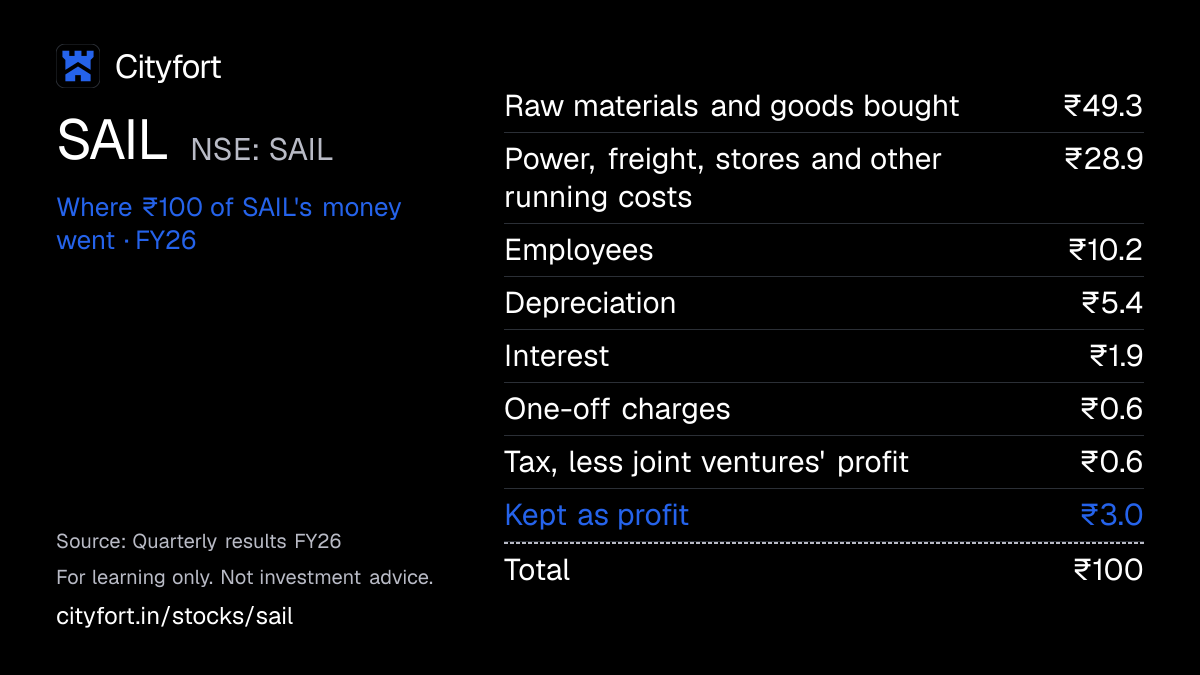
Where does ₹100 of SAIL's money go?
SAIL · FY26
Receipt for every ₹100
| Raw materials and goods bought | ₹49.3 |
|---|---|
| Power, freight, stores and other running costs | ₹28.9 |
| Employees | ₹10.2 |
| Depreciation | ₹5.4 |
| Interest | ₹1.9 |
| One-off charges | ₹0.6 |
| Tax, less joint ventures' profit | ₹0.6 |
| Kept as profit | ₹3.0 |
| Total | ₹100 |
Each line = amount ÷ total money in × 100. Lines may not add to exactly ₹100 because of rounding.
How this is worked out
Cityfort calculation from the FY26 results: each line ÷ ₹111,705 crore of money in (revenue ₹110,811 crore + other income ₹894 crore) × 100. The one-off charges (₹668 crore) were for a higher gratuity ceiling and a power-tariff adjustment. The tax line is tax of ₹1,133 crore less SAIL's ₹425 crore share of joint ventures' profit.
Save this receipt as an image
Embed this receipt or the key numbers
Paste this code into a blog or website to show the card you choose, with a link back to this page.
Each week: the next company due to report results, explained in 5 points.
We'll email you once a week with what changed on Cityfort. Facts only, no tips. Unsubscribe any time.
We store your email address with Kit, our email provider, which also records when you sign up and whether you open or click our emails. We send a confirmation email first. See our privacy policy.
02The business in one line
What does SAIL do?
Indian Railways, government bodies, companies and dealers pay SAIL for steel; raw materials take ₹49.3 of every ₹100, and ₹3.0 is left as profit.
- SAIL sold 19.93 million tonnes of steel in FY26. About 1.17 million tonnes of that was made by NMDC Steel and RINL, which SAIL bought and resold.
- The Government of India owns 65.00% of SAIL. FY26 profit of ₹3,373 crore came after ₹668 crore of one-off charges.
03Who pays it
Who pays SAIL?
Central Government, including Indian Railways
10.2%
of revenue
Sales of ₹11,234 crore in FY26 (₹10,358 crore in FY25), as stated in the related-party note. SAIL says it has met Indian Railways' entire demand for rails for decades.
Customers outside India
1.1%
of revenue
Exports of ₹1,157 crore in FY26, up from ₹492 crore in FY25. The BRSR puts exports at 1.05% of FY26 turnover.
Other customers in India
88.7%
of revenue
Public sector companies, private companies, distributors and resellers in 28 states and 6 union territories, for construction, infrastructure, automotive, energy and engineering uses. SAIL does not split these sales further.
- Central Government, including Indian Railways10.2%
- Customers outside India1.1%
- Other customers in India88.7%
How spread out the customers are
Shares are of FY26 sale of products (₹109,966 crore); Cityfort calculation from the FY26 annual report. The Central Government figure covers several government buyers; SAIL says no single customer gave 10% or more of revenue. India Ratings names Indian Railways as one of SAIL's largest customers, with prices regulated by the Government.
04How it makes money
How does SAIL make money?
SAIL earns the gap between the steel price and the cost of coal, ore, power and staff, so profit moves with that gap.
SAIL mines all its iron ore but imports most of its coking coal. Staff took ₹10.2 of every ₹100 in FY26. CareEdge says SAIL's average price fell to ₹55,181 a tonne in FY26 from ₹56,854.
EBITDA margin (Cityfort calculation, after one-off items)
20.7%10.6%
FY22 to FY26
- Captive mines supply all its iron ore; about 85% of its coal is imported, management says.
- Blast furnaces turn ore and coke into crude steel: 19.43 million tonnes in FY26.
- It sold 19.93 million tonnes of steel in FY26, about 1.17 million of them made by NMDC Steel and RINL and bought for resale.
- Price minus cost per tonne sets EBITDA: ₹6,595 a tonne in FY26, by the company's own standalone measure.
- India Ratings (3 Sep 2026) expects operating leverage from higher volumes: fixed costs spread over more tonnes.
- Cash pays for expansion: management said on 28 Oct 2026 it plans about ₹120,000 crore over four years to grow from 20 to 35 million tonnes a year.
↺ Step 6 feeds back into step 1.
Sources (7)
- Consolidated audited results FY22, XBRL
- Consolidated results Q4 FY26 and FY26, XBRL
- Results presentation Q2 and H1 FY27
- Results presentation Q4 and FY26
- Earnings call transcript Q2 FY27 (call held 28 Oct 2026)
- CareEdge rating rationale (CARE AA; Positive / CARE A1+), 6 Oct 2026, as filed by SAIL
- India Ratings rationale (upgrade to IND AA+/Stable), as filed by SAIL
05Business segments · FY26
Which businesses make up SAIL?
Bhilai Steel Plant
27.7%Integrated plant, 6.16 million tonnes a year (Ministry of Steel). It earned ₹2,832 crore of the ₹7,332 crore FY26 segment total, against ₹4,091 crore in FY25.
Revenue ₹30,502 cr · Operating profit ₹2,832 cr
Rourkela Steel Plant
21.7%Integrated plant, 3.8 million tonnes a year (Ministry of Steel). Segment result ₹1,609 crore in FY26, against ₹829 crore in FY25.
Revenue ₹23,843 cr · Operating profit ₹1,609 cr
Bokaro Steel Plant
21.3%Integrated plant, 4.6 million tonnes a year (Ministry of Steel). Segment result ₹1,415 crore in FY26, against ₹126 crore in FY25.
Revenue ₹23,372 cr · Operating profit ₹1,415 cr
IISCO Steel Plant (Burnpur)
11.5%Integrated plant, 2.5 million tonnes a year (Ministry of Steel). Segment result ₹982 crore in FY26, against ₹696 crore in FY25.
Revenue ₹12,670 cr · Operating profit ₹982 cr
Durgapur Steel Plant
9.9%Integrated plant, 2.2 million tonnes a year (Ministry of Steel). Segment result ₹475 crore in FY26, against ₹536 crore in FY25.
Revenue ₹10,902 cr · Operating profit ₹475 cr
Salem Steel Plant
1.8%Special steel plant, 0.18 million tonnes a year (Ministry of Steel). It lost ₹218 crore in FY26, against a ₹306 crore loss in FY25.
Revenue ₹1,979 cr · Operating profit −₹218 cr
Alloy Steels Plant (Durgapur)
0.7%Alloy steel plant, 0.234 million tonnes a year (Ministry of Steel). It lost ₹3 crore in FY26, against ₹16 crore in FY25.
Revenue ₹824 cr · Operating profit −₹3 cr
Visvesvaraya Iron and Steel Plant (Bhadravati)
0.2%Small special steel plant. It lost ₹41 crore in FY26, against ₹38 crore in FY25.
Revenue ₹184 cr · Operating profit −₹41 cr
Others
5.2%All other units, as the company groups them; revenue rose to ₹5,690 crore from ₹1,865 crore in FY25. Revenue here is sales to outside customers (₹109,966 crore in all); results are before interest, tax and one-off items.
Revenue ₹5,690 cr · Operating profit ₹280 cr
How the mix changed
- Bhilai Steel Plant
- Rourkela Steel Plant
- Bokaro Steel Plant
- IISCO Steel Plant (Burnpur)
- Durgapur Steel Plant
- Salem Steel Plant
- Alloy Steels Plant (Durgapur)
- Visvesvaraya Iron and Steel Plant (Bhadravati)
- Others
Revenue by segment, FY22 to FY26.
₹ crore
See the numbers
06The numbers · Consolidated · ₹ crore
How has SAIL done?
Revenue
₹110,811 crFY26
Revenue stayed between ₹102,479 crore and ₹110,811 crore from FY22 to FY26, and Q2 FY27's ₹31,998 crore was 19.8% above Q2 FY26; FY26 sales of 19.93 million tonnes include about 1.17 million tonnes made by NMDC Steel and RINL.
₹ crore
See the numbers
Net profit
₹3,373 crFY26
Profit fell from ₹12,243 crore in FY22 to ₹2,177 crore in FY23 and was ₹3,373 crore in FY26, with one-off items of +₹258 crore in FY23 (mainly a land sale), −₹841 crore in FY24 (tax and dispute settlements), −₹313 crore in FY25 (mainly arrears of executive perks for 2008–09) and −₹668 crore in FY26 (a higher gratuity ceiling and a power-tariff adjustment), and Q2 FY26's ₹419 crore came after a ₹338 crore gratuity charge.
₹ crore
See the numbers
Net profit for every ₹100 of revenue
₹3.0FY26
EBITDA here is a Cityfort calculation on reported profit before tax, so after one-off items and including joint ventures' profit: it fell from ₹20.7 per ₹100 of revenue in FY22 to ₹8.6 in FY23 and was ₹10.6 in FY26, after ₹668 crore of one-off charges for a higher gratuity ceiling and a power-tariff adjustment; before those charges FY26 EBITDA was ₹12,425 crore (Cityfort calculation), and the company's own standalone EBITDA, which includes other income, was ₹13,146 crore.
Net margin: ₹ of net profit per ₹100 of revenue
See the numbers
Free cash flow
₹10,281 crFY26
Operating cash flow was ₹30,987 crore in FY22, −₹5,290 crore in FY23 and ₹19,039 crore in FY26, which left ₹10,281 crore of free cash flow after ₹8,758 crore spent on plants.
₹ crore · cash from operations minus spending on plants and equipment
See the numbers
See all yearly numbers
EBITDA = profit before interest, tax and wear-and-tear of assets. Financial year runs April to March (March year end). Net profit is the share belonging to the company's owners.
Sources (21)
- Consolidated audited results FY22, XBRL
- Annual Report FY23 (NSE zip containing the PDF)
- Annual Report FY22 (NSE zip containing the PDF)
- Consolidated audited results FY23, XBRL
- Annual Report FY24
- Consolidated audited results FY24, XBRL
- Financial results Q4 FY25 and FY25 (standalone + consolidated, with press release)
- Consolidated results Q4 FY25 and FY25, XBRL
- Annual Report FY25
- Consolidated results Q4 FY26 and FY26, XBRL
- Annual Report FY26 (incl. standalone + consolidated statements)
- Financial results Q4 FY26 and FY26 (standalone + consolidated, with press release)
- Consolidated results Q3 FY25, XBRL
- Consolidated results Q1 FY26, XBRL
- Consolidated results Q2 FY26, XBRL
- Financial results Q2 FY26 (standalone + consolidated, with press release)
- Consolidated results Q3 FY26, XBRL (revised filing)
- Consolidated results Q1 FY27, XBRL
- Financial results Q1 FY27 (standalone + consolidated, with press release)
- Consolidated results Q2 FY27, XBRL
- Financial results Q2 FY27 (standalone + consolidated, with press release)
07Who runs it
Who runs SAIL, and did they deliver?
Dr. Ashok Kumar Panda
Chairman & Managing Director · since 2026
Chairman and Managing Director from 9 May 2026; earlier Director (Finance). His predecessor, Amarendu Prakash, resigned with effect from 1 Apr 2026.
T.N. Natarajan
Director (Commercial)
Mohit Malpani
Company Secretary
What they said, and what happened
1 partly delivered · 4 too early to tell
Said on 2 Feb 2026
FY26 capital spending of ₹10,000 crore, raised from an initial ₹7,500 crore.
Partly deliveredWhat happened
FY26 capital spending was ₹9,187 crore on the company's own basis, according to the FY26 annual report.
Said on 16 May 2026
FY27 sales volume target of 22 million tonnes.
Too early to tellWhat happened
On 28 Oct 2026 management said FY27 sales may be around 21 million tonnes, including some RINL steel. H1 FY27 sales were 9.33 million tonnes.
Said on 16 May 2026
FY27 capital spending of ₹15,000 crore.
Too early to tellWhat happened
Management said on 28 Oct 2026 that about ₹5,500 crore was spent in H1 FY27 and kept the ₹15,000 crore guidance. Cash spent on plants in H1 FY27 was ₹5,333 crore in the results.
Said on 16 May 2026
Provide for the next wage revision in Q4 FY27, once government guidelines come.
Too early to tellWhat happened
On 28 Oct 2026 management said: "We have not calculated anything about it."
Said on 1 Sep 2026
Commission the 3.5 million tonne a year Tasra coking coal washery by Feb 2027.
Too early to tellWhat happened
Management said on 28 Oct 2026 that the Tasra mine was on track to start production in Jan 2027.
Sources (7)
- Appointment of Dr. Ashok Kumar Panda as Chairman & Managing Director w.e.f. 9 May 2026
- Resignation of Shri Amarendu Prakash as CMD w.e.f. 1 Apr 2026
- Earnings call transcript Q2 FY27 (call held 28 Oct 2026)
- Earnings call transcript Q3 FY26 (call held 2 Feb 2026)
- Annual Report FY26 (incl. standalone + consolidated statements)
- Earnings call transcript Q4 FY26 (call held 16 May 2026)
- Consolidated results Q2 FY27, XBRL
08What could go wrong
What could go wrong for SAIL?
- Raw-material prices
Imported coking coal
Management said on 28 Oct 2026 that about 85% of SAIL's coal is imported, and that higher imported coking coal prices cut EBITDA margins in Q2 FY27. India Ratings says 2–3% of coal needs come from SAIL's own blocks.
Watch EBITDA margin each quarter (13.2% in Q2 FY27, Cityfort calculation) and Tasra output from Jan 2027.
- Pricing
Steel prices and imports
CareEdge says SAIL's average price fell to ₹55,181 a tonne in FY26 from ₹56,854. India Ratings notes a 12% safeguard duty on imported flat steel from Dec 2025.
Watch Price per tonne in each results deck, and whether the safeguard duty continues.
- Debt
Large, debt-funded expansion
Management said on 28 Oct 2026 that it plans about ₹120,000 crore of capital spending over four years. CareEdge said on 6 Oct 2026 that management expects debt to peak at ₹80,000–90,000 crore in FY30–FY31, and that actual spending has usually been lower than announced plans.
Watch Debt including leases each half-year (₹31,464 crore on 30 Sep 2026) and FY27 spending against ₹15,000 crore.
- Concentration
Government buyers and provisional prices
Sales to the Central Government, including Indian Railways, were ₹11,234 crore in FY26. Some government sales are billed at provisional prices (₹4,776 crore in H1 FY27), and Q2 FY27 included a ₹309 crore provision for a lower FY25 rail price.
Watch Final rail price orders and any further provisions in the results notes.
- Other
Next wage revision
The last wage revision, effective 1 Apr 2020, was implemented in FY22 and added ₹837 crore of employee cost (standalone). Management said on 16 May 2026 that it would provide for the next one in Q4 FY27, and on 28 Oct 2026 that it had not calculated it.
Watch Any wage revision provision in the Q4 FY27 results.
- Governance
Board without enough independent directors
The auditors' Q2 FY27 review report says the board and key committees did not meet the Companies Act and SEBI listing rules on independent directors. The Q2 FY27 audit committee had one independent director, pending appointments.
Watch Appointment of independent directors, filed with the exchanges.
- Legal
Disputed claims
Contingent liabilities were ₹39,723 crore on 31 Mar 2026 (standalone). The largest groups were other duties, cess and levies (₹11,095 crore) and miscellaneous claims (₹11,128 crore).
Watch Contingent liabilities in the FY27 annual report.
- Other
Possible share issue
SAIL told NSE on 10 Aug 2026 that an FPO or QIP is one option being explored, at a preliminary stage. Management said on 28 Oct 2026 that "the timing will decide" when to go for it.
Watch Any board approval of a share issue, filed with the exchanges.
Sources (10)
- Earnings call transcript Q2 FY27 (call held 28 Oct 2026)
- India Ratings rationale (upgrade to IND AA+/Stable), as filed by SAIL
- Consolidated results Q2 FY27, XBRL
- CareEdge rating rationale (CARE AA; Positive / CARE A1+), 6 Oct 2026, as filed by SAIL
- Financial results Q2 FY27 (standalone + consolidated, with press release)
- Annual Report FY26 (incl. standalone + consolidated statements)
- Annual Report FY22 (NSE zip containing the PDF)
- Earnings call transcript Q4 FY26 (call held 16 May 2026)
- Cessation of independent directors on completion of tenure w.e.f. 20 Apr 2026
- Reply to NSE on news of a possible FPO (Reg. 30(11) rumour verification)
09Supporters and critics
What do supporters and critics point to?
What supporters point to
- Net debt including leases fell from ₹35,967 crore on 31 Mar 2025 to ₹29,738 crore on 30 Sep 2026 (Cityfort calculation), and India Ratings upgraded SAIL to IND AA+ in Sep 2026.
- Captive mines meet all of SAIL's iron ore needs, with 2,476 million tonnes of reserves, CareEdge says.
- H1 FY27 profit was ₹3,395 crore, more than the ₹3,373 crore of all of FY26.
- SAIL says it has met Indian Railways' entire demand for rails for decades; it supplied 12.6 lakh tonnes in FY26.
- India Ratings says the Government, which holds 65%, treats SAIL as strategically important and has supported the sector with policy steps.
What critics point to
- FY26 EBITDA margin was 10.6% (Cityfort calculation), against 20.7% in FY22, and India Ratings says SAIL's techno-economic parameters lag its larger peers.
- About 85% of SAIL's coal is imported, management said on 28 Oct 2026.
- Management said on 28 Oct 2026 that it plans about ₹120,000 crore of capital spending over four years, and CareEdge said on 6 Oct 2026 that management expects debt to peak at ₹80,000–90,000 crore.
- The auditors' Q2 FY27 review report says the board lacked the required independent directors and a woman director.
- SAIL told NSE on 10 Aug 2026 that an FPO or QIP, which would add new shares, is being explored.
10What to watch next
What should you watch next at SAIL?
Next event
Q3 FY27 results (date not announced yet)
Date not announced yet.
FY27 sales volume
Management said on 28 Oct 2026 that FY27 sales may be around 21 million tonnes. H1 FY27 sales were 9.33 million tonnes, including 184,000 tonnes made by RINL.
Tasra coking coal mine
Management said on 28 Oct 2026 that Tasra would start production in Jan 2027. About 85% of SAIL's coal is imported.
Wage revision provision
Management said on 16 May 2026 that it would provide for the next wage revision in Q4 FY27; it gave no amount.
Spending and debt
Management guides FY27 capital spending of ₹15,000 crore, about ₹5,500 crore of it in H1. Debt including leases was ₹31,464 crore on 30 Sep 2026.
11Key facts
Key facts about SAIL
- What does SAIL do?
- Steel Authority of India Ltd (SAIL) makes steel at five integrated plants (Bhilai, Durgapur, Rourkela, Bokaro and IISCO Burnpur) and three alloy and special steel plants. SAIL sold 19.93 million tonnes of steel in FY26, including about 1.17 million tonnes made by NMDC Steel and RINL that SAIL bought and resold.
- How does SAIL make money?
- SAIL earns the gap between the price of the steel it sells and the cost of iron ore, coking coal, power and staff. SAIL's FY26 EBITDA, a Cityfort calculation after one-off charges and including its ₹425 crore share of joint ventures' profit, was ₹11,757 crore on revenue of ₹110,811 crore.
- Who are SAIL's customers?
- SAIL sells to Indian Railways, other government bodies, public sector companies, private companies, distributors and resellers. Of SAIL's ₹109,966 crore of FY26 product sales, ₹11,234 crore was to the Central Government, including Indian Railways, and ₹1,157 crore was exports.
- How big is SAIL?
- SAIL's FY26 consolidated revenue was ₹110,811 crore and its profit ₹3,373 crore, after ₹668 crore of one-off charges. SAIL had 49,752 employees on 1 Apr 2026.
- Who owns SAIL?
- On 30 Sep 2026, the Government of India, through the President of India, held 65.00% of SAIL's shares. Indian institutions held 16.49%, foreign portfolio investors 7.31% and other shareholders the remaining 11.20%; none of the Government's shares were pledged.
- How much debt does SAIL have?
- On 30 Sep 2026, SAIL's debt including leases was ₹31,464 crore: ₹20,583 crore of borrowings and ₹10,882 crore of lease liabilities. SAIL's cash and bank balances were ₹1,727 crore.
- How did SAIL do in its latest quarter?
- In Q2 FY27 (Jul–Sep 2026), SAIL's revenue was ₹31,998 crore, up 19.8% from ₹26,704 crore a year earlier. SAIL's profit was ₹1,750 crore, against ₹419 crore in Q2 FY26.
- What is SAIL's steelmaking capacity?
- The Ministry of Steel told the Rajya Sabha on 27 Mar 2026 that SAIL's operational crude steel capacity was 19.676 million tonnes a year. CareEdge's rating report of 6 Oct 2026 gives SAIL's crude steel capacity as 20.84 million tonnes a year.
- Does SAIL pay a dividend?
- SAIL's board recommended a final dividend of ₹2.35 a share for FY26, equal to 28.8% of FY26 earnings per share of ₹8.17 (Cityfort calculation). SAIL paid ₹1.60 a share for FY25.
Sources (13)
- CareEdge rating rationale (CARE AA; Positive / CARE A1+), 6 Oct 2026, as filed by SAIL
- Business Responsibility and Sustainability Report FY26
- Results presentation Q4 and FY26
- Earnings call transcript Q4 FY26 (call held 16 May 2026)
- Annual Report FY26 (incl. standalone + consolidated statements)
- Consolidated results Q4 FY26 and FY26, XBRL
- Financial results Q4 FY26 and FY26 (standalone + consolidated, with press release)
- Shareholding pattern as on 30 Sep 2026 (XBRL filed with NSE)
- Financial results Q2 FY27 (standalone + consolidated, with press release)
- Consolidated results Q2 FY27, XBRL
- Consolidated results Q2 FY26, XBRL
- Ministry of Steel, Rajya Sabha unstarred question 3982 (answered 27 Mar 2026): SAIL plant-wise capacity
- Annual Report FY25
Terms on this page
- Capital expenditure (capex)
- Credit rating
- Dividend payout ratio
- EBITDA
- FII and DII holding
- Free cash flow
- Market capitalisation
- Net debt
- Net profit
- Operating margin
Each explains the term in plain English, with the same number from other companies on Cityfort.
Go deeper
More detail from the same filings. Open any section.
12What it sells
12What it sells
What does SAIL sell?
Flat steel
Plates, hot- and cold-rolled coils and sheets, galvanised sheets, pipes and electrical steel sheets. They were 46% of FY26 sales value.
Long steel, including rails
Rails, structural sections, wire rods and bars. They were 41% of FY26 sales value. SAIL supplied 12.6 lakh tonnes (1.26 million tonnes) of rails to Indian Railways in FY26.
Alloy and special steel
Special grades from the three smaller plants: 3% of FY26 sales value. SAIL supplied 1.08 lakh tonnes of special steel to defence, nuclear, aerospace and other strategic users in FY26.
By-products
Pig iron, scrap, coal chemicals and other secondary products: 10% of FY26 sales value.
Surplus iron ore
Management said on 28 Oct 2026 that SAIL sold about 2.5 million tonnes of iron ore fines in H1 FY27, against 0.9 million tonnes a year earlier, for a profit of ₹388 crore.
What it does
- Does: Mines all of its own iron ore, from captive mines in Jharkhand, Odisha and Chhattisgarh, CareEdge says
- Does: Makes its own coke from coking coal; management said on 28 Oct 2026 that it buys no coke
- Does: Sells steel made by RINL when RINL has supply: 184,000 tonnes in H1 FY27, management said
- Does: Owns half of NTPC-SAIL Power and has other joint ventures, such as mjunction and Bokaro Power Supply
What it does not do
- Does not: Mine most of its coking coal: management said about 85% of its coal is imported
- Does not: Make all the steel it sells: about 1.17 million tonnes of its FY26 sales were made by NMDC Steel and RINL and bought for resale
- Does not: Get a final price on every government sale up front: some are billed at provisional prices and settled later
13How the money flows
13How the money flows · FY26
How does money flow through SAIL?
Money in
- Revenue from operations₹110,811 cr
- Share of joint ventures' profit, mainly NTPC-SAIL Power₹425 cr
- Other income₹894 cr
The company
SAIL
₹112,130 cr came in
Money out
- Raw materials and goods bought₹55,082 cr
- Power, freight, stores, repairs and other running costs₹32,323 cr
- Employee costs₹11,406 cr
- Depreciation (wear and tear of plants)₹5,988 cr
- Interest and other finance costs₹2,158 cr
- One-off charges (₹668 crore) and tax (₹1,133 crore)₹1,801 cr
- Net profit₹3,373 cr
- In FY26, SAIL's sales brought in ₹110,811 crore, plus ₹894 crore of other income and ₹425 crore as its share of joint ventures' profit.
- Raw materials and goods bought took ₹55,082 crore; power, freight, stores and other running costs took ₹32,323 crore.
- Employees cost ₹11,406 crore, depreciation ₹5,988 crore and interest ₹2,158 crore.
- That left ₹5,174 crore of profit before one-off items and tax, as the company reports it.
- After ₹668 crore of one-off charges and ₹1,133 crore of tax, ₹3,373 crore was profit.
14What it needs to run
14What it needs to run
What does SAIL need to run?
Steel plants
The Ministry of Steel told the Rajya Sabha on 27 Mar 2026 that operational crude steel capacity was 19.676 million tonnes a year: Bhilai 6.16, Bokaro 4.6, Rourkela 3.8, IISCO 2.5, Durgapur 2.2, Alloy Steels 0.234 and Salem 0.18. CareEdge (6 Oct 2026) gives 20.84.
Iron ore mines
Captive mines meet all of SAIL's iron ore needs. CareEdge says reserves were 2,476 million tonnes on 1 Apr 2026, with about 46 million tonnes a year of extraction capacity. SAIL mined 38.07 million tonnes in FY26.
Coking coal
Coal baked into coke for blast furnaces. Management said on 28 Oct 2026 that about 85% of its roughly 19 million tonne coal basket is imported. India Ratings says 2–3% of its coal needs come from SAIL's own blocks.
Power
Captive power plants, plus power from joint ventures: SAIL owns 50% of NTPC-SAIL Power and 50% of Bokaro Power Supply.
People
49,752 employees on 1 Apr 2026, 3,407 fewer than a year earlier. Employees took ₹10.2 of every ₹100 that came in during FY26.
Sources (7)
- Ministry of Steel, Rajya Sabha unstarred question 3982 (answered 27 Mar 2026): SAIL plant-wise capacity
- CareEdge rating rationale (CARE AA; Positive / CARE A1+), 6 Oct 2026, as filed by SAIL
- Results presentation Q4 and FY26
- Earnings call transcript Q2 FY27 (call held 28 Oct 2026)
- India Ratings rationale (upgrade to IND AA+/Stable), as filed by SAIL
- Annual Report FY26 (incl. standalone + consolidated statements)
- Consolidated results Q4 FY26 and FY26, XBRL
15Where it sells
15Where it sells · FY26
Where does SAIL sell?
- India98.9%
- Outside India1.1%
16Where growth could come from
16Where growth could come from
Where could SAIL's growth come from?
Management said in the Q2 FY27 call on 28 Oct 2026 that it expects capital spending of ₹15,000 crore in FY27, more than ₹20,000 crore in FY28 and about ₹25,000 crore in FY29: about ₹120,000 crore over four years. It said FY27 sales would be "somewhere around 21 million tons", against the 22 million tonne target it gave on 16 May 2026.
IISCO (Burnpur) expansion
Early+4.08 million tonnes a year approved (Ministry of Steel)
The Ministry of Steel said on 27 Mar 2026 that SAIL's board had approved the IISCO expansion. Management said on 28 Oct 2026 that major orders had been placed and work had started.
Status: Early, too early to judge.
Bokaro, Durgapur and Bhilai expansions
EarlyBokaro +2.65, Durgapur +0.89 million tonnes a year approved
Both were board-approved by 27 Mar 2026, the Ministry of Steel said. Management said on 28 Oct 2026 that Bokaro was in tendering and that Bhilai tendering would start.
Status: Early, too early to judge.
Tasra coking coal mine
New4.0 million tonnes a year coal block
The FY26 annual report targets the 3.5 million tonne a year washery for Feb 2027. Management said on 28 Oct 2026 that Tasra would start production in Jan 2027.
Status: New, recently announced.
Selling surplus iron ore
WorkingAbout 2.5 million tonnes sold in H1 FY27 (0.9 a year earlier)
Management said on 28 Oct 2026 that iron ore fines sales earned ₹388 crore of profit in H1 FY27, against ₹124 crore a year earlier.
Status: Working, on track against what the company said.
FY27 sales volume
Mixed9.33 million tonnes in H1 FY27
Management set a 22 million tonne FY27 sales target on 16 May 2026 and said on 28 Oct 2026 it now expects about 21, including some RINL steel (184,000 tonnes in H1).
Status: Mixed, partly on track.
Status compares progress with what the company itself said it would do: Working = on track against what the company said; Mixed = partly on track; Behind = behind the company's own plan; New = recently announced; Early = too early to judge.
17Financial strength and debt
17Financial strength · 30 Sep 2026
How much debt does SAIL have?
- Total debt₹31,464 cr
- Cash and investments₹1,727 cr
- Net debt (debt minus cash)₹29,738 cr
- Net worth (shareholders' money)₹62,520 cr
- Debt to equity
- 0.5×
- ₹ of debt for every ₹1 of shareholders' money
- Interest cover
- 5.5×
- how many times operating profit covers interest
- Contingent liabilities
- ₹39,723 cr
- possible future payments, e.g. disputed claims
- Debt here is borrowings plus lease liabilities (rent owed under long leases): ₹20,583 crore of borrowings and ₹10,882 crore of leases on 30 Sep 2026.
- Net debt is a Cityfort calculation from the Q2 FY27 results: ₹31,464 crore − ₹1,727 crore of cash and bank balances = ₹29,738 crore. It was ₹35,967 crore on 31 Mar 2025 (Cityfort calculation from the FY26 annual report).
- Management's debt-to-equity of 0.34 (28 Oct 2026) leaves out leases; the Q2 FY27 results deck's 'Debt (IndAS)' of ₹31,464 crore includes them.
- Lease liabilities rose from ₹3,899 crore on 31 Mar 2022 to ₹10,882 crore on 30 Sep 2026. Debt including leases was highest of the FY22–FY26 year-ends at ₹36,934 crore on 31 Mar 2025, and was ₹31,928 crore on 31 Mar 2026 (Cityfort calculations from the FY23 and FY26 annual reports).
- Interest cover = FY26 EBITDA ₹11,757 crore ÷ finance costs ₹2,158 crore = 5.45 (Cityfort calculation from the FY26 results). The company's standalone figure in the Q2 FY27 deck is 4.89.
- Contingent liabilities (claims and levies the company disputes) are standalone, at 31 Mar 2026: ₹39,723 crore, about 68% of standalone equity of ₹58,195 crore (Cityfort calculation from the FY26 annual report).
- Net worth is total equity on 30 Sep 2026. Subsidiaries are small: FY26 revenue was ₹110,811 crore consolidated and ₹110,810 crore standalone.
Sources (6)
- Financial results Q2 FY27 (standalone + consolidated, with press release)
- Annual Report FY26 (incl. standalone + consolidated statements)
- Consolidated results Q4 FY26 and FY26, XBRL
- Results presentation Q2 and H1 FY27
- Earnings call transcript Q2 FY27 (call held 28 Oct 2026)
- Annual Report FY23 (NSE zip containing the PDF)
18Who owns it
18Who owns it · Q2 FY27
Who owns SAIL?
- Promoters (founders or parent company)65.0%
- Foreign institutions (FII)7.3%
- Indian institutions (DII)16.5%
- Public and others11.2%
Promoter pledge
No promoter shares were pledged in Q2 FY27.
How ownership changed
* Pledged = share of the promoters' own holding reported as pledged. In older filings this can include shares “otherwise encumbered”; the governance flags say when.
Sources (12)
- Shareholding pattern as on 30 Sep 2026 (XBRL filed with NSE)
- Shareholding pattern as on 30 Jun 2026 (XBRL filed with NSE)
- Shareholding pattern as on 31 Mar 2026 (XBRL filed with NSE)
- Shareholding pattern as on 31 Dec 2025 (XBRL filed with NSE)
- Shareholding pattern as on 30 Sep 2025 (XBRL filed with NSE)
- Shareholding pattern as on 30 Jun 2025 (XBRL filed with NSE)
- Shareholding pattern as on 31 Mar 2025 (XBRL filed with NSE)
- Shareholding pattern as on 31 Dec 2024 (XBRL filed with NSE)
- Shareholding pattern as on 30 Sep 2024 (XBRL filed with NSE)
- Shareholding pattern as on 30 Jun 2024 (XBRL filed with NSE)
- Shareholding pattern as on 31 Mar 2024 (XBRL filed with NSE)
- Shareholding pattern as on 31 Dec 2023 (XBRL filed with NSE)
19What it does with profit
19What it does with profit
What does SAIL do with its profit?
Dividend per share
₹2.35FY26
Dividend paid for each share, by financial year.
₹ per share
See the numbers
No buybacks or fund raises in the period covered.
Sources (10)
- Annual Report FY22 (NSE zip containing the PDF)
- Consolidated audited results FY22, XBRL
- Annual Report FY23 (NSE zip containing the PDF)
- Consolidated audited results FY23, XBRL
- Annual Report FY24
- Consolidated audited results FY24, XBRL
- Annual Report FY25
- Consolidated results Q4 FY25 and FY25, XBRL
- Annual Report FY26 (incl. standalone + consolidated statements)
- Consolidated results Q4 FY26 and FY26, XBRL
20Governance signals
20Governance signals
What do SAIL's governance filings show?
- Auditor
- Joint statutory auditors for FY26: APT & Co LLP, J N Gupta & Co LLP, S P A R K & Associates LLP and Vinod Singhal & Co LLP
- Auditor changes
- None in the period covered
- Audit qualifications
- None reported
- Related-party dealings
- SAIL's related parties are mainly its joint ventures, such as NTPC-SAIL Power, Bokaro Power Supply and mjunction, and the Government of India. FY26 sales to the Central Government, including Indian Railways, were ₹11,234 crore, and ₹2,452 crore was owed by it at year end. The company says related-party deals are at arm's length.
- Credit rating
- CareEdge (CARE Ratings); also India Ratings CARE AA (long term) and CARE A1+ (short term), reaffirmed; India Ratings upgraded SAIL to IND AA+ from IND AA in Sep 2026 (outlook Positive (CareEdge, revised from Stable); Stable (India Ratings)), 6 Oct 2026
A credit rating describes the company's ability to repay debt. It is not a rating of the share.
Flags to know about
other · 27 Oct 2026
Board short of independent directors
The auditors' Q2 FY27 review report says the board lacks the required number of independent and non-executive directors, and a woman director. The auditors say the board and certain committees, including the audit and the nomination and remuneration committees, were therefore not in compliance with the Companies Act and SEBI listing rules. Three independent directors' terms ended on 20 Apr 2026.
other · 19 Jan 2024
Suspensions after complaints on policy/pricing decisions, since revoked
On 19 Jan 2024 the Ministry of Steel suspended two directors, and SAIL suspended some officials, after a preliminary vigilance enquiry into complaints about certain policy/pricing decisions. All suspensions were revoked on 28 Jun 2024. The auditors note an investigation to be conducted by external investigative agencies; management says the matter is not likely to have a material impact.
disclosure · 27 Oct 2026
Some government sales are at provisional prices
Revenue includes sales to government agencies at provisional prices: ₹9,724 crore in FY26 and ₹4,776 crore in H1 FY27, with ₹18,767 crore in all up to 31 Mar 2026. The auditors draw attention to it. Q2 FY27 included a ₹309 crore provision for a lower FY25 rail price.
disclosure · 27 Oct 2026
Some group companies missing from quarterly results
The Q2 FY27 consolidated results leave out 2 subsidiaries and 4 joint ventures whose figures were not available; the company says they are not material.
Sources (5)
- Annual Report FY26 (incl. standalone + consolidated statements)
- CareEdge rating rationale (CARE AA; Positive / CARE A1+), 6 Oct 2026, as filed by SAIL
- India Ratings rationale (upgrade to IND AA+/Stable), as filed by SAIL
- Financial results Q2 FY27 (standalone + consolidated, with press release)
- Cessation of independent directors on completion of tenure w.e.f. 20 Apr 2026
21What the market paid
21What the market paid · price as of 11 Nov 2026
What did the market pay for SAIL on 11 Nov 2026?
Price as of 11 Nov 2026 (shown for education; prices change daily).
SAIL's NSE closing price was ₹175.48 as of 11 Nov 2026. Market value is that price × 4,130,525,289 shares (30 Sep 2026 shareholding pattern) = ₹72,482 crore. P/E is the price divided by earnings per share: 12.9 on the four quarters to Q2 FY27 (₹13.57) and 21.5 on FY26 (₹8.17). P/B is market value divided by total equity of ₹62,520 crore on 30 Sep 2026: 1.16. The FY26 dividend of ₹2.35 was 1.34% of the price. All are Cityfort calculations from the NSE bhavcopy of 11 Nov 2026 and the company's filings.
- Share price
- ₹175.48
- Market value (market cap)
- ₹72,482 cr
- P/E
- 12.9×
- P/B
- 1.2×
Source: NSE equity bhavcopy, 11 Nov 2026; Shareholding pattern as on 30 Sep 2026 (XBRL filed with NSE); Consolidated results Q2 FY27, XBRL and 5 more
Sources (8)
- NSE equity bhavcopy, 11 Nov 2026
- Shareholding pattern as on 30 Sep 2026 (XBRL filed with NSE)
- Consolidated results Q2 FY27, XBRL
- Consolidated results Q1 FY27, XBRL
- Consolidated results Q4 FY26 and FY26, XBRL
- Consolidated results Q3 FY26, XBRL (revised filing)
- Financial results Q2 FY27 (standalone + consolidated, with press release)
- Annual Report FY26 (incl. standalone + consolidated statements)
22How it got here
22How it got here
How did SAIL get here?
1973
Milestone
Company incorporated
Steel Authority of India Ltd was incorporated in 1973, according to its FY26 BRSR.
2021
Milestone
Wage revision implemented
A wage revision effective 1 Apr 2020 was implemented in FY22, adding ₹837 crore of employee cost (standalone).
2022
Milestone
FY22 profit of ₹12,243 crore
FY22 profit was ₹12,243 crore on revenue of ₹103,477 crore, an EBITDA margin of 20.7% (Cityfort calculation).
2023
Crisis
Profit fell and debt rose
FY23 profit fell to ₹2,177 crore and operating cash flow was −₹5,290 crore. Debt including leases rose to ₹30,773 crore from ₹17,284 crore (Cityfort calculation from the FY23 annual report).
2024
Crisis
Directors suspended, later reinstated
On 19 Jan 2024 the Ministry of Steel suspended two directors, and SAIL some officials, after a vigilance enquiry into complaints about policy/pricing decisions. The suspensions were revoked on 28 Jun 2024.
2025
Milestone
Selling NMDC Steel's output
SAIL sold about 1.12 million tonnes of steel made by NMDC Steel in FY26, mostly in Apr–Dec 2025, management said. It began selling RINL's steel in Q4 FY26.
2026
Business-model change
Expansions approved
The Ministry of Steel said on 27 Mar 2026 that SAIL's board had approved expansions of 4.08 million tonnes a year at IISCO, 2.65 at Bokaro and 0.89 at Durgapur.
2026
Milestone
New chairman
Chairman Amarendu Prakash resigned with effect from 1 Apr 2026. Dr. Ashok Kumar Panda, the Director (Finance), became Chairman and Managing Director on 9 May 2026.
2026
Milestone
Coking coal blocks with BCCL
On 25 Sep 2026 SAIL signed an MoU with Bharat Coking Coal to develop two coking coal blocks together.
2026
Milestone
Ratings raised
India Ratings upgraded SAIL to IND AA+ (Stable) in Sep 2026. CareEdge reaffirmed CARE AA and revised the outlook to Positive on 6 Oct 2026.
Sources (14)
- Business Responsibility and Sustainability Report FY26
- Annual Report FY22 (NSE zip containing the PDF)
- Consolidated audited results FY22, XBRL
- Consolidated audited results FY23, XBRL
- Annual Report FY23 (NSE zip containing the PDF)
- Annual Report FY24
- Annual Report FY26 (incl. standalone + consolidated statements)
- Earnings call transcript Q4 FY26 (call held 16 May 2026)
- Ministry of Steel, Rajya Sabha unstarred question 3982 (answered 27 Mar 2026): SAIL plant-wise capacity
- Resignation of Shri Amarendu Prakash as CMD w.e.f. 1 Apr 2026
- Appointment of Dr. Ashok Kumar Panda as Chairman & Managing Director w.e.f. 9 May 2026
- Reg. 30 intimation: MoU with BCCL for joint development of two coking coal blocks
- India Ratings rationale (upgrade to IND AA+/Stable), as filed by SAIL
- CareEdge rating rationale (CARE AA; Positive / CARE A1+), 6 Oct 2026, as filed by SAIL
23Sources and changes
Where every number on this page comes from
Sources (48 documents)
- S1Annual Report FY26 (incl. standalone + consolidated statements) · SAIL (filed with NSE) · Tier 1: company or exchange filing · 1 Sep 2026
- S2Annual Report FY25 · SAIL (filed with NSE) · Tier 1: company or exchange filing · 25 Aug 2025
- S3Annual Report FY24 · SAIL (filed with NSE) · Tier 1: company or exchange filing · 4 Sep 2024
- S4Annual Report FY23 (NSE zip containing the PDF) · SAIL (filed with NSE) · Tier 1: company or exchange filing · 5 Sep 2023
- S5Annual Report FY22 (NSE zip containing the PDF) · SAIL (filed with NSE) · Tier 1: company or exchange filing · 6 Sep 2022
- S6Financial results Q2 FY27 (standalone + consolidated, with press release) · SAIL (filed with NSE) · Tier 1: company or exchange filing · 27 Oct 2026
- S7Consolidated results Q2 FY27, XBRL · SAIL (filed with NSE) · Tier 1: company or exchange filing · 27 Oct 2026
- S8Financial results Q1 FY27 (standalone + consolidated, with press release) · SAIL (filed with NSE) · Tier 1: company or exchange filing · 24 Jul 2026
- S9Consolidated results Q1 FY27, XBRL · SAIL (filed with NSE) · Tier 1: company or exchange filing · 24 Jul 2026
- S10Financial results Q4 FY26 and FY26 (standalone + consolidated, with press release) · SAIL (filed with NSE) · Tier 1: company or exchange filing · 15 May 2026
- S11Consolidated results Q4 FY26 and FY26, XBRL · SAIL (filed with NSE) · Tier 1: company or exchange filing · 15 May 2026
- S13Consolidated results Q3 FY26, XBRL (revised filing) · SAIL (filed with NSE) · Tier 1: company or exchange filing · 31 Jan 2026
- S14Financial results Q2 FY26 (standalone + consolidated, with press release) · SAIL (filed with NSE) · Tier 1: company or exchange filing · 29 Oct 2025
- S15Consolidated results Q2 FY26, XBRL · SAIL (filed with NSE) · Tier 1: company or exchange filing · 29 Oct 2025
- S17Consolidated results Q1 FY26, XBRL · SAIL (filed with NSE) · Tier 1: company or exchange filing · 25 Jul 2025
- S18Financial results Q4 FY25 and FY25 (standalone + consolidated, with press release) · SAIL (filed with NSE) · Tier 1: company or exchange filing · 28 May 2025
- S19Consolidated results Q4 FY25 and FY25, XBRL · SAIL (filed with NSE) · Tier 1: company or exchange filing · 28 May 2025
- S21Consolidated results Q3 FY25, XBRL · SAIL (filed with NSE) · Tier 1: company or exchange filing · 12 Feb 2025
- S22Consolidated audited results FY24, XBRL · SAIL (filed with NSE) · Tier 1: company or exchange filing · 21 May 2024
- S23Consolidated audited results FY23, XBRL · SAIL (filed with NSE) · Tier 1: company or exchange filing · 26 May 2023
- S24Consolidated audited results FY22, XBRL · SAIL (filed with NSE) · Tier 1: company or exchange filing · 24 May 2022
- S27Results presentation Q2 and H1 FY27 · SAIL (filed with NSE) · Tier 1: company or exchange filing · 27 Oct 2026
- S30Results presentation Q4 and FY26 · SAIL (filed with NSE) · Tier 1: company or exchange filing · 15 May 2026
- S37Earnings call transcript Q2 FY27 (call held 28 Oct 2026) · SAIL (filed with NSE) · Tier 1: company or exchange filing · 31 Oct 2026
- S39Earnings call transcript Q4 FY26 (call held 16 May 2026) · SAIL (filed with NSE) · Tier 1: company or exchange filing · 20 May 2026
- S40Earnings call transcript Q3 FY26 (call held 2 Feb 2026) · SAIL (filed with NSE) · Tier 1: company or exchange filing · 6 Feb 2026
- S41CareEdge rating rationale (CARE AA; Positive / CARE A1+), 6 Oct 2026, as filed by SAIL · CARE Ratings Ltd (filed by SAIL with NSE) · Tier 2: rating agency or regulator · 7 Oct 2026
- S42India Ratings rationale (upgrade to IND AA+/Stable), as filed by SAIL · India Ratings and Research (filed by SAIL with NSE) · Tier 2: rating agency or regulator · 3 Sep 2026
- S43Business Responsibility and Sustainability Report FY26 · SAIL (filed with NSE) · Tier 1: company or exchange filing · 1 Sep 2026
- S44Shareholding pattern as on 31 Dec 2023 (XBRL filed with NSE) · SAIL (filed with NSE) · Tier 1: company or exchange filing · 12 Jan 2024
- S45Shareholding pattern as on 31 Mar 2024 (XBRL filed with NSE) · SAIL (filed with NSE) · Tier 1: company or exchange filing · 18 Apr 2024
- S46Shareholding pattern as on 30 Jun 2024 (XBRL filed with NSE) · SAIL (filed with NSE) · Tier 1: company or exchange filing · 16 Jul 2024
- S47Shareholding pattern as on 30 Sep 2024 (XBRL filed with NSE) · SAIL (filed with NSE) · Tier 1: company or exchange filing · 19 Oct 2024
- S48Shareholding pattern as on 31 Dec 2024 (XBRL filed with NSE) · SAIL (filed with NSE) · Tier 1: company or exchange filing · 30 Jan 2025
- S49Shareholding pattern as on 31 Mar 2025 (XBRL filed with NSE) · SAIL (filed with NSE) · Tier 1: company or exchange filing · 19 Apr 2025
- S50Shareholding pattern as on 30 Jun 2025 (XBRL filed with NSE) · SAIL (filed with NSE) · Tier 1: company or exchange filing · 21 Jul 2025
- S51Shareholding pattern as on 30 Sep 2025 (XBRL filed with NSE) · SAIL (filed with NSE) · Tier 1: company or exchange filing · 17 Oct 2025
- S52Shareholding pattern as on 31 Dec 2025 (XBRL filed with NSE) · SAIL (filed with NSE) · Tier 1: company or exchange filing · 19 Jan 2026
- S53Shareholding pattern as on 31 Mar 2026 (XBRL filed with NSE) · SAIL (filed with NSE) · Tier 1: company or exchange filing · 20 Apr 2026
- S54Shareholding pattern as on 30 Jun 2026 (XBRL filed with NSE) · SAIL (filed with NSE) · Tier 1: company or exchange filing · 17 Jul 2026
- S55Shareholding pattern as on 30 Sep 2026 (XBRL filed with NSE) · SAIL (filed with NSE) · Tier 1: company or exchange filing · 21 Oct 2026
- S56NSE equity bhavcopy, 11 Nov 2026 · NSE · Tier 1: company or exchange filing · 11 Nov 2026
- S57Reply to NSE on news of a possible FPO (Reg. 30(11) rumour verification) · SAIL (filed with NSE) · Tier 1: company or exchange filing · 10 Aug 2026
- S59Reg. 30 intimation: MoU with BCCL for joint development of two coking coal blocks · SAIL (filed with NSE) · Tier 1: company or exchange filing · 25 Sep 2026
- S60Appointment of Dr. Ashok Kumar Panda as Chairman & Managing Director w.e.f. 9 May 2026 · SAIL (filed with NSE) · Tier 1: company or exchange filing · 9 May 2026
- S61Resignation of Shri Amarendu Prakash as CMD w.e.f. 1 Apr 2026 · SAIL (filed with NSE) · Tier 1: company or exchange filing · 2 Apr 2026
- S62Cessation of independent directors on completion of tenure w.e.f. 20 Apr 2026 · SAIL (filed with NSE) · Tier 1: company or exchange filing · 21 Apr 2026
- S63Ministry of Steel, Rajya Sabha unstarred question 3982 (answered 27 Mar 2026): SAIL plant-wise capacity · Ministry of Steel, Government of India · Tier 2: rating agency or regulator · 27 Mar 2026
Changes to this page (v1 · 12 Nov 2026)
- v1 · 12 Nov 2026First version. (first version)
Numbers come only from tier 1 and tier 2 sources. Read how we research.
Disclaimer
For learning only. Cityfort is not a SEBI-registered adviser and does not recommend buying or selling any security. Prices shown are dated and may be out of date.
Investing in securities involves risk, including loss of capital. Before making any investment decision, do your own research and consider consulting a SEBI-registered investment adviser.
Cityfort, its owners and contributors may or may not hold securities of companies covered. Content is not an offer or solicitation to buy or sell any security.
Read the full disclaimerHide the full disclaimer
Cityfort publishes educational content that explains how listed companies work. Cityfort is not registered with the Securities and Exchange Board of India (SEBI) as an Investment Adviser or Research Analyst and does not provide investment advice, recommendations, ratings, price targets or any opinion on whether to buy, sell or hold any security.
All information is taken from publicly available sources, mainly company filings on BSE and NSE, which are listed on each page with dates. We work to keep it accurate and correct errors publicly, but we do not guarantee that it is complete, accurate or up to date. Any market price or price-based ratio shown is dated, may be out of date by the time you read it, and is included only to explain concepts.
Statements by company management are reported as statements, with their date and source; they are not our forecasts.