Information Technology · NSE: ESDS · BSE: 544898
ESDS: how the business works
ESDS Software Solution rents cloud computing, data-centre space and software to government bodies, banks and companies from five Indian data centres, and earned ₹472 crore of revenue in FY26.
Follow ESDS
Email me when ESDS's page is updated after results.
We store your email address with Kit, our email provider, which also records when you sign up and whether you open or click our emails. We send a confirmation email first. See our privacy policy.
ESDS Software Solution Limited · Nashik, Maharashtra · Founded 2005
Updated for Q2 FY27 · checked
- Revenue, FY26
- ₹472 cr
- Profit, FY26
- ₹120 cr
- Data centres in India
- 5
- Founded
- 2005
- Promoter holding, 30 Sep 2026
- 39.47%
The short version
ESDS in 5 points
1 · What it sells
ESDS rents cloud computing and data-centre space, runs customers' systems and sells software from five data centres in India, with revenue of ₹472.21 crore in FY26.
2 · Who pays it
By the RHP's classification, enterprises paid 55.1% of ESDS's FY26 revenue, government bodies 27.4% and banks and financial firms 17.5%.
3 · What it keeps from ₹100
Of every ₹100 that came in during FY26, ESDS kept ₹25.1 as profit in a year with ₹75.24 crore of GPU-cluster design revenue that management called one-time, and its EBITDA margin was 49.6% in FY26 and 41.8% in Q2 FY27.
4 · Where the operating profit comes from
ESDS reports one business segment and no profit by service line; its FY26 EBITDA (Cityfort calculation) was ₹234 crore on revenue of ₹472.21 crore, of which cloud and data-centre rental was ₹207.20 crore and managed services ₹194.59 crore.
5 · The one thing to watch
ESDS held a ₹1,176.6 crore customer advance for a GPU rental service whose go-live moved from September 2026 in the RHP to as late as 17 Dec 2026 on the 2 Nov 2026 call.
Sources: From ESDS's RHP, FY26 annual report, Q2 FY27 results, presentation and call, and India Ratings' report · checked
Sources (5)
- ESDS Software Solution Ltd: Red Herring Prospectus (IPO)
- ESDS Software Solution: Annual Report 2025-26
- ESDS Software Solution: Transcript of Q1 FY27 earnings call (25 Sep 2026)
- ESDS Software Solution: Unaudited results, quarter and half year ended 30 Sep 2026 (Q2 FY27)
- ESDS Software Solution: Transcript of Q2 FY27 earnings call (2 Nov 2026)
01Where the money goes · FY26
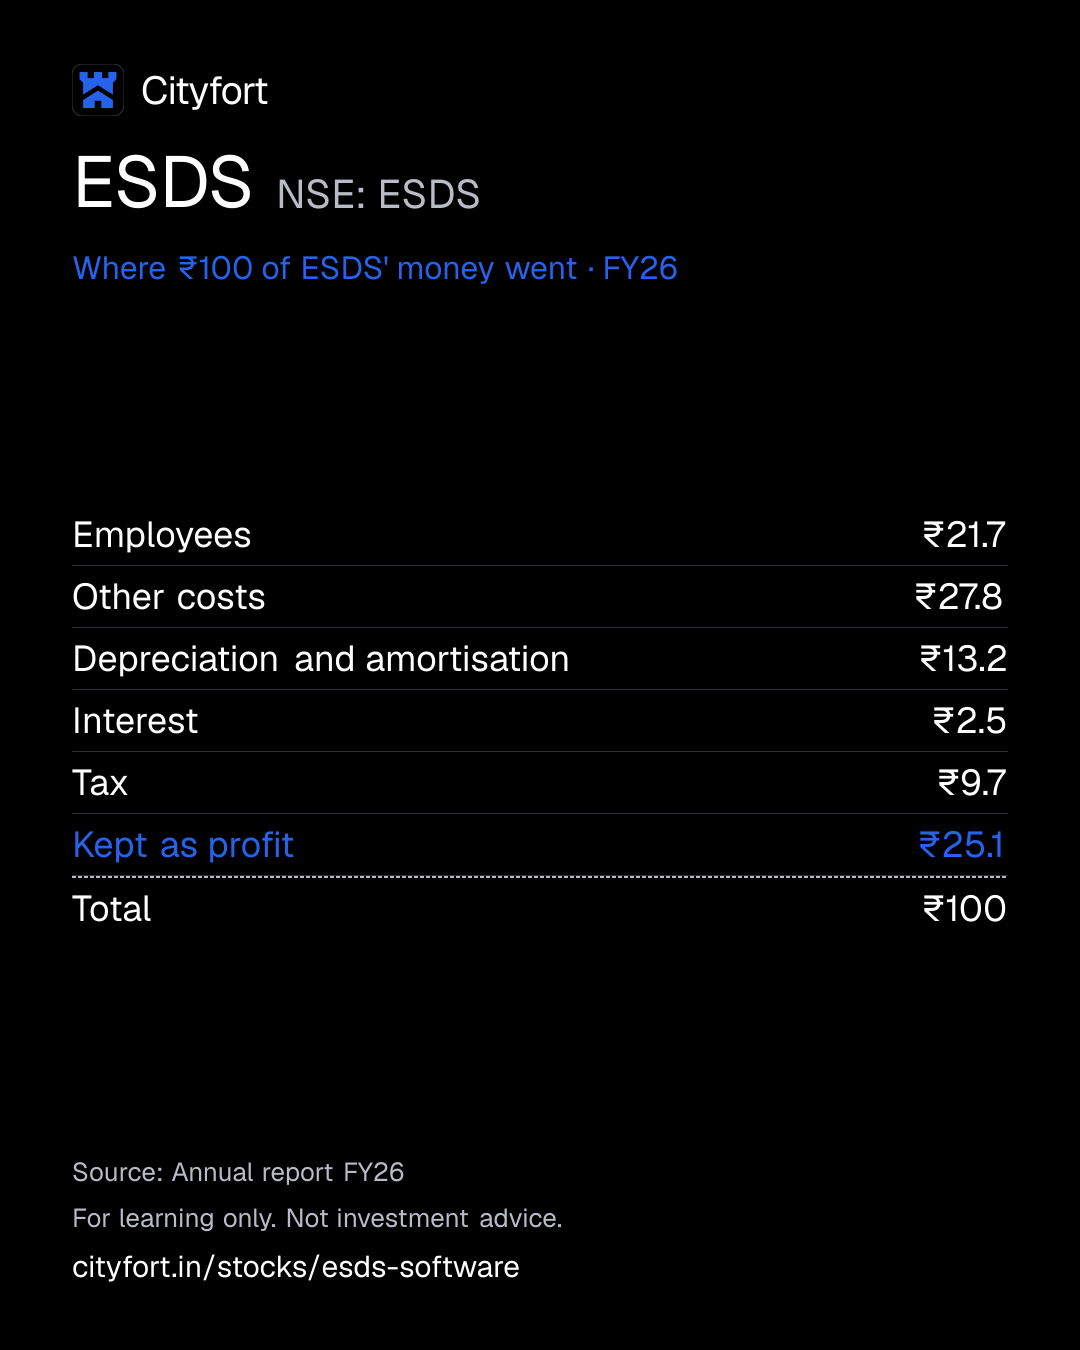
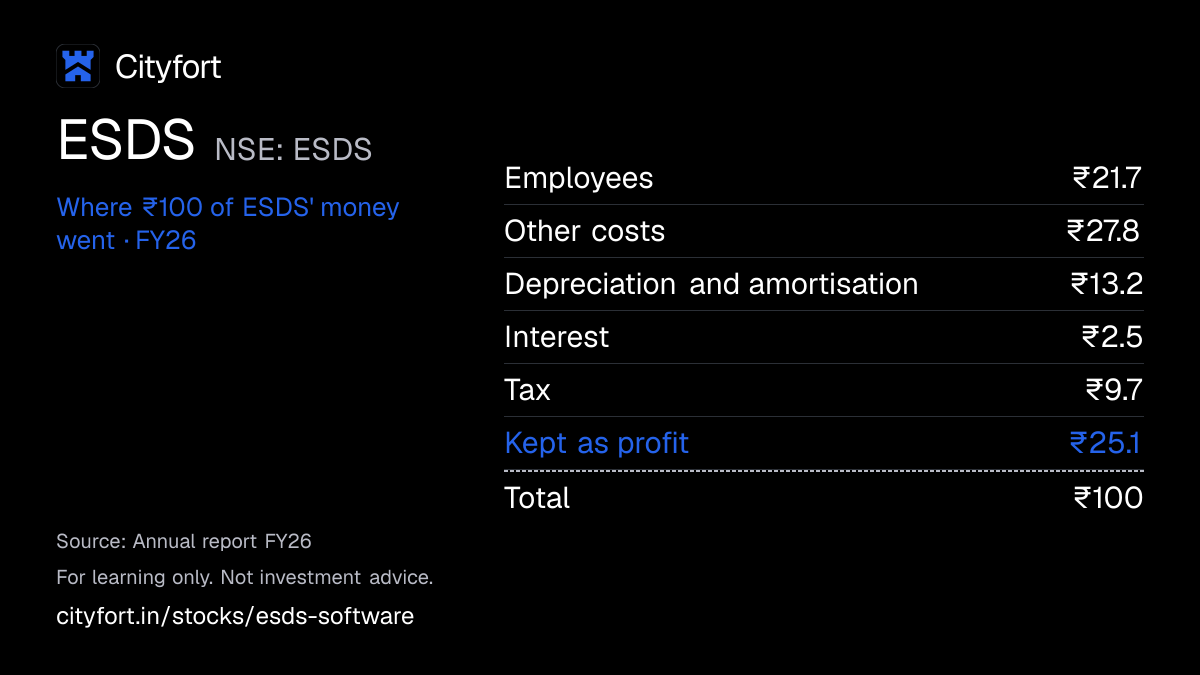
Where does ₹100 of ESDS' money go?
ESDS · FY26
Receipt for every ₹100
| Employees | ₹21.7 |
|---|---|
| Other costs | ₹27.8 |
| Depreciation and amortisation | ₹13.2 |
| Interest | ₹2.5 |
| Tax | ₹9.7 |
| Kept as profit | ₹25.1 |
| Total | ₹100 |
Each line = amount ÷ total money in × 100. Lines may not add to exactly ₹100 because of rounding.
How this is worked out
Each line = line ÷ total money in × 100 (Cityfort calculation from the FY26 annual report). Money in is ₹480.65 crore: revenue ₹472.21 crore plus other income ₹8.44 crore. FY26 revenue included ₹75.24 crore from a new overseas customer for GPU-cluster design work, which management called one-time.
Save this receipt as an image
Embed this receipt or the key numbers
Paste this code into a blog or website to show the card you choose, with a link back to this page.
Each week: the next company due to report results, explained in 5 points.
We'll email you once a week with what changed on Cityfort. Facts only, no tips. Unsubscribe any time.
We store your email address with Kit, our email provider, which also records when you sign up and whether you open or click our emails. We send a confirmation email first. See our privacy policy.
02The business in one line
What does ESDS do?
Government bodies, banks and companies pay ESDS to host and run their computer systems in its cloud and data centres; most of the money goes on staff and running costs, and ₹25.1 of every ₹100 that came in during FY26 was profit.
- In FY26, 43.9% of revenue came from renting cloud computing and data-centre space, 41.2% from managed services and 14.9% from software sold as a service.
- ESDS's subsidiary SPOCHUB received a ₹1,176.6 crore advance in FY26 from an overseas customer for a GPU rental contract, but no GPU rental revenue appears in any period filed up to Q2 FY27.
03Who pays it
Who pays ESDS?
Enterprises
55.1%
of revenue
Private companies outside banking and finance: ₹260.16 crore in FY26, up from ₹143.12 crore in FY25.
Government bodies
27.4%
of revenue
Government departments and projects: ₹129.26 crore in FY26. ESDS's government community cloud had 104 government clients at 30 Jun 2026.
Banks and financial firms (BFSI)
17.5%
of revenue
Banks, insurers and other financial firms: ₹82.79 crore in FY26, down from ₹111.54 crore in FY25. 115 banks and financial institutions used its banking community cloud at 30 Jun 2026.
- Enterprises55.1%
- Government bodies27.4%
- Banks and financial firms (BFSI)17.5%
Customer concentration
Shares are of FY26 revenue (₹472.21 crore) by customer industry, as classified in the RHP. The largest customer paid ₹75.24 crore in FY26. The Q2 FY27 presentation uses a different classification (banks and financial firms 46.4% of H1 FY27 revenue), so the two splits do not compare. Customers fell from 2,216 in Q1 FY27 to 1,709 in Q2 FY27; management said on 2 Nov 2026 it is moving small customers to an internal unit.
- Largest customer
- 16%
- Top 5 customers
- 35%
- Top 10 customers
- 45%
04How it makes money
How does ESDS make money?
From FY22 to FY26 ESDS's revenue grew faster than its staff costs and depreciation, so more of each ₹100 of revenue was left as EBITDA.
From FY22 to FY26 revenue rose 141.7%, staff costs 47.3%, depreciation and amortisation 47.8% and other expenses 103.0% (Cityfort calculations). EBITDA margin rose from 28.2% to 49.6%, but FY26 included ₹75.24 crore of GPU-cluster design revenue that management called one-time, and the margin was 41.8% in Q2 FY27.
EBITDA margin (Cityfort calculation)
28.2%49.6%
FY22 to FY26
- ESDS builds data centres and fills them with servers and storage: five data centres in India.
- Government bodies, banks and companies rent computing, storage and space: 2,501 customers in FY26.
- ESDS also runs those systems for a fee and sells its own software as a service.
- Staff costs rose 47.3% from FY22 to FY26 while revenue rose 141.7% (Cityfort calculations).
- EBITDA margin rose from 28.2% in FY22 to 49.6% in FY26, a year with ₹75.24 crore of design revenue management called one-time.
- The GPU contract signed in 2026 pairs rental to one customer with a US$1,250 million service fee ESDS pays SharonAI, India Ratings says.
↺ Step 6 feeds back into step 1.
05Business segments · FY26
Which businesses make up ESDS?
Cloud and data-centre rental (IaaS)
43.9%Renting computing, storage and data-centre space: cloud services ₹167.89 crore and colocation ₹39.31 crore in FY26. These are service lines. ESDS reports a single business segment, so profit by service line is not disclosed.
Revenue ₹207 cr
Managed services
41.2%Running customers' systems for a fee; FY26 included ₹75.24 crore from a new overseas customer for GPU-cluster design work, which management called one-time.
Revenue ₹195 cr
Software as a service (SaaS)
14.9%Software customers use over the internet; down from ₹82.04 crore in FY25.
Revenue ₹70.4 cr
How the mix changed
- Cloud and data-centre rental (IaaS)
- Managed services
- Software as a service (SaaS)
Revenue by segment, FY24 to FY26.
₹ crore
See the numbers
06The numbers · Consolidated · ₹ crore
How has ESDS done?
Revenue
₹472 crFY26
Revenue rose every year from ₹195.36 crore in FY22 to ₹472.21 crore in FY26, and Q2 FY27 revenue was ₹138.34 crore against ₹93.78 crore a year earlier; no filing gives Q3 FY26 on its own.
₹ crore
See the numbers
Net profit
₹120 crFY26
Profit went from a ₹22.45 crore loss in FY23 to ₹120.28 crore in FY26; quarterly profit includes minority holders' small share, and the Q1, Q2 and Q4 FY26 figures were prepared by management and not audited or reviewed.
₹ crore
See the numbers
Net profit for every ₹100 of revenue
₹25.5FY26
EBITDA margin (Cityfort calculation on reported profit before tax) rose from 20.6% in FY23 to 49.6% in FY26, a year that included ₹75.24 crore of GPU-cluster design revenue from a new overseas customer that management called one-time, and was 41.8% in Q2 FY27.
Net margin: ₹ of net profit per ₹100 of revenue
See the numbers
Free cash flow
₹1,242 crFY26
FY26 operating cash flow of ₹1,367.71 crore includes a ₹1,176.6 crore advance from an overseas customer for the GPU contract; without it, operating cash flow would have been about ₹191 crore (Cityfort calculation).
₹ crore · cash from operations minus spending on plants and equipment
See the numbers
See all yearly numbers
EBITDA = profit before interest, tax and wear-and-tear of assets. Financial year runs April to March (March year end). Yearly net profit is the share belonging to the company's owners; quarterly net profit includes minority shareholders' share, as the quarterly filings give it.
Sources (8)
- ESDS Software Solution: Annual Report 2022-23
- ESDS Software Solution: Annual Report 2023-24
- ESDS Software Solution Ltd: Red Herring Prospectus (IPO)
- ESDS Software Solution: Annual Report 2025-26
- ESDS Software Solution: Unaudited results, quarter ended 30 Jun 2026 (Q1 FY27)
- ESDS Software Solution: Unaudited results, quarter and half year ended 30 Sep 2026 (Q2 FY27)
- ESDS Software Solution: Integrated filing (financials, consolidated) XBRL, Q1 FY27
- ESDS Software Solution: Integrated filing (financials, consolidated) XBRL, Q2 FY27
07Who runs it
Who runs ESDS, and did they deliver?
Piyush Somani
Chairman and Managing Director
Promoter; held 21.03% of the shares at 30 Sep 2026. He also holds 0.50% of the subsidiary SPOCHUB, the RHP says.
Sushil Kadu
Chief Product Officer · since 2026
Appointed on 2 Nov 2026.
Sajiv Nair
Chief Technology Officer and Chief Information Officer (resigned)
Resigned for personal reasons, as filed on 30 Oct 2026; last day on or before 27 Jan 2027.
What they said, and what happened
1 missed · 2 too early to tell
Said on 24 Aug 2026
The RHP said delivery of the GPU cluster was "targeted for completion by September 2026".
MissedWhat happened
On 25 Sep 2026 management said it expected go-live in the first week of November; on 2 Nov 2026 Piyush Somani gave early December to 17 Dec 2026.
Said on 24 Aug 2026
The RHP said revenue from the GPU contract was expected to start in the third quarter of FY27 (Oct–Dec 2026).
Too early to tellWhat happened
On 2 Nov 2026 Piyush Somani said ESDS expects to book one month of GPU revenue in Q3 FY27.
Said on 24 Aug 2026
The RHP planned ₹432.0 crore of IPO money for cloud computing equipment in FY27 and ₹144.0 crore in FY28.
Too early to tellWhat happened
None of the ₹576.0 crore had been spent by 30 Sep 2026, the Q2 FY27 presentation says.
Sources (7)
- ESDS Software Solution: Shareholding pattern, 30 Sep 2026 (XBRL)
- ESDS Software Solution Ltd: Red Herring Prospectus (IPO)
- ESDS Software Solution: Unaudited results, quarter and half year ended 30 Sep 2026 (Q2 FY27)
- ESDS Software Solution: Resignation of Chief Technology Officer and Chief Information Officer (Reg. 30)
- ESDS Software Solution: Transcript of Q1 FY27 earnings call (25 Sep 2026)
- ESDS Software Solution: Transcript of Q2 FY27 earnings call (2 Nov 2026)
- ESDS Software Solution: Investor presentation, Q2 FY27
08What could go wrong
What could go wrong for ESDS?
- Concentration
One large GPU contract with one customer and one supplier
ESDS's subsidiary SPOCHUB rents GPU capacity to one overseas enterprise customer, not named in the filings, which paid a ₹1,176.6 crore advance. India Ratings says ESDS pays SharonAI a service fee of US$1,250 million over five years for that capacity.
Watch Whether the Q3 FY27 results show the first GPU rental revenue, and how the advance in liabilities changes.
- Execution
GPU go-live dates have moved
The RHP of 24 Aug 2026 targeted completion by September 2026. On 25 Sep 2026 management said the first week of November, and on 2 Nov 2026 Piyush Somani said early December to 17 Dec 2026.
Watch A filing that the GPU capacity is ready for service, and the date given.
- Pricing
India Ratings expects lower margins with GPU rental
India Ratings said on 29 Sep 2026 it expects EBITDA margin "to moderate to 25%-30%" with the GPU contract. Management said on 25 Sep 2026 its target profit margin on GPU leasing deals is 15% to 20%.
Watch EBITDA margin in the Q3 and Q4 FY27 results (41.8% in Q2 FY27).
- Concentration
A few customers pay much of the revenue
The largest customer paid 15.9%, the top five 34.9% and the top ten 45.4% of FY26 revenue. India Ratings said concentration eased in FY26 partly because revenue from a Russian financial institution fell under economic sanctions.
Watch Top-customer shares in the FY27 annual report.
- Demand
One-time revenue in FY26
FY26 managed services included ₹75.24 crore from a new overseas customer, the RHP shows, for GPU-cluster design work management called one-time. EBITDA margin was 61.2% in Q4 FY26 and 41.9% and 41.8% in Q1 and Q2 FY27 (Cityfort calculations).
Watch Managed services revenue each quarter (₹42.88 crore in Q2 FY27).
- Legal
Tax cases and a former employee's claim
The RHP lists 6 tax proceedings and 1 material civil suit against the company, ₹25.05 crore in total; a former employee claims he was entitled to 1% of the shares, allegedly offered in 2015, or ₹18.48 crore. It also notes delayed TDS payments for assessment years 2017-18, 2018-19 and 2020-21 to 2022-23, settled with ₹0.61 crore of compounding charges paid on 4 Apr 2025.
Watch Litigation and contingent-liability notes in the annual report.
Sources (7)
- ESDS Software Solution Ltd: Red Herring Prospectus (IPO)
- India Ratings upgrades ESDS Software Solution bank loan facilities to IND A/Stable/IND A1
- ESDS Software Solution: Transcript of Q1 FY27 earnings call (25 Sep 2026)
- ESDS Software Solution: Transcript of Q2 FY27 earnings call (2 Nov 2026)
- ESDS Software Solution: Investor presentation, Q2 FY27
- ESDS Software Solution: Unaudited results, quarter ended 30 Jun 2026 (Q1 FY27)
- ESDS Software Solution: Unaudited results, quarter and half year ended 30 Sep 2026 (Q2 FY27)
09Supporters and critics
What do supporters and critics point to?
What supporters point to
- Revenue rose every year from ₹195.36 crore in FY22 to ₹472.21 crore in FY26, and profit went from a ₹22.45 crore loss in FY23 to ₹120.28 crore in FY26.
- Q2 FY27 revenue was ₹138.34 crore, up 47.5% from ₹93.78 crore a year earlier.
- India Ratings upgraded its rating to IND A/Stable on 29 Sep 2026, and CRISIL to A-/Positive on 16 Sep 2026.
- Borrowings were ₹48.05 crore at 30 Sep 2026, against cash and cash equivalents of ₹1,636.83 crore.
- Its community clouds served 104 government clients and 115 banks and financial institutions at 30 Jun 2026.
What critics point to
- FY26 included ₹75.24 crore of GPU-cluster design revenue that management called one-time; EBITDA margin was 49.6% in FY26 and 41.8% in Q2 FY27.
- The GPU go-live moved from September 2026 in the RHP to as late as 17 Dec 2026 on the 2 Nov 2026 call.
- India Ratings says ESDS pays SharonAI US$1,250 million over five years, while the capacity is rented to one unnamed customer.
- The top ten customers paid 45.4% of FY26 revenue.
- The Q1, Q2 and Q4 FY26 figures were not audited or reviewed, and no filing gives Q3 FY26 on its own.
10What to watch next
What should you watch next at ESDS?
Next event
Q3 FY27 results (date not announced as of 12 Nov 2026; this will be ESDS's first Q3 filing as a listed company)
Date not announced yet.
GPU go-live
Piyush Somani said on 2 Nov 2026 the capacity would be ready for service by 17 Dec 2026 at the latest; the RHP had targeted September 2026.
First GPU rental revenue
The RHP expected it to start in Q3 FY27; no filed period up to Q2 FY27 includes it.
Margin after the one-off
EBITDA margin was 49.6% in FY26 and 41.8% in Q2 FY27; India Ratings said on 29 Sep 2026 it expects 25% to 30% with the GPU contract.
11Key facts
Key facts about ESDS
- What does ESDS Software Solution do?
- ESDS Software Solution is a Nashik company that rents cloud computing and data-centre space, manages customers' IT systems and sells software as a service. ESDS runs five data centres in India, at Nashik, Navi Mumbai, Bengaluru, Mohali and Noida.
- How does ESDS Software Solution make money?
- In FY26 ESDS Software Solution earned ₹207.20 crore (43.9% of revenue) from renting cloud computing and data-centre space, ₹194.59 crore (41.2%) from managed services and ₹70.42 crore (14.9%) from software as a service, its RHP shows.
- Who are ESDS Software Solution's customers?
- By the RHP's classification, enterprises paid 55.1% of ESDS Software Solution's FY26 revenue, government bodies 27.4% and banks and financial firms 17.5%. ESDS's largest customer was 15.9% of FY26 revenue and its top ten customers 45.4%.
- How big is ESDS Software Solution?
- ESDS Software Solution's revenue was ₹472.21 crore in FY26, up 30.7% (Cityfort calculation) from ₹361.34 crore in FY25, and its profit was ₹120.28 crore. In Q2 FY27 (Jul–Sep 2026) its revenue was ₹138.34 crore and profit ₹31.09 crore.
- Who owns ESDS Software Solution?
- At 30 Sep 2026 ESDS Software Solution's promoters and promoter group held 39.47% of the shares (Piyush Somani 21.03%, P.O. Somani Family Trust 9.58%, Komal Somani 8.68%), none pledged. Domestic institutions held 6.58% (mutual funds 5.03%), foreign investors 0.60%, an employee benefit trust 1.09% and individuals and other non-institutional holders 52.26%.
- When did ESDS Software Solution list on the stock market?
- ESDS Software Solution listed on NSE and BSE on 4 Sep 2026 after an IPO at ₹429 a share. All 16,783,216 shares in the IPO were new shares, raising ₹719.99 crore for the company; no existing shareholder sold shares in it.
- What is ESDS Software Solution's GPU contract with SharonAI?
- On 31 Mar 2026 ESDS Software Solution signed a five-year agreement, with a two-year option, under which Australia-based SharonAI deploys and operates about 8,208 NVIDIA B300 GPUs in a data centre in Australia. India Ratings describes the US$1,250 million in the agreement as a service fee ESDS pays over five years; ESDS's subsidiary SPOCHUB rents the capacity to an overseas enterprise customer, which paid an advance of ₹1,176.6 crore.
Sources (7)
- ESDS Software Solution Ltd: Red Herring Prospectus (IPO)
- ESDS Software Solution: Investor presentation, Q2 FY27
- ESDS Software Solution: Annual Report 2025-26
- ESDS Software Solution: Unaudited results, quarter and half year ended 30 Sep 2026 (Q2 FY27)
- ESDS Software Solution: Shareholding pattern, 30 Sep 2026 (XBRL)
- NSE public issue page: ESDS Software Solution Ltd (issue details, bids, listing date)
- India Ratings upgrades ESDS Software Solution bank loan facilities to IND A/Stable/IND A1
Terms on this page
- Capital expenditure (capex)
- Credit rating
- Customer concentration
- EBITDA
- FII and DII holding
- Free cash flow
- Market capitalisation
- Net debt
- Net profit
- Operating margin
Each explains the term in plain English, with the same number from other companies on Cityfort.
Go deeper
More detail from the same filings. Open any section.
12What it sells
12What it sells
What does ESDS sell?
Cloud and data-centre rental (IaaS)
Infrastructure as a service: customers rent computing and storage on ESDS's cloud (₹167.89 crore in FY26) or space for their own servers in its data centres, called colocation (₹39.31 crore).
Managed services
ESDS runs and looks after customers' systems for a fee: ₹194.59 crore in FY26, up from ₹75.65 crore in FY25. ₹75.24 crore of FY26 revenue came from a new overseas enterprise customer, the RHP shows; management called that GPU-cluster design work one-time.
Software as a service (SaaS)
Software customers use over the internet and pay for as a service: ₹70.42 crore in FY26, down from ₹82.04 crore in FY25.
Community clouds for government and banks
Shared clouds built for one type of user. At 30 Jun 2026 they served 104 government clients, 115 banks and financial institutions across 1,045 branches, 113 SAP HANA organisations and 6 smart cities.
GPU rental (GPU as a service)
Renting out AI computing chips (GPUs). ESDS's subsidiary SPOCHUB has a contract with an overseas enterprise customer, using GPUs in Australia that SharonAI deploys and operates. No filed period up to Q2 FY27 includes revenue from it.
What it does
- Does: Runs five data centres in India, at Nashik, Navi Mumbai, Bengaluru, Mohali and Noida, all certified Tier 3.
- Does: Runs community clouds for 104 government clients and 115 banks and financial institutions (30 Jun 2026).
- Does: Sells abroad too: 25.5% of FY26 revenue came from customers outside India.
What it does not do
- Does not: Has not yet earned GPU rental revenue: none appears in any period filed up to Q2 FY27.
- Does not: Does not hold a US$1,250 million customer order: India Ratings says that sum is the service fee ESDS pays SharonAI over five years.
13How the money flows
13How the money flows · FY26
How does money flow through ESDS?
Money in
- Revenue from operations (cloud, data-centre, managed services and software)₹472 cr
- Other income₹8.4 cr
The company
ESDS
₹481 cr came in
Money out
- Employees₹104 cr
- Other expenses₹134 cr
- Depreciation and amortisation₹63.5 cr
- Interest₹11.8 cr
- Tax₹46.6 cr
- Net profit (incl. ₹0.54 crore for minority holders)₹121 cr
- In FY26 ESDS earned ₹472.21 crore from customers and ₹8.44 crore of other income.
- That included ₹75.24 crore from a new overseas customer for GPU-cluster design work, which management called one-time.
- Staff cost ₹104.42 crore and other expenses ₹133.56 crore.
- Depreciation and amortisation took ₹63.46 crore and interest ₹11.79 crore.
- After ₹46.60 crore of tax, ₹120.82 crore was left as profit, ₹120.28 crore of it for ESDS's shareholders.
14What it needs to run
14What it needs to run
What does ESDS need to run?
Data centres
Five data centres with more than 75,266 sq ft combined. Bengaluru, Mohali and Noida run under agreements with STPI (Software Technology Parks of India, a government body); Kolkata and Sahibabad are proposed.
GPU capacity from SharonAI
For the GPU contract, SharonAI deploys and operates about 8,208 NVIDIA B300 GPUs in Australia. India Ratings says ESDS pays a service fee of US$1,250 million over five years.
Own cloud software
SWARAJ Cloud (called eNlight Cloud until June 2026) uses a vertical autoscaling technology patented in the US and India. R&D spend was ₹6.25 crore in FY26, 1.32% of revenue.
People
980 employees at 30 Sep 2026; staff cost was ₹104.42 crore in FY26.
IPO money for equipment
₹576.0 crore of the IPO money is set aside for cloud computing equipment and infrastructure; none of it had been spent by 30 Sep 2026.
15Where it sells
15Where it sells · FY26
Where does ESDS sell?
- India74.5%
- Outside India25.5%
16Competitors and what protects it
16Competitors and what protects it
Who does ESDS compete with?
E2E Networks
NSE: E2E
The RHP's only listed peer: a cloud provider offering cloud hosting, managed services and infrastructure, focused on businesses, especially small ones.
CtrlS Datacenters
Named in the RHP's list of Indian competitors across ESDS's products and services.
Nxtra by Airtel
Bharti Airtel's data-centre business, named in the same RHP list.
Yotta Data Services
Named in the same RHP list of Indian competitors.
Sify Infinit Spaces
Named in the same RHP list of Indian competitors.
What protects the business
Each strength is scored 1 (weak) to 5 (strong) for the business, with the reason. It is not a rating of the share.
- Data-centre network3 of 5
Five Tier 3 certified data centres in India with more than 75,266 sq ft combined. The FY26 annual report says high capital needs create entry barriers that favour established operators.
- Government and bank community clouds3 of 5
104 government clients and 115 banks and financial institutions across 1,045 branches used its community clouds at 30 Jun 2026.
- Own cloud technology2 of 5
SWARAJ Cloud's vertical autoscaling technology is patented in the US and India, but R&D spend was ₹6.25 crore in FY26, 1.32% of revenue.
Weak spot
A few large customers
The largest customer paid 15.9% and the top ten 45.4% of FY26 revenue. The GPU contract depends on one customer and one supplier, SharonAI.
17Where growth could come from
17Where growth could come from
Where could ESDS' growth come from?
Chairman and MD Piyush Somani said on the Q2 FY27 call (2 Nov 2026) that the GPU capacity would be ready for service by 17 Dec 2026 "on the higher side", possibly in early December, and that ESDS expects to book one month of its revenue in Q3 FY27. He said monthly revenue from it would be ₹288 crore; management also said ESDS's liability to SharonAI is ₹3,000 crore a year.
GPU rental contract
BehindGo-live: by Sep 2026 (RHP) → by 17 Dec 2026 (2 Nov call)
The RHP of 24 Aug 2026 targeted completion by September 2026. Management said on 25 Sep 2026 it expected go-live in the first week of November, and on 2 Nov 2026 early to mid December.
Status: Behind, behind the company's own plan.
IPO-funded cloud equipment
Early₹576.0 cr planned; nil spent to 30 Sep 2026
The RHP plans ₹432.0 crore in FY27 and ₹144.0 crore in FY28 for cloud computing equipment at its data centres. ₹673.09 crore of IPO money was unused at 30 Sep 2026.
Status: Early, too early to judge.
Government customers
WorkingGovernment revenue ₹97.53 cr → ₹129.26 cr, FY24–FY26
Government bodies were 27.4% of FY26 revenue; its government community cloud had 104 clients at 30 Jun 2026.
Status: Working, on track against what the company said.
Customers outside India
MixedRevenue outside India ₹15.14 cr → ₹120.44 cr, FY24–FY26
India Ratings said customer concentration eased in FY26 partly because revenue from a Russian financial institution fell under economic sanctions.
Status: Mixed, partly on track.
Status compares progress with what the company itself said it would do: Working = on track against what the company said; Mixed = partly on track; Behind = behind the company's own plan; New = recently announced; Early = too early to judge.
Sources (5)
- ESDS Software Solution: Transcript of Q2 FY27 earnings call (2 Nov 2026)
- ESDS Software Solution Ltd: Red Herring Prospectus (IPO)
- ESDS Software Solution: Transcript of Q1 FY27 earnings call (25 Sep 2026)
- ESDS Software Solution: Investor presentation, Q2 FY27
- India Ratings upgrades ESDS Software Solution bank loan facilities to IND A/Stable/IND A1
18Financial strength and debt
18Financial strength · 31 Mar 2026
How much debt does ESDS have?
- Total debt₹42.9 cr
- Cash and investments₹1,253 cr
- Net cash (cash minus debt)₹1,210 cr
- Net worth (shareholders' money)₹544 cr
- Debt to equity
- 0.08×
- ₹ of debt for every ₹1 of shareholders' money
- The GPU customer's advance sits in other current liabilities, ₹1,195.72 crore at 31 Mar 2026 against ₹14.45 crore a year earlier; it is to be recognised as revenue after go-live.
- At 30 Sep 2026, after the IPO, borrowings were ₹48.05 crore, cash and cash equivalents ₹1,636.83 crore, other bank balances ₹341.98 crore and equity ₹1,294.54 crore, the Q2 FY27 filing shows.
- At 30 Sep 2026 other current and non-current liabilities were ₹1,921.69 crore and ₹670.86 crore; other current and non-current assets were ₹716.10 crore and ₹696.16 crore. Management said on 2 Nov 2026 these reflect the customer advance and a US$140 million advance ESDS paid SharonAI.
- Lease liabilities (₹53.55 crore at 31 Mar 2026) are not counted as borrowings. Net debt and debt to equity are Cityfort calculations.
- Contingent liabilities were 10.43% of net worth at 31 Mar 2026, the RHP says.
19Who owns it
19Who owns it · Q2 FY27
Who owns ESDS?
- Promoters (founders or parent company)39.5%
- Foreign institutions (FII)0.6%
- Indian institutions (DII)6.6%
- Public and others53.4%
Promoter pledge
No promoter shares were pledged in Q2 FY27.
How ownership changed
* Pledged = share of the promoters' own holding reported as pledged. In older filings this can include shares “otherwise encumbered”; the governance flags say when.
† Others = Employee benefit trust.
20What it does with profit
20What it does with profit
What does ESDS do with its profit?
Money raised · 4 Sep 2026
IPO fresh issue: 16,783,216 new shares at ₹429 (₹719.99 crore), all for the company; no shares were sold by existing holders. The shares listed on 4 Sep 2026.
₹720 cr
21Governance signals
21Governance signals
What do ESDS' governance filings show?
- Auditor
- MSKC & Associates LLP
- Auditor changes
- None in the period covered
- Audit qualifications
- None reported
- Related-party dealings
- The RHP says related-party transactions totalled ₹49.50 crore in FY26 (10.48% of revenue), ₹87.31 crore in FY25 (24.16%) and ₹13.52 crore in FY24 (4.72%). They were mainly directors' and key managers' pay, payments to and income from subsidiaries, and rent for a data centre sublet from a former subsidiary until Sep 2024.
- Credit rating
- India Ratings (bank loan facilities) IND A / IND A1 (outlook Stable), 29 Sep 2026
A credit rating describes the company's ability to repay debt. It is not a rating of the share.
Flags to know about
auditor · 6 Nov 2026
New statutory auditor
Shah Khandelwal Jain & Associates audited the FY22 to FY24 accounts. MSKC & Associates LLP audited the FY26 accounts.
other · 29 Sep 2026
Three ratings before the IPO were marked 'issuer not cooperating'
The RHP lists CRISIL B/Stable (30 May 2023), and Acuité downgrades to BB+/A4+ (28 Dec 2023) and BB (25 Mar 2025), each marked issuer not cooperating. CRISIL raised its rating to A-/Positive on 16 Sep 2026 and India Ratings to IND A/Stable on 29 Sep 2026.
regulatory · 24 Aug 2026
Delayed TDS payments
The RHP says the company delayed payment of tax deducted at source (TDS) for assessment years 2017-18, 2018-19, 2020-21, 2021-22 and 2022-23 and received show-cause notices. It paid compounding charges of ₹0.61 crore on 4 Apr 2025, and the matters were closed with closure orders.
other · 24 Aug 2026
Cases listed in the RHP
The RHP lists 6 tax proceedings and 1 material civil suit against the company, ₹25.05 crore in total. In the suit, in the Bombay High Court against the company and Piyush Somani, a former employee claims he was entitled to 1% of the shares, allegedly offered in 2015, or ₹18.48 crore as compensation.
related party · 24 Aug 2026
Promoter holds a stake in the GPU subsidiary
Piyush Somani holds 0.50% of SPOCHUB Solutions, the 99.00%-owned subsidiary that holds the GPU customer contract, the RHP says.
disclosure · 2 Nov 2026
Unaudited quarterly comparatives and a missing quarter
The Q1, Q2 and Q4 FY26 figures shown beside the FY27 results were prepared by management and not audited or reviewed. No filing gives Q3 FY26 on its own.
other · 30 Oct 2026
Chief Technology and Information Officer resigned
Sajiv Nair resigned for personal reasons, as filed on 30 Oct 2026, with his last day on or before 27 Jan 2027.
Sources (9)
- ESDS Software Solution: Annual Report 2025-26
- ESDS Software Solution Ltd: Red Herring Prospectus (IPO)
- India Ratings upgrades ESDS Software Solution bank loan facilities to IND A/Stable/IND A1
- ESDS Software Solution: Annual Report 2022-23
- ESDS Software Solution: Annual Report 2023-24
- ESDS Software Solution: Intimation of CRISIL rating upgrade to CRISIL A-/Positive and CRISIL A2+
- ESDS Software Solution: Unaudited results, quarter ended 30 Jun 2026 (Q1 FY27)
- ESDS Software Solution: Unaudited results, quarter and half year ended 30 Sep 2026 (Q2 FY27)
- ESDS Software Solution: Resignation of Chief Technology Officer and Chief Information Officer (Reg. 30)
22What the market paid
22What the market paid · price as of 11 Nov 2026
What did the market pay for ESDS on 11 Nov 2026?
Price as of 11 Nov 2026 (shown for education; prices change daily).
Price as of 11 Nov 2026: ₹1,205.00, the NSE closing price; the IPO price was ₹429 and the shares listed on 4 Sep 2026. Market value: ₹14,124 crore on 117,210,969 shares (shareholding pattern of 30 Sep 2026), a Cityfort calculation. P/E is the price divided by one year's profit per share: 100.2 on FY26 basic EPS of ₹12.03, which was earned on the smaller pre-IPO share count; market value divided by FY26 profit of ₹120.28 crore is 117.4. P/B divides market value by shareholders' equity: 10.9 on ₹1,294.00 crore at 30 Sep 2026. All ratios are Cityfort calculations; EV/EBITDA is not shown.
- Share price
- ₹1,205.00
- Market value (market cap)
- ₹14,124 cr
- P/E
- 100.2×
- P/B
- 10.9×
Source: NSE security-wise historical data, ESDS (EQ), 4 Sep to 11 Nov 2026; ESDS Software Solution: Shareholding pattern, 30 Sep 2026 (XBRL); ESDS Software Solution: Annual Report 2025-26 and 2 more
Sources (5)
- NSE security-wise historical data, ESDS (EQ), 4 Sep to 11 Nov 2026
- ESDS Software Solution: Shareholding pattern, 30 Sep 2026 (XBRL)
- ESDS Software Solution: Annual Report 2025-26
- ESDS Software Solution: Integrated filing (financials, consolidated) XBRL, Q2 FY27
- NSE public issue page: ESDS Software Solution Ltd (issue details, bids, listing date)
23How it got here
23How it got here
How did ESDS get here?
2005
Milestone
Started in Nashik
ESDS started in Nashik in 2005 as a web hosting company.
2023
Crisis
Loss year
ESDS lost ₹22.45 crore in FY23, after a ₹2.72 crore loss in FY22.
2025
Milestone
Fifth data centre
The Noida data centre began operating in Oct 2025, the fifth after Nashik, Navi Mumbai, Bengaluru and Mohali.
2026
Business-model change
GPU agreement with SharonAI
On 31 Mar 2026 ESDS signed a five-year agreement for about 8,208 NVIDIA B300 GPUs in Australia, rented on to one overseas customer.
2026
Milestone
Cloud renamed SWARAJ Cloud
eNlight Cloud was renamed SWARAJ Cloud in June 2026.
2026
Milestone
Listed on NSE and BSE
Listed on 4 Sep 2026 after an IPO at ₹429 a share that raised ₹719.99 crore of new money.
Sources (7)
- ESDS Software Solution: Investor presentation, Q2 FY27
- ESDS Software Solution: Annual Report 2023-24
- ESDS Software Solution: Annual Report 2022-23
- ESDS Software Solution Ltd: Red Herring Prospectus (IPO)
- ESDS Software Solution: Annual Report 2025-26
- ESDS Software Solution: Unaudited results, quarter and half year ended 30 Sep 2026 (Q2 FY27)
- NSE public issue page: ESDS Software Solution Ltd (issue details, bids, listing date)
Used in a free classroom lesson: Project: an IPO filing profile from one RHP.
24Sources and changes
Where every number on this page comes from
Sources (18 documents)
- S1ESDS Software Solution Ltd: Red Herring Prospectus (IPO) · ESDS Software Solution Ltd / NSE · Tier 1: company or exchange filing · 24 Aug 2026
- S2ESDS Software Solution: Annual Report 2025-26 · ESDS Software Solution Ltd / NSE · Tier 1: company or exchange filing · 6 Nov 2026
- S3ESDS Software Solution: Unaudited results, quarter and half year ended 30 Sep 2026 (Q2 FY27) · ESDS Software Solution Ltd / NSE · Tier 1: company or exchange filing · 2 Nov 2026
- S4ESDS Software Solution: Integrated filing (financials, consolidated) XBRL, Q2 FY27 · NSE · Tier 1: company or exchange filing · 2 Nov 2026
- S5ESDS Software Solution: Unaudited results, quarter ended 30 Jun 2026 (Q1 FY27) · ESDS Software Solution Ltd / NSE · Tier 1: company or exchange filing · 24 Sep 2026
- S6ESDS Software Solution: Integrated filing (financials, consolidated) XBRL, Q1 FY27 · NSE · Tier 1: company or exchange filing · 24 Sep 2026
- S8ESDS Software Solution: Investor presentation, Q2 FY27 · ESDS Software Solution Ltd / NSE · Tier 1: company or exchange filing · 2 Nov 2026
- S9ESDS Software Solution: Transcript of Q2 FY27 earnings call (2 Nov 2026) · ESDS Software Solution Ltd / NSE · Tier 1: company or exchange filing · 6 Nov 2026
- S10ESDS Software Solution: Transcript of Q1 FY27 earnings call (25 Sep 2026) · ESDS Software Solution Ltd / NSE · Tier 1: company or exchange filing · 29 Sep 2026
- S11ESDS Software Solution: Shareholding pattern, 30 Sep 2026 (XBRL) · NSE · Tier 1: company or exchange filing · 17 Oct 2026
- S12ESDS Software Solution: Shareholding pattern at listing, 4 Sep 2026 (XBRL) · NSE · Tier 1: company or exchange filing · 9 Sep 2026
- S13India Ratings upgrades ESDS Software Solution bank loan facilities to IND A/Stable/IND A1 · India Ratings and Research · Tier 2: rating agency or regulator · 29 Sep 2026
- S14ESDS Software Solution: Intimation of CRISIL rating upgrade to CRISIL A-/Positive and CRISIL A2+ · ESDS Software Solution Ltd / NSE · Tier 1: company or exchange filing · 17 Sep 2026
- S15NSE security-wise historical data, ESDS (EQ), 4 Sep to 11 Nov 2026 · NSE · Tier 1: company or exchange filing · 11 Nov 2026
- S16NSE public issue page: ESDS Software Solution Ltd (issue details, bids, listing date) · NSE · Tier 1: company or exchange filing · 12 Nov 2026
- S17ESDS Software Solution: Annual Report 2023-24 · ESDS Software Solution Ltd · Tier 1: company or exchange filing · 6 Sep 2024
- S18ESDS Software Solution: Annual Report 2022-23 · ESDS Software Solution Ltd · Tier 1: company or exchange filing · 5 Sep 2023
- S19ESDS Software Solution: Resignation of Chief Technology Officer and Chief Information Officer (Reg. 30) · ESDS Software Solution Ltd / NSE · Tier 1: company or exchange filing · 30 Oct 2026
Changes to this page (v1 · 12 Nov 2026)
- v1 · 12 Nov 2026First version. (first version)
Numbers come only from tier 1 and tier 2 sources. Read how we research.
Disclaimer
For learning only. Cityfort is not a SEBI-registered adviser and does not recommend buying or selling any security. Prices shown are dated and may be out of date.
Investing in securities involves risk, including loss of capital. Before making any investment decision, do your own research and consider consulting a SEBI-registered investment adviser.
Cityfort, its owners and contributors may or may not hold securities of companies covered. Content is not an offer or solicitation to buy or sell any security.
Read the full disclaimerHide the full disclaimer
Cityfort publishes educational content that explains how listed companies work. Cityfort is not registered with the Securities and Exchange Board of India (SEBI) as an Investment Adviser or Research Analyst and does not provide investment advice, recommendations, ratings, price targets or any opinion on whether to buy, sell or hold any security.
All information is taken from publicly available sources, mainly company filings on BSE and NSE, which are listed on each page with dates. We work to keep it accurate and correct errors publicly, but we do not guarantee that it is complete, accurate or up to date. Any market price or price-based ratio shown is dated, may be out of date by the time you read it, and is included only to explain concepts.
Statements by company management are reported as statements, with their date and source; they are not our forecasts.