Information Technology · NSE: WIPRO · BSE: 507685
Wipro: how the business works
Wipro builds, runs and fixes computer systems for large companies, mostly in the Americas and Europe, earning ₹92,624 crore of revenue in FY26.
Follow Wipro
Email me when Wipro's page is updated after results.
We store your email address with Kit, our email provider, which also records when you sign up and whether you open or click our emails. We send a confirmation email first. See our privacy policy.
Wipro Limited · Bengaluru, Karnataka · Founded 1945
Updated for Q2 FY27 · checked
- Revenue, FY26
- ₹92,624 cr
- Net profit to shareholders, FY26
- ₹13,197 cr
- Employees, 30 Sep 2026
- 236,328
- In business since
- 1945
- Promoter holding, Sep 2026
- 72.58%
The short version
Wipro in 5 points
1 · What it sells
Wipro sells the work of its engineers and consultants, who build, run and fix computer systems for large companies, and its revenue was ₹92,624 crore in FY26.
2 · Who pays it
In FY26 banks, financial firms and insurers paid 34.1% of Wipro's IT services revenue, consumer businesses 18.4%, energy, manufacturing and resources companies 17.0%, technology and communications companies 16.0% and health companies 14.5%.
3 · What it keeps from ₹100
Of every ₹100 that came in during FY26, Wipro kept ₹13.7 as profit for its shareholders after ₹57.6 of staff pay, with ₹4.0 of the ₹100 coming from other income rather than clients and EBITDA from operations at ₹19.3 per ₹100 of revenue.
4 · Where the operating profit comes from
On the customer map used until March 2026, Americas 1 was Wipro's largest unit in FY26 with 32.9% of segment revenue and a segment result of 20.6% of its revenue, against 19.7% for Americas 2, 12.7% for Europe and 14.6% for APMEA (Cityfort calculation).
5 · The one thing to watch
Wipro CEO Srini Pallia said on 16 Jul 2026 that the aim is to return the operating margin to a 17% to 17.5% band, without predicting when, and Wipro reported an IT services operating margin of 16.5% for Q2 FY27.
Sources: From Wipro's FY26 integrated annual report, the Q2 FY27 analyst datasheet and the Q1 FY27 earnings call · checked
01Where the money goes · FY26
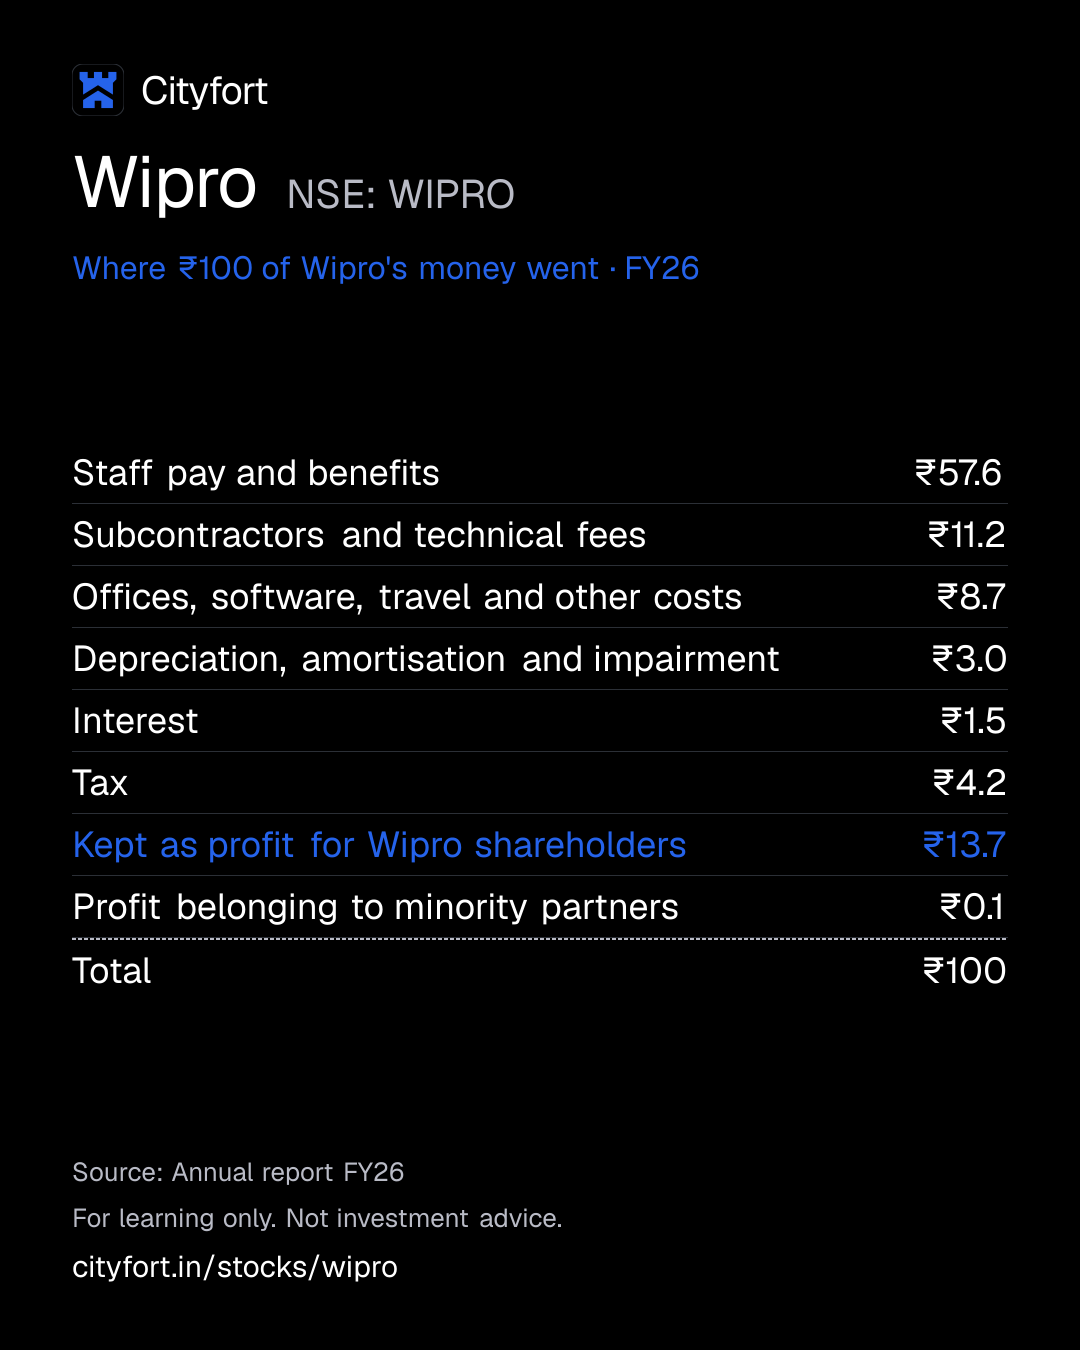
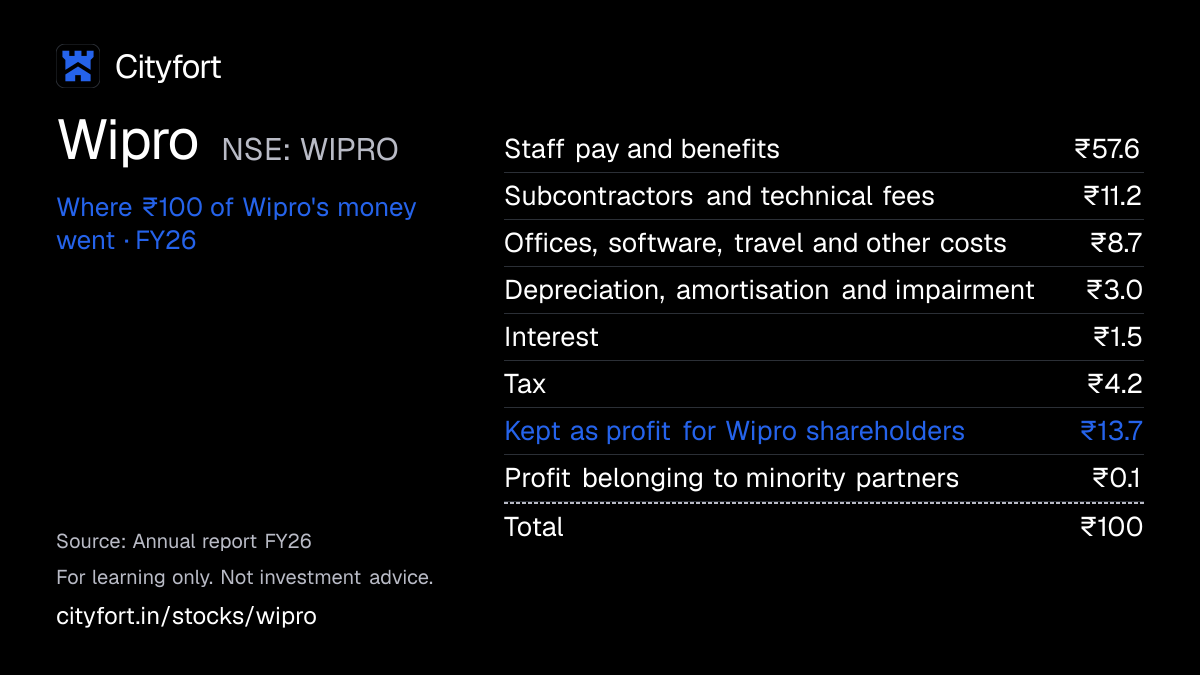
Where does ₹100 of Wipro's money go?
Wipro · FY26
Receipt for every ₹100
| Staff pay and benefits | ₹57.6 |
|---|---|
| Subcontractors and technical fees | ₹11.2 |
| Offices, software, travel and other costs | ₹8.7 |
| Depreciation, amortisation and impairment | ₹3.0 |
| Interest | ₹1.5 |
| Tax | ₹4.2 |
| Kept as profit for Wipro shareholders | ₹13.7 |
| Profit belonging to minority partners | ₹0.1 |
| Total | ₹100 |
Each line = amount ÷ total money in × 100. Lines may not add to exactly ₹100 because of rounding.
How this is worked out
Of every ₹100 that came in during FY26 (revenue ₹92,624 crore + other income ₹3,874 crore). Other income, not paid by clients, was ₹4.0 of every ₹100. Other costs are shown net of ₹26 crore of profit from associates. Lines are rounded.
Save this receipt as an image
Embed this receipt or the key numbers
Paste this code into a blog or website to show the card you choose, with a link back to this page.
Each week: the next company due to report results, explained in 5 points.
We'll email you once a week with what changed on Cityfort. Facts only, no tips. Unsubscribe any time.
We store your email address with Kit, our email provider, which also records when you sign up and whether you open or click our emails. We send a confirmation email first. See our privacy policy.
02The business in one line
What does Wipro do?
Companies pay Wipro for its engineers' work; staff pay takes ₹57.6 of every ₹100 coming in, and ₹13.7 is profit for shareholders.
- In FY26 banks, financial firms and insurers paid 34.1% of Wipro's IT services revenue. US clients paid 59.7% of all revenue (Cityfort calculation from the FY26 annual report).
- In June 2026 Wipro bought back 600,000,000 of its shares for ₹15,000 crore. On 30 Sep 2026 its cash and liquid investments still exceeded borrowings by ₹25,152 crore (Cityfort calculation).
03Who pays it
Who pays Wipro?
Banking, financial services and insurance
34.1%
of revenue
Banks, financial-services, capital-markets and insurance companies.
Consumer
18.4%
of revenue
Consumer-facing companies.
Energy, manufacturing and resources
17%
of revenue
Energy, manufacturing and natural-resource companies.
Technology and communications
16%
of revenue
Technology, communications and media companies.
Health
14.5%
of revenue
Healthcare companies.
- Banking, financial services and insurance34.1%
- Consumer18.4%
- Energy, manufacturing and resources17%
- Technology and communications16%
- Health14.5%
How spread out the customers are
Shares of FY26 IT services revenue. No single customer gave Wipro 10% or more of revenue in FY26. 97.3% of FY26 revenue came from existing clients, and 16 clients each paid more than US$100 million.
- Largest customer
- 5%
- Top 5 customers
- 14%
- Top 10 customers
- 24%
04How it makes money
How does Wipro make money?
It sells skilled people's time; pay, prices and how fully staff are used decide the margin
Wipro bills clients for staff time or fixed-price work, so revenue tracks headcount and prices. Staff pay took ₹60.0 of every ₹100 of revenue in FY26, up from ₹56.9 in FY22 (Cityfort calculation). Wipro's IT services operating margin, a company figure, was 17.2% in FY26.
Staff pay per ₹100 of revenue
₹56.9₹60.0
FY22 to FY26
- Clients sign IT contracts, some worth US$30 million or more
- Wipro staffs the work, 61.1% of it offshore in FY26
- Clients pay by time spent or a fixed price
- Staff and subcontractors take ₹68.8 of every ₹100 coming in
- Low capex (₹1,560 crore in FY26) turns most profit into cash
↺ Step 5 feeds back into step 1.
05Business segments · FY26 (customer map used until 31 Mar 2026)
Which businesses make up Wipro?
Americas 1
32.9%US clients in communications, media, technology, health and consumer businesses, plus all of Latin America. Segment result was 20.6% of its revenue (Cityfort calculation). On the map used from 1 Apr 2026, FY26 restates to ₹32,812 crore.
Revenue ₹30,557 cr · Operating profit ₹6,290 cr
Americas 2
29%US clients in banking, financial services, capital markets, insurance, energy, manufacturing, resources and hi-tech, plus Canada. Segment result was 19.7% of its revenue. On the new map, FY26 restates to ₹24,653 crore.
Revenue ₹26,908 cr · Operating profit ₹5,314 cr
Europe
26.3%Clients in the UK and Ireland, Switzerland, Germany and Western Europe. Segment result was 12.7% of its revenue.
Revenue ₹24,417 cr · Operating profit ₹3,108 cr
Asia Pacific, Middle East and Africa (APMEA)
11%Australia, New Zealand, Southeast Asia, Japan, India, the Middle East and Africa. Segment result was 14.6% of its revenue.
Revenue ₹10,234 cr · Operating profit ₹1,496 cr
IT Products
0.7%Resold software and hardware supplied inside some outsourcing contracts.
Revenue ₹694 cr · Operating profit ₹56 cr
How the mix changed
- Americas 1
- Americas 2
- Europe
- Asia Pacific, Middle East and Africa (APMEA)
- IT Products
Revenue by segment, FY22 to FY26.
₹ crore
See the numbers
Sources (5)
06The numbers · Consolidated · ₹ crore
How has Wipro done?
Revenue
₹92,624 crFY26
Revenue dipped in FY24 and FY25, then rose 4.0% to ₹92,624 crore in FY26, though Wipro said it fell 1.6% in constant currency.
₹ crore
See the numbers
Net profit
₹13,197 crFY26
Net profit to shareholders was ₹13,197 crore in FY26; Q3 FY26 carried a ₹302.8 crore pre-tax labour-code charge, and Q2 FY27 EPS rose while profit fell because the June 2026 buyback cut the share count.
₹ crore
See the numbers
Net profit for every ₹100 of revenue
₹14.2FY26
EBITDA per ₹100 of revenue was ₹21.1 in FY22, ₹18.6 in FY23 and ₹19.3 in FY26.
Net margin: ₹ of net profit per ₹100 of revenue
See the numbers
Free cash flow
₹13,371 crFY26
Free cash flow was larger than net profit in every year from FY23 to FY26, and was ₹13,371 crore in FY26.
₹ crore · cash from operations minus spending on plants and equipment
See the numbers
See all yearly numbers
EBITDA = profit before interest, tax and wear-and-tear of assets. Financial year runs April to March (March year end). Net profit is the share belonging to the company's owners.
Sources (14)
- Integrated Annual Report FY23 (zip)
- Integrated Annual Report FY24
- Integrated Annual Report FY25
- Integrated Annual Report FY26 (incl. consolidated Ind AS financial statements and BRSR)
- Q3 FY25 consolidated results, XBRL
- Q4 FY25 consolidated results, XBRL (integrated filing)
- Reply to NSE clarification on Q3 FY26 XBRL (profit before tax excludes share of associates)
- Q1 FY26 consolidated results, XBRL (integrated filing)
- Q2 FY26 consolidated results, XBRL (integrated filing)
- Q3 FY26 consolidated results, XBRL (integrated filing)
- Press release: results for the quarter ended 31 Dec 2025 (labour-code adjustment)
- Q4 FY26 consolidated results, XBRL (integrated filing)
- Q1 FY27 consolidated results, XBRL (integrated filing)
- Q2 FY27 consolidated results, XBRL (integrated filing)
07Who runs it
Who runs Wipro, and did they deliver?
Rishad A. Premji
Executive Chairman
Son of Azim H. Premji, the Founder Chairman.
Azim H. Premji
Founder Chairman; non-executive, non-independent director
Represents the three partnership firms that hold most of the promoter group's shares.
Srinivas Pallia
Chief Executive Officer and Managing Director · since 2024
In the role from 7 Apr 2024, after Thierry Delaporte resigned.
Aparna C. Iyer
Chief Financial Officer
Joined Wipro on 21 Apr 2003.
What they said, and what happened
3 delivered · 2 too early to tell
Said on 16 Apr 2026
The CFO said on 16 Apr 2026 that Q1 FY27 IT services revenue was expected to be US$2,597–2,651 million.
DeliveredWhat happened
Q1 FY27 IT services revenue was US$2,614.5 million, inside the range.
Said on 16 Apr 2026
The CFO said on 16 Apr 2026 that the ₹15,000 crore buyback was expected to complete in Q1 FY27, subject to shareholder approval.
DeliveredWhat happened
The tender ran from 11 to 17 Jun 2026, and the 600,000,000 shares were cancelled on 25 Jun 2026.
Said on 16 Jul 2026
The CFO said on 16 Jul 2026 that Q2 FY27 IT services revenue was expected to be US$2,574–2,627 million.
DeliveredWhat happened
Q2 FY27 IT services revenue was US$2,611.5 million, inside the range.
Said on 16 Jul 2026
CEO Srini Pallia said on 16 Jul 2026 the aim is to return the operating margin to a 17% to 17.5% band. He did not predict when.
Too early to tellWhat happened
IT services operating margin was 16.0% in Q1 FY27 and 16.5% in Q2 FY27. On 15 Oct 2026 the CFO gave no timeline.
Said on 15 Oct 2026
CEO Srini Pallia said on 15 Oct 2026 that two deals not signed on time in Q2 FY27 will get signed.
Too early to tellWhat happened
Q3 FY27 results will show the next bookings figure.
Sources (10)
- Integrated Annual Report FY26 (incl. consolidated Ind AS financial statements and BRSR)
- Shareholding pattern, quarter ended 30 Sep 2026 (XBRL)
- Integrated Annual Report FY25
- Transcript, Q4 FY26 earnings call (16 Apr 2026)
- Analyst datasheet Q2 FY27 (Q1 FY26 to Q2 FY27 KPIs)
- Q2 FY27 results (Regulation 33, standalone and consolidated Ind AS; scanned PDF)
- Public announcement: buyback of up to 600,000,000 shares at ₹250 (tender offer)
- Shareholding pattern as of 25 Jun 2026 (after buyback extinguishment; XBRL)
- Transcript, Q1 FY27 earnings call (16 Jul 2026)
- Transcript, Q2 FY27 earnings call (15 Oct 2026)
08What could go wrong
What could go wrong for Wipro?
- Demand
Revenue not growing in constant currency
Wipro reported constant-currency revenue falls in FY24, FY25 and FY26. Its Q3 FY27 guidance, given on 15 Oct 2026, is −1.5% to +0.5% over Q2. Total bookings were US$2,595 million in Q2 FY27, against US$4,688 million a year earlier.
Watch Constant-currency growth and total bookings in each results press release.
- Concentration
Dependence on US clients
US clients gave 59.7% of FY26 revenue (Cityfort calculation), and 61% of FY26 revenue was billed in US dollars.
Watch Americas 1 and Americas 2 revenue in each quarter's segment results.
- Execution
Pay rises and margins
Staff pay took ₹60.0 of every ₹100 of FY26 revenue (Cityfort calculation). The IT services operating margin fell from 17.3% in Q4 FY26 to 16.0% in Q1 FY27. On 16 Jul 2026 CEO Srini Pallia linked the fall to the pay rise, AI and deal investments, and recent acquisitions.
Watch IT services operating margin against the 17% to 17.5% band the CEO described on 16 Jul 2026.
- Currency
Currency swings
Only 5% of FY26 revenue was in rupees, so exchange rates move reported revenue. FY26 revenue rose 4.0% in rupees but fell 1.6% in constant currency. The Q3 FY27 guidance, given on 15 Oct 2026, assumes US$1 = ₹95.76.
Watch Gap between rupee growth and constant-currency growth each quarter.
- Regulation
US immigration rules
On 13 Oct 2026 Wipro said it did not anticipate any material business impact from the US suspension of new PERM (permanent residency) applications for certain companies. It said over 80% of its US workforce was hired locally.
Watch Company statements on US visa and work-permit rules.
- Execution
Acquisitions and goodwill
Goodwill from past acquisitions was ₹40,394 crore on 30 Sep 2026, 51.2% of shareholders' equity (Cityfort calculation). FY26 included an ₹85.1 crore impairment of acquired intangibles.
Watch Impairment charges and acquisition spending in results and annual reports.
- Legal
Tax disputes
Income-tax claims of ₹10,461 crore that Wipro does not accept as debt were pending on 31 Mar 2026. Wipro says it expects its position will likely be upheld.
Watch The contingent liabilities note in each annual report.
Sources (8)
- Analyst datasheet Q1 FY26 (FY24 to Q1 FY26 KPIs)
- Analyst datasheet Q2 FY27 (Q1 FY26 to Q2 FY27 KPIs)
- Integrated Annual Report FY26 (incl. consolidated Ind AS financial statements and BRSR)
- Press release: results for the quarter ended 30 Sep 2026 (IFRS; KPIs, guidance, restated SMU segments)
- Transcript, Q1 FY27 earnings call (16 Jul 2026)
- Company statement on the U.S. Permanent Labor Certification (PERM) programme
- Q2 FY27 results (Regulation 33, standalone and consolidated Ind AS; scanned PDF)
- Q2 FY27 consolidated results, XBRL (integrated filing)
09Supporters and critics
What do supporters and critics point to?
What supporters point to
- Free cash flow was larger than net profit in every year from FY23 to FY26; it was ₹13,371 crore in FY26.
- Cash and liquid investments exceeded borrowings by ₹25,152 crore on 30 Sep 2026, after the ₹15,000 crore buyback (Cityfort calculation).
- No customer gave 10% or more of FY26 revenue; the largest gave 4.6% of IT services revenue.
- Large-deal bookings were US$7,829 million in FY26, up from US$5,368 million in FY25, Wipro reported.
- The CFO said on 16 Apr 2026 that Wipro paid out about 88% of net income over the three years to FY26.
What critics point to
- Wipro reported constant-currency revenue falls of 4.4% in FY24, 2.3% in FY25 and 1.6% in FY26.
- IT services revenue was US$10,478 million in FY26, below US$11,160 million in FY23.
- Q2 FY27 net profit to shareholders fell 1.4% from a year earlier to ₹3,201 crore, while revenue rose 9.1%.
- The IT services operating margin was 16.5% in Q2 FY27, below the 17% to 17.5% band the CEO described on 16 Jul 2026.
- Total bookings were US$2,595 million in Q2 FY27, against US$4,688 million a year earlier.
10What to watch next
What should you watch next at Wipro?
Next event
Q3 FY27 results (date not announced yet; last year's Q3 results came on 16 Jan 2026)
Date not announced yet.
Revenue against guidance
In guidance given on 15 Oct 2026, Wipro expects Q3 FY27 IT services revenue of US$2,571–2,625 million, −1.5% to +0.5% in constant currency.
Operating margin
The IT services operating margin was 16.5% in Q2 FY27. The CEO said on 16 Jul 2026 the aim is a return to 17% to 17.5%; on 15 Oct 2026 the CFO gave no timeline.
Deal signings
Total bookings were US$2,595 million in Q2 FY27. The CEO said on 15 Oct 2026 that two deals that slipped will get signed.
11Key facts
Key facts about Wipro
- What does Wipro do?
- Wipro Ltd is an Indian IT services company based in Bengaluru. Wipro builds and maintains software, runs IT systems and back-office work, and advises companies on technology. Wipro's revenue was ₹92,624 crore in FY26.
- How does Wipro make money?
- Wipro bills clients for its staff's work, by time spent or at a fixed price. Fixed-price contracts gave 54.3% of Wipro's FY26 IT services revenue. IT services were 99.3% of Wipro's FY26 segment revenue and IT products 0.7% (Cityfort calculation from the FY26 annual report).
- Who are Wipro's customers?
- Wipro had 1,233 active clients in FY26. Banks, financial firms and insurers gave Wipro 34.1% of FY26 IT services revenue, and consumer businesses 18.4%. Wipro's largest client gave 4.6% and its top 10 clients 23.7% of FY26 IT services revenue.
- Where does Wipro earn its revenue?
- In FY26 Wipro earned ₹55,319 crore from clients in the United States, 59.7% of revenue. The United Kingdom gave Wipro ₹9,704 crore (10.5%) and India ₹2,345 crore (2.5%). The shares are a Cityfort calculation from the FY26 annual report.
- How big is Wipro?
- In FY26 (April 2025 to March 2026), Wipro had revenue of ₹92,624 crore and net profit to shareholders of ₹13,197 crore. Wipro had 236,328 employees on 30 Sep 2026.
- Who owns Wipro?
- On 30 Sep 2026 Wipro's promoter group owned 72.58%, with no shares pledged. The group includes Azim H. Premji, three partnership firms he represents and the Azim Premji Trust. Foreign portfolio investors held 9.46% of Wipro and Indian institutions 5.13%. JP Morgan Chase Bank held 2.63% as depository for Wipro's American Depositary Shares (ADSs), which trade in New York. Individuals, companies and others, including a 0.12% employee trust, held 10.20%.
- Does Wipro have debt?
- On 30 Sep 2026 Wipro had borrowings of ₹18,502 crore, all due within a year. Wipro held ₹43,654 crore of cash and current investments (Cityfort calculation from the Q2 FY27 results). Wipro also owed ₹3,604 crore under leases.
- How did Wipro do in Q2 FY27?
- In Q2 FY27 (July to September 2026), Wipro's revenue rose 9.1% from a year earlier to ₹24,753 crore. Wipro's net profit to shareholders fell 1.4% to ₹3,201 crore. Wipro said its IT services revenue was flat over Q1 FY27 in constant currency, which removes exchange-rate changes.
- How much does Wipro return to shareholders?
- Wipro declared dividends of ₹11 per share for FY26 and paid ₹11,578 crore of dividends in cash during FY26. In June 2026 Wipro bought back 600,000,000 shares at ₹250 each, a ₹15,000 crore buyback.
Sources (9)
- Integrated Annual Report FY26 (incl. consolidated Ind AS financial statements and BRSR)
- Board outcome 16 Apr 2026: FY26 results and buyback approval
- Analyst datasheet Q2 FY27 (Q1 FY26 to Q2 FY27 KPIs)
- Shareholding pattern, quarter ended 30 Sep 2026 (XBRL)
- Q2 FY27 results (Regulation 33, standalone and consolidated Ind AS; scanned PDF)
- Q2 FY27 consolidated results, XBRL (integrated filing)
- Q2 FY26 consolidated results, XBRL (integrated filing)
- Press release: results for the quarter ended 30 Sep 2026 (IFRS; KPIs, guidance, restated SMU segments)
- Public announcement: buyback of up to 600,000,000 shares at ₹250 (tender offer)
Terms on this page
- Capital expenditure (capex)
- Credit rating
- Customer concentration
- Dividend payout ratio
- EBITDA
- FII and DII holding
- Free cash flow
- Market capitalisation
- Net debt
- Net profit
Each explains the term in plain English, with the same number from other companies on Cityfort.
Go deeper
More detail from the same filings. Open any section.
12What it sells
12What it sells
What does Wipro sell?
Building and updating software
Designs and writes software for clients, and modernises old systems. Wipro lists custom application development and modernisation among its services.
Consulting
Advises companies on AI, technology and industry problems. Wipro bought Capco, a capital-markets consulting firm, for ₹10,953 crore in 2021.
Running IT systems, data and security
Runs clients' IT infrastructure, data and analytics work, and cybersecurity for them.
Business process services
Runs back-office processes for clients.
Engineering and design
Research and development, and hardware and software design. Wipro bought HARMAN Digital Transformation Solutions, with over 5,600 staff, for ₹3,404 crore in Dec 2025.
IT products
Resells security, packaged and SaaS software of international brands, and supplies hardware inside some outsourcing contracts. Revenue was ₹694 crore in FY26.
Think of it like this
Like a contractor for computer systems: clients pay for the team's time or a fixed project price.
What it does
- Does: Works for 1,233 active clients; 16 paid it more than US$100 million each in the 12 months to March 2026.
- Does: Delivers much of its work away from client sites: offshore work was 61.1% of FY26 IT services revenue.
- Does: Earned 97.5% of the parent company's FY26 turnover from exports (FY26 BRSR, standalone).
What it does not do
- Does not: Does not earn much in India: Indian clients gave ₹2,345 crore, 2.5% of FY26 revenue (Cityfort calculation).
- Does not: Does not depend on one client: the largest gave 4.6% of FY26 IT services revenue.
- Does not: Is not the same company as Wipro Enterprises (P) Ltd, a separate promoter-controlled company. Wipro Ltd made ₹34.8 crore of sales to it in FY26.
13How the money flows
13How the money flows · FY26
How does money flow through Wipro?
Money in
- Revenue from operations₹92,624 cr
- Other income₹3,874 cr
The company
Wipro
₹96,498 cr came in
Money out
- Staff pay and benefits₹55,586 cr
- Fees to subcontractors and technical fees₹10,767 cr
- Offices, software licences, travel, resold products and other costs₹8,435 cr
- Depreciation, amortisation and impairment₹2,911 cr
- Interest₹1,458 cr
- Tax₹4,077 cr
- Profit after tax (₹13,197 crore to Wipro shareholders, ₹68 crore to minority partners)₹13,266 cr
- In FY26 clients paid Wipro ₹92,624 crore. It also had ₹3,874 crore of other income.
- Staff pay and benefits took the biggest share: ₹55,586 crore.
- Subcontractors took ₹10,767 crore. Offices, software, travel and other costs took ₹8,435 crore.
- Depreciation, interest and tax took ₹8,446 crore.
- The ₹13,266 crore left was profit. Of it, ₹13,197 crore belonged to Wipro's shareholders.
14What it needs to run
14What it needs to run
What does Wipro need to run?
People
236,328 employees on 30 Sep 2026, down from 243,044 on 30 Jun 2026. In the 12 months to Sep 2026, 13.8% of IT services staff left voluntarily.
Offices and delivery centres
52 offices in India and 165 abroad, serving markets in 65 countries (FY26 BRSR, parent company).
Subcontractors
Wipro also pays outside firms and contractors. Their fees were ₹10,767 crore in FY26, up from ₹10,015 crore in FY25.
Software licences
Software Wipro licenses for its own use cost ₹2,172 crore in FY26.
15Where it sells
15Where it sells · FY26
Where does Wipro sell?
- United States59.7%
- United Kingdom10.5%
- India2.5%
- Other countries27.3%
16Competitors and what protects it
16Competitors and what protects it
Who does Wipro compete with?
Tata Consultancy Services Ltd
NSE: TCS
Named by ICRA as a competitor. Sells IT services and consulting to large companies worldwide; FY26 consolidated revenue ₹267,021 crore.
Infosys Ltd
NSE: INFY
Named by ICRA as a competitor. Sells IT services and consulting to large companies worldwide; FY26 consolidated revenue ₹178,650 crore.
HCL Technologies Ltd
NSE: HCLTECH
Named by ICRA as a competitor. Sells IT services, engineering services and its own software; FY26 consolidated revenue ₹130,144 crore.
Tech Mahindra Ltd
NSE: TECHM
Sells IT services, its FY26 annual report shows; FY26 consolidated revenue ₹56,815 crore. ICRA's Wipro report does not name it.
Accenture, IBM, Cognizant and Capgemini
Named by ICRA as the international IT firms Wipro competes with. They are not listed in India.
What protects the business
Each strength is scored 1 (weak) to 5 (strong) for the business, with the reason. It is not a rating of the share.
- Spread-out client base4 of 5
1,233 active clients in FY26. The largest gave 4.6% of IT services revenue, and no customer gave 10% or more.
- Repeat business4 of 5
97.3% of FY26 revenue came from existing clients, and 16 clients each paid over US$100 million.
- Cash and credit rating4 of 5
Cash and liquid investments exceeded borrowings by ₹25,152 crore on 30 Sep 2026 (Cityfort calculation). ICRA rated Wipro AAA (Stable) in Jul 2025.
- Own software products1 of 5
IT Products, mostly resold software and hardware, was 0.7% of FY26 segment revenue.
Weak spot
Revenue shrinking in constant currency
Wipro reported constant-currency revenue falls of 4.4% in FY24, 2.3% in FY25 and 1.6% in FY26. IT services revenue was US$10,478 million in FY26, against US$11,160 million in FY23.
Sources (10)
- ICRA rationale: Wipro Limited, ratings reaffirmed [ICRA]AAA (Stable)/[ICRA]A1+
- Tata Consultancy Services Ltd: Integrated Annual Report FY26 (competitor filing)
- Infosys Ltd: Integrated Annual Report FY26 (competitor filing)
- HCL Technologies Ltd: Integrated Annual Report FY26 (competitor filing)
- Tech Mahindra Ltd: Integrated Annual Report FY26 (competitor filing)
- Analyst datasheet Q2 FY27 (Q1 FY26 to Q2 FY27 KPIs)
- Integrated Annual Report FY26 (incl. consolidated Ind AS financial statements and BRSR)
- Q2 FY27 results (Regulation 33, standalone and consolidated Ind AS; scanned PDF)
- Analyst datasheet Q1 FY26 (FY24 to Q1 FY26 KPIs)
- Integrated Annual Report FY23 (zip)
17Where growth could come from
17Where growth could come from
Where could Wipro's growth come from?
Wipro said on 15 Oct 2026 it expects Q3 FY27 IT services revenue of US$2,571–2,625 million, between −1.5% and +0.5% from Q2 in constant currency (growth with exchange-rate changes removed). CEO Srini Pallia said Q3 'will remain impacted by seasonal furloughs' (client holiday shutdowns). On 16 Jul 2026 he said the aim is to return the operating margin to a 17% to 17.5% band, without predicting when. On 15 Oct 2026 CFO Aparna Iyer said management is 'not putting a timeline out there'.
Large deals
MixedUS$7,829 mn large-deal bookings, FY26
Large deals (contracts worth US$30 million or more) rose from US$5,368 million in FY25. In Q2 FY27 they were US$674 million, against US$1,626 million in Q1. On 15 Oct 2026 the CEO said two deals not signed in Q2 'will get signed'.
Status: Mixed, partly on track.
Acquisitions
NewHARMAN DTS for ₹3,404 crore, Dec 2025
Wipro bought HARMAN DTS on 1 Dec 2025 and Mindsprint, the Olam Group's IT arm, on 15 May 2026 as part of an Olam deal. It expects to complete buying Alpha Net Consulting by 31 Dec 2026.
Status: New, recently announced.
AI services
EarlyOver 2,000 engineers in the AI native unit
On 15 Oct 2026 the CEO said the AI native unit, launched in April 2026, had over 2,000 engineers. He said it is seeing growing success in outcome-based deals.
Status: Early, too early to judge.
Europe and APMEA
WorkingEurope ₹6,755 cr in Q2 FY27, from ₹5,953 cr a year earlier
The CEO said on 15 Oct 2026 that Europe and APMEA grew over the previous quarter and year. APMEA revenue was ₹3,095 crore in Q2 FY27, from ₹2,504 crore. Rupee figures include the weaker rupee.
Status: Working, on track against what the company said.
Americas 1
Mixed₹8,499 cr in Q2 FY27, from ₹8,609 cr in Q1
Wipro's largest unit shrank over the quarter. The CEO said on 15 Oct 2026 this was due to client-specific issues and softness in healthcare. Figures are on the map used from 1 Apr 2026.
Status: Mixed, partly on track.
Status compares progress with what the company itself said it would do: Working = on track against what the company said; Mixed = partly on track; Behind = behind the company's own plan; New = recently announced; Early = too early to judge.
Sources (11)
- Press release: results for the quarter ended 30 Sep 2026 (IFRS; KPIs, guidance, restated SMU segments)
- Transcript, Q2 FY27 earnings call (15 Oct 2026)
- Transcript, Q1 FY27 earnings call (16 Jul 2026)
- Integrated Annual Report FY26 (incl. consolidated Ind AS financial statements and BRSR)
- Analyst datasheet Q2 FY27 (Q1 FY26 to Q2 FY27 KPIs)
- Press release: HARMAN DTS acquisition completed
- Press release: Mindsprint (Olam Group IT and digital services) acquisition completed
- Reg 30: Alpha Net Consulting acquisition completion now expected by 31 Dec 2026
- Q2 FY27 consolidated results, XBRL (integrated filing)
- Q2 FY26 consolidated results, XBRL (integrated filing)
- Q1 FY27 consolidated results, XBRL (integrated filing)
18Financial strength and debt
18Financial strength · 30 Sep 2026
How much debt does Wipro have?
- Total debt₹18,502 cr
- Cash and investments₹43,654 cr
- Net cash (cash minus debt)₹25,152 cr
- Net worth (shareholders' money)₹78,959 cr
- Debt to equity
- 0.23×
- ₹ of debt for every ₹1 of shareholders' money
- Debt here means borrowings: ₹18,502 crore on 30 Sep 2026, all due within a year. Lease liabilities (rent owed under leases) were a further ₹3,604 crore.
- Cash and liquid investments = cash and cash equivalents (₹9,502 crore) + current investments (₹34,153 crore), from unrounded figures. Net worth = equity belonging to Wipro shareholders.
- On 31 Mar 2026, before the buyback, cash and liquid investments exceeded borrowings by ₹37,536 crore (Cityfort calculation from the FY26 annual report). The June 2026 buyback paid out ₹15,050.8 crore.
- Contingent liabilities on 31 Mar 2026: income-tax claims of ₹10,461 crore that Wipro does not accept as debt, and ₹2,073 crore of excise, customs, sales-tax and other demands it disputes.
19Who owns it
19Who owns it · Q2 FY27
Who owns Wipro?
- Promoters (founders or parent company)72.6%
- Foreign institutions (FII)9.5%
- Indian institutions (DII)5.1%
- Public and others12.8%
Promoter pledge
No promoter shares were pledged in Q2 FY27.
How ownership changed
* Pledged = share of the promoters' own holding reported as pledged. In older filings this can include shares “otherwise encumbered”; the governance flags say when.
† Others = Depository for US-listed ADSs (JP Morgan Chase Bank).
Sources (12)
- Shareholding pattern, quarter ended 30 Sep 2026 (XBRL)
- Shareholding pattern, quarter ended 30 Jun 2026 (XBRL)
- Shareholding pattern, quarter ended 31 Mar 2026 (XBRL)
- Shareholding pattern, quarter ended 31 Dec 2025 (XBRL)
- Shareholding pattern, quarter ended 30 Sep 2025 (XBRL)
- Shareholding pattern, quarter ended 30 Jun 2025 (XBRL)
- Shareholding pattern, quarter ended 31 Mar 2025 (XBRL)
- Shareholding pattern, quarter ended 31 Dec 2024 (XBRL)
- Shareholding pattern, quarter ended 30 Sep 2024 (XBRL)
- Shareholding pattern, quarter ended 30 Jun 2024 (XBRL)
- Shareholding pattern, quarter ended 31 Mar 2024 (XBRL)
- Shareholding pattern, quarter ended 31 Dec 2023 (XBRL)
20What it does with profit
20What it does with profit
What does Wipro do with its profit?
Dividend per share
₹11.00FY26
Dividend paid for each share, by financial year.
₹ per share
See the numbers
Buyback · 27 Apr 2023
Board approved buying back 269,662,921 shares at ₹445 each through a tender offer. Including ₹2,478 crore of buyback tax, the cash outflow was ₹14,517 crore.
₹12,000 cr
Buyback · 25 Jun 2026
Bought back 600,000,000 shares (5.7% of capital) at ₹250 each through a tender offer; the shares were cancelled on 25 Jun 2026. Promoter-group shares fell by 428,045,126 (Cityfort calculation from the Mar 2026 and 25 Jun 2026 shareholding patterns).
₹15,000 cr
Sources (10)
- Integrated Annual Report FY22 (zip)
- Integrated Annual Report FY23 (zip)
- Integrated Annual Report FY24
- Integrated Annual Report FY25
- Integrated Annual Report FY26 (incl. consolidated Ind AS financial statements and BRSR)
- Board outcome 16 Apr 2026: FY26 results and buyback approval
- Public announcement: buyback of up to 600,000,000 shares at ₹250 (tender offer)
- Q2 FY27 results (Regulation 33, standalone and consolidated Ind AS; scanned PDF)
- Shareholding pattern, quarter ended 31 Mar 2026 (XBRL)
- Shareholding pattern as of 25 Jun 2026 (after buyback extinguishment; XBRL)
21Governance signals
21Governance signals
What do Wipro's governance filings show?
- Auditor
- Deloitte Haskins & Sells LLP
- Auditor changes
- 2 Jun 2026: Deloitte Haskins & Sells LLP → B S R & Co. LLP (Mandatory rotation, not a resignation. Deloitte's term ends at the 81st AGM in 2027. The board approved B S R for five years from then, subject to shareholders.)
- Audit qualifications
- None reported
- Related-party dealings
- In FY26 Wipro made ₹34.8 crore of sales to Wipro Enterprises (P) Ltd, a promoter-controlled company, and bought ₹14.2 crore of equipment from it. Wipro paid about ₹7,869 crore of dividends to promoter-group entities and ₹474 crore to Azim H. Premji.
- Credit rating
- ICRA [ICRA]AAA long term and [ICRA]A1+ short term, on ₹20,000 crore of bank lines (outlook Stable), 7 Jul 2025
A credit rating describes the company's ability to repay debt. It is not a rating of the share.
Flags to know about
auditor · 2 Jun 2026
Auditor to change in 2027 (mandatory rotation)
Deloitte Haskins & Sells LLP gave an unmodified opinion on the FY26 accounts. Its term ends at the 2027 AGM; the board proposed B S R & Co. LLP. KPMG is to audit the US Form 20-F from FY28.
other · 31 Mar 2026
Disputed income-tax claims
On 31 Mar 2026, income-tax claims of ₹10,461 crore were pending before appellate authorities, up from ₹9,943 crore a year earlier. Wipro does not accept them as debt and says it expects its position will likely be upheld.
disclosure · 29 Jan 2026
Profit before tax in the XBRL filing excludes associates
Replying to an NSE query in Jan 2026, Wipro said its XBRL profit-before-tax figure leaves out its share of associates' profit. For Q3 FY26 that was ₹4,131.1 crore, against ₹4,133.9 crore including associates.
Sources (4)
- Integrated Annual Report FY26 (incl. consolidated Ind AS financial statements and BRSR)
- Board outcome 2 Jun 2026: statutory auditor rotation (B S R & Co. LLP from the 81st AGM, 2027); KPMG for Form 20-F from FY28
- ICRA rationale: Wipro Limited, ratings reaffirmed [ICRA]AAA (Stable)/[ICRA]A1+
- Reply to NSE clarification on Q3 FY26 XBRL (profit before tax excludes share of associates)
22What the market paid
22What the market paid · price as of 11 Nov 2026
What did the market pay for Wipro on 11 Nov 2026?
Price as of 11 Nov 2026 (shown for education; prices change daily).
Price as of 11 Nov 2026: ₹197.99, the NSE closing price. Market value = ₹197.99 × 9,905,245,732 shares (30 Sep 2026) = ₹196,114 crore. P/E is the share price divided by one year's profit per share: 15.7 on FY26 EPS of ₹12.60. P/B divides market value by shareholders' equity of ₹78,959 crore on 30 Sep 2026: 2.5. EV/EBITDA adds borrowings to market value, subtracts cash and current investments (30 Sep 2026), then divides by FY26 EBITDA of ₹17,837 crore: 9.6. The FY26 dividend of ₹11 a share is 5.6% of that price. All ratios are Cityfort calculations from the 11 Nov 2026 NSE closing price and Wipro's filings.
- Share price
- ₹197.99
- Market value (market cap)
- ₹196,114 cr
- P/E
- 15.7×
- P/B
- 2.5×
- EV/EBITDA
- 9.6×
Source: NSE CM bhavcopy, 11 Nov 2026 (WIPRO EQ close); Shareholding pattern, quarter ended 30 Sep 2026 (XBRL); Integrated Annual Report FY26 (incl. consolidated Ind AS financial statements and BRSR) and 2 more
Sources (5)
- NSE CM bhavcopy, 11 Nov 2026 (WIPRO EQ close)
- Shareholding pattern, quarter ended 30 Sep 2026 (XBRL)
- Integrated Annual Report FY26 (incl. consolidated Ind AS financial statements and BRSR)
- Q2 FY27 results (Regulation 33, standalone and consolidated Ind AS; scanned PDF)
- Q2 FY27 consolidated results, XBRL (integrated filing)
23How it got here
23How it got here
How did Wipro get here?
1945
Milestone
Starts in 1945
Wipro's FY26 annual report says the company turned 80 that year.
1946
Milestone
Listed on the BSE
ICRA's July 2025 report says Wipro listed on the BSE in 1946 and on the NSE in 1995.
2021
Business-model change
Buys Capco for consulting
Completed buying Capco, a capital-markets consulting firm, on 29 Apr 2021 for ₹10,953 crore in cash.
2022
Milestone
Buys Rizing
Bought Rizing, an SAP consulting firm, on 20 May 2022 for ₹4,385 crore.
2023
Milestone
₹12,000 crore buyback
Bought back 269,662,921 shares at ₹445 each. With buyback tax, ₹14,517 crore left the company.
2024
Business-model change
New chief executive
Srinivas Pallia became CEO and Managing Director on 7 Apr 2024, after Thierry Delaporte resigned.
2024
Milestone
1:1 bonus shares
Wipro issued one bonus share for each share held, allotted in Dec 2024. The share count went from 5.23 billion to 10.47 billion.
2025
Business-model change
Buys HARMAN DTS
Completed buying HARMAN Digital Transformation Solutions, an engineering services business, on 1 Dec 2025 for ₹3,404 crore in cash.
2026
Milestone
Largest buyback
Bought back 600,000,000 shares at ₹250 each for ₹15,000 crore. The CFO called it the largest buyback Wipro has announced.
2026
Business-model change
Customer units redrawn
From 1 Apr 2026, Latin America and Canada were split by industry between Americas 1 and Americas 2, and hi-tech moved into Americas 1.
Sources (14)
- Integrated Annual Report FY26 (incl. consolidated Ind AS financial statements and BRSR)
- ICRA rationale: Wipro Limited, ratings reaffirmed [ICRA]AAA (Stable)/[ICRA]A1+
- Integrated Annual Report FY22 (zip)
- Integrated Annual Report FY23 (zip)
- Integrated Annual Report FY24
- Integrated Annual Report FY25
- Board outcome 17 Oct 2024: 1:1 bonus issue recommended
- Shareholding pattern, quarter ended 30 Sep 2024 (XBRL)
- Shareholding pattern, quarter ended 31 Dec 2024 (XBRL)
- Press release: HARMAN DTS acquisition completed
- Public announcement: buyback of up to 600,000,000 shares at ₹250 (tender offer)
- Q2 FY27 results (Regulation 33, standalone and consolidated Ind AS; scanned PDF)
- Transcript, Q4 FY26 earnings call (16 Apr 2026)
- Press release: results for the quarter ended 30 Sep 2026 (IFRS; KPIs, guidance, restated SMU segments)
24Sources and changes
Where every number on this page comes from
Sources (50 documents)
- S1Integrated Annual Report FY26 (incl. consolidated Ind AS financial statements and BRSR) · Wipro Ltd (filed with NSE/BSE; NSE archive copy) · Tier 1: company or exchange filing · 22 Jun 2026
- S2Integrated Annual Report FY25 · Wipro Ltd (company investor relations site) · Tier 1: company or exchange filing · 21 Jun 2025
- S3Integrated Annual Report FY24 · Wipro Ltd (filed with NSE/BSE; NSE archive copy) · Tier 1: company or exchange filing · 24 Jun 2024
- S4Integrated Annual Report FY23 (zip) · Wipro Ltd (filed with NSE/BSE; NSE archive copy) · Tier 1: company or exchange filing · 17 Jun 2023
- S5Integrated Annual Report FY22 (zip) · Wipro Ltd (filed with NSE/BSE; NSE archive copy) · Tier 1: company or exchange filing · 25 Jun 2022
- S6Q2 FY27 consolidated results, XBRL (integrated filing) · Wipro Ltd (XBRL filed with NSE) · Tier 1: company or exchange filing · 15 Oct 2026
- S7Q1 FY27 consolidated results, XBRL (integrated filing) · Wipro Ltd (XBRL filed with NSE) · Tier 1: company or exchange filing · 16 Jul 2026
- S8Q4 FY26 consolidated results, XBRL (integrated filing) · Wipro Ltd (XBRL filed with NSE) · Tier 1: company or exchange filing · 16 Apr 2026
- S9Q3 FY26 consolidated results, XBRL (integrated filing) · Wipro Ltd (XBRL filed with NSE) · Tier 1: company or exchange filing · 16 Jan 2026
- S10Q2 FY26 consolidated results, XBRL (integrated filing) · Wipro Ltd (XBRL filed with NSE) · Tier 1: company or exchange filing · 16 Oct 2025
- S11Q1 FY26 consolidated results, XBRL (integrated filing) · Wipro Ltd (XBRL filed with NSE) · Tier 1: company or exchange filing · 17 Jul 2025
- S12Q4 FY25 consolidated results, XBRL (integrated filing) · Wipro Ltd (XBRL filed with NSE) · Tier 1: company or exchange filing · 16 Apr 2025
- S13Q3 FY25 consolidated results, XBRL · Wipro Ltd (XBRL filed with NSE) · Tier 1: company or exchange filing · 17 Jan 2025
- S14Q2 FY27 results (Regulation 33, standalone and consolidated Ind AS; scanned PDF) · Wipro Ltd (filed with NSE/BSE; NSE archive copy) · Tier 1: company or exchange filing · 15 Oct 2026
- S15Press release: results for the quarter ended 30 Sep 2026 (IFRS; KPIs, guidance, restated SMU segments) · Wipro Ltd (filed with NSE/BSE; NSE archive copy) · Tier 1: company or exchange filing · 15 Oct 2026
- S16Press release: results for the quarter ended 31 Dec 2025 (labour-code adjustment) · Wipro Ltd (filed with NSE/BSE; NSE archive copy) · Tier 1: company or exchange filing · 16 Jan 2026
- S18Analyst datasheet Q2 FY27 (Q1 FY26 to Q2 FY27 KPIs) · Wipro Ltd (company investor relations site) · Tier 1: company or exchange filing · 15 Oct 2026
- S19Analyst datasheet Q1 FY26 (FY24 to Q1 FY26 KPIs) · Wipro Ltd (company investor relations site) · Tier 1: company or exchange filing · 17 Jul 2025
- S22Transcript, Q2 FY27 earnings call (15 Oct 2026) · Wipro Ltd (filed with NSE/BSE; NSE archive copy) · Tier 1: company or exchange filing · 16 Oct 2026
- S23Transcript, Q1 FY27 earnings call (16 Jul 2026) · Wipro Ltd (filed with NSE/BSE; NSE archive copy) · Tier 1: company or exchange filing · 17 Jul 2026
- S24Transcript, Q4 FY26 earnings call (16 Apr 2026) · Wipro Ltd (filed with NSE/BSE; NSE archive copy) · Tier 1: company or exchange filing · 17 Apr 2026
- S26Shareholding pattern, quarter ended 30 Sep 2026 (XBRL) · Wipro Ltd (XBRL filed with NSE) · Tier 1: company or exchange filing · 9 Oct 2026
- S27Shareholding pattern, quarter ended 30 Jun 2026 (XBRL) · Wipro Ltd (XBRL filed with NSE) · Tier 1: company or exchange filing · 14 Jul 2026
- S28Shareholding pattern, quarter ended 31 Mar 2026 (XBRL) · Wipro Ltd (XBRL filed with NSE) · Tier 1: company or exchange filing · 19 Apr 2026
- S29Shareholding pattern, quarter ended 31 Dec 2025 (XBRL) · Wipro Ltd (XBRL filed with NSE) · Tier 1: company or exchange filing · 10 Jan 2026
- S30Shareholding pattern, quarter ended 30 Sep 2025 (XBRL) · Wipro Ltd (XBRL filed with NSE) · Tier 1: company or exchange filing · 18 Oct 2025
- S31Shareholding pattern, quarter ended 30 Jun 2025 (XBRL) · Wipro Ltd (XBRL filed with NSE) · Tier 1: company or exchange filing · 12 Jul 2025
- S32Shareholding pattern, quarter ended 31 Mar 2025 (XBRL) · Wipro Ltd (XBRL filed with NSE) · Tier 1: company or exchange filing · 8 Apr 2025
- S33Shareholding pattern, quarter ended 31 Dec 2024 (XBRL) · Wipro Ltd (XBRL filed with NSE) · Tier 1: company or exchange filing · 14 Jan 2025
- S34Shareholding pattern, quarter ended 30 Sep 2024 (XBRL) · Wipro Ltd (XBRL filed with NSE) · Tier 1: company or exchange filing · 10 Oct 2024
- S35Shareholding pattern, quarter ended 30 Jun 2024 (XBRL) · Wipro Ltd (XBRL filed with NSE) · Tier 1: company or exchange filing · 12 Jul 2024
- S36Shareholding pattern, quarter ended 31 Mar 2024 (XBRL) · Wipro Ltd (XBRL filed with NSE) · Tier 1: company or exchange filing · 19 Apr 2024
- S37Shareholding pattern, quarter ended 31 Dec 2023 (XBRL) · Wipro Ltd (XBRL filed with NSE) · Tier 1: company or exchange filing · 18 Jan 2024
- S38Shareholding pattern as of 25 Jun 2026 (after buyback extinguishment; XBRL) · Wipro Ltd (XBRL filed with NSE) · Tier 1: company or exchange filing · 4 Jul 2026
- S39ICRA rationale: Wipro Limited, ratings reaffirmed [ICRA]AAA (Stable)/[ICRA]A1+ · ICRA Ltd · Tier 2: rating agency or regulator · 7 Jul 2025
- S40NSE CM bhavcopy, 11 Nov 2026 (WIPRO EQ close) · National Stock Exchange of India · Tier 1: company or exchange filing · 11 Nov 2026
- S41Board outcome 16 Apr 2026: FY26 results and buyback approval · Wipro Ltd (filed with NSE) · Tier 1: company or exchange filing · 16 Apr 2026
- S42Public announcement: buyback of up to 600,000,000 shares at ₹250 (tender offer) · Wipro Ltd (filed with NSE) · Tier 1: company or exchange filing · 25 May 2026
- S43Board outcome 2 Jun 2026: statutory auditor rotation (B S R & Co. LLP from the 81st AGM, 2027); KPMG for Form 20-F from FY28 · Wipro Ltd (filed with NSE) · Tier 1: company or exchange filing · 2 Jun 2026
- S44Press release: agreement to acquire HARMAN Digital Transformation Solutions (DTS) · Wipro Ltd (filed with NSE) · Tier 1: company or exchange filing · 21 Aug 2025
- S45Press release: HARMAN DTS acquisition completed · Wipro Ltd (filed with NSE) · Tier 1: company or exchange filing · 2 Dec 2025
- S46Press release: Mindsprint (Olam Group IT and digital services) acquisition completed · Wipro Ltd (filed with NSE) · Tier 1: company or exchange filing · 15 May 2026
- S47Reg 30: Alpha Net Consulting acquisition completion now expected by 31 Dec 2026 · Wipro Ltd (filed with NSE) · Tier 1: company or exchange filing · 30 Sep 2026
- S50Company statement on the U.S. Permanent Labor Certification (PERM) programme · Wipro Ltd (filed with NSE) · Tier 1: company or exchange filing · 13 Oct 2026
- S51Reply to NSE clarification on Q3 FY26 XBRL (profit before tax excludes share of associates) · Wipro Ltd (filed with NSE) · Tier 1: company or exchange filing · 29 Jan 2026
- S52Board outcome 17 Oct 2024: 1:1 bonus issue recommended · Wipro Ltd (filed with NSE) · Tier 1: company or exchange filing · 17 Oct 2024
- S56Tata Consultancy Services Ltd: Integrated Annual Report FY26 (competitor filing) · Tata Consultancy Services Ltd (NSE archive) · Tier 1: company or exchange filing · 15 May 2026
- S57Infosys Ltd: Integrated Annual Report FY26 (competitor filing) · Infosys Ltd (NSE archive) · Tier 1: company or exchange filing · 30 May 2026
- S58HCL Technologies Ltd: Integrated Annual Report FY26 (competitor filing) · HCL Technologies Ltd (NSE archive) · Tier 1: company or exchange filing · 20 Jul 2026
- S59Tech Mahindra Ltd: Integrated Annual Report FY26 (competitor filing) · Tech Mahindra Ltd (NSE archive) · Tier 1: company or exchange filing · 23 Jun 2026
Changes to this page (v1 · 11 Nov 2026)
- v1 · 11 Nov 2026First version. (first version)
Numbers come only from tier 1 and tier 2 sources. Read how we research.
Disclaimer
For learning only. Cityfort is not a SEBI-registered adviser and does not recommend buying or selling any security. Prices shown are dated and may be out of date.
Investing in securities involves risk, including loss of capital. Before making any investment decision, do your own research and consider consulting a SEBI-registered investment adviser.
Cityfort, its owners and contributors may or may not hold securities of companies covered. Content is not an offer or solicitation to buy or sell any security.
Read the full disclaimerHide the full disclaimer
Cityfort publishes educational content that explains how listed companies work. Cityfort is not registered with the Securities and Exchange Board of India (SEBI) as an Investment Adviser or Research Analyst and does not provide investment advice, recommendations, ratings, price targets or any opinion on whether to buy, sell or hold any security.
All information is taken from publicly available sources, mainly company filings on BSE and NSE, which are listed on each page with dates. We work to keep it accurate and correct errors publicly, but we do not guarantee that it is complete, accurate or up to date. Any market price or price-based ratio shown is dated, may be out of date by the time you read it, and is included only to explain concepts.
Statements by company management are reported as statements, with their date and source; they are not our forecasts.